Note+Follow Our Public Account for Exciting Content to Stay Updated

Source | Mictech Technology
WeChat Official Account | Embedded Column
More and more embedded systems rely on the use of Real-Time Operating Systems (RTOS) to meet real-time demands, reduce time to market, simplify development, and increase code portability. Despite the many benefits of RTOS, it also has its drawbacks, such as potential bugs like improperly assigned task priorities, stack overflows, starvation, deadlocks, and priority inversion.
Some specially designed tools can help RTOS-based developers discover some hard-to-find errors.
What is RTOS?
A Real-Time Operating System (RTOS or real-time kernel) is software that effectively manages CPU time. Most kernels are written in C, with only a small portion of code written in assembly language to adapt the kernel to different CPU architectures. When designing applications with an RTOS kernel, the work is divided into tasks, with each task responsible for a portion of the work. A task (also known as a thread) is a simple program that assumes it has complete control of the CPU. On a single-core CPU, only one task can execute at any given time. The application code also needs to assign priorities to each task based on their importance and allocate a task stack (RAM). Generally, adding low-priority tasks does not affect the system’s response to high-priority tasks. Task implementations are typically infinite loops, with the kernel responsible for task management, known as multitasking. Multitasking is the process of scheduling and switching the CPU between several sequential tasks. It provides the illusion of multiple CPUs, maximizing CPU usage, as shown in Figure 1. Multitasking also helps create modular applications. After using a real-time kernel, applications are easier to design and maintain.
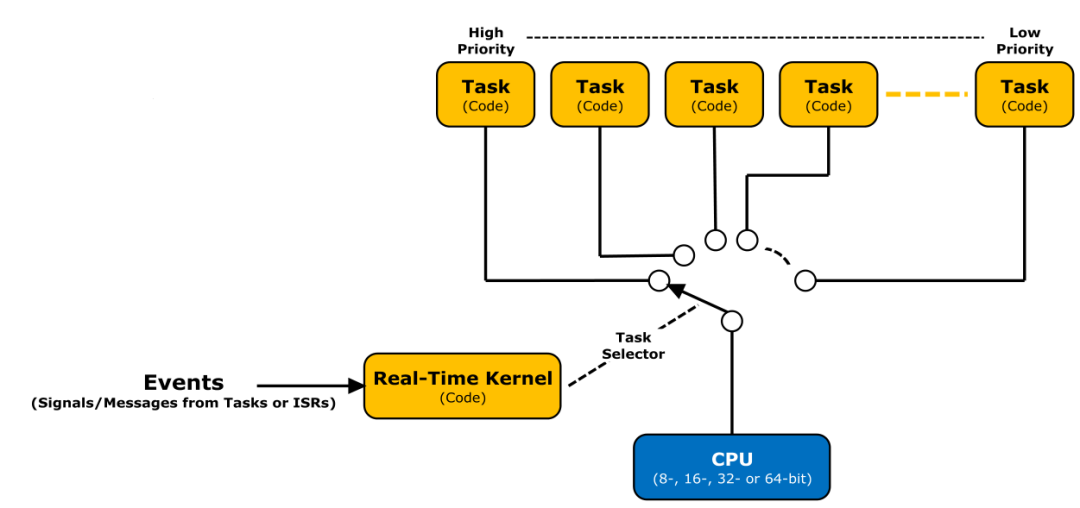
Most commercial RTOS use preemptive scheduling, where the kernel always runs the most important ready task. Preemptive kernels are also event-driven, where tasks are designed to wait for events to occur before executing. If the event a task is waiting for does not occur, the kernel will run other tasks. Tasks in a waiting state do not consume CPU time. Events are triggered and awaited through kernel API calls to avoid polling operations, thus improving CPU time utilization. A typical task implementation example is shown below:

The real-time kernel provides many services, such as multitasking, interrupt management, inter-task communication and synchronization, resource management, time management, and memory partition management. RTOS can be used for simple applications with a small number of tasks, and is essential in applications requiring complex and time-consuming communications, such as TCP/IP, USB (host and/or device), CAN, Bluetooth, Zigbee applications, etc. It is also highly recommended to use RTOS when applications need a file system to store and retrieve data, and when products are equipped with graphical displays (black and white, grayscale, or color).
Hardware Debugging Ports
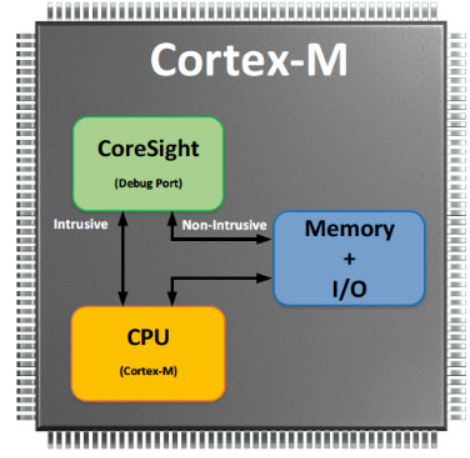
The ARM Cortex-M core is equipped with powerful debugging hardware. CoreSight provides non-intrusive features that allow tools to monitor and control real-time systems without stopping the CPU, such as:
▪ Dynamic memory/peripheral access (read/write)
▪ Instruction tracing (the chip must include an execution trace macro unit, ETM)
▪ Data tracing
The figure below shows a simplified block diagram of the relationship between the CoreSight debug port, CPU, and memory peripherals.
System Testing/Debbugging Tools
The figure below shows how CoreSight connects to the development environment:
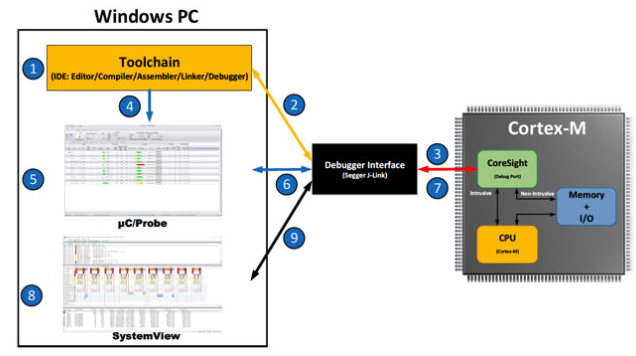
1. Embedded development typically uses an Integrated Development Environment (IDE), which usually includes a code editor, compiler, assembler, linker, debugger, and other tools.
The built-in debugger in the IDE only provides basic functionalities: downloading code, starting/stopping applications, setting breakpoints, etc. Some debuggers allow displaying and changing variables at target runtime (such as Live Watch), but these features are limited to numerical values. Many debuggers have built-in RTOS plugins, but often require stopping the application to check the RTOS state (which is not practical for debugging real-time systems).
2. The debugger, such as Segger J-Link, downloads code to the target system.
3. J-Link connects to the CoreSight debug port to start/stop the CPU, download code, program the onboard Flash, etc. Even when the target system is executing code, J-Link can read and write memory.
4. Micrium’s μC/Probe is a standalone, CPU-independent Windows application that reads ELF files generated by the toolchain. ELF files contain the code downloaded to the target system along with the names, data types, and memory locations of all global variables.
5. μC/Probe allows users to display or change values of variables or memory locations (including I/O ports) on the connected embedded target at runtime. Users simply fill in gauges, digital indicators, tables, charts, virtual LEDs, bars, sliders, switches, buttons, and other controls in the μC/Probe graphical environment and associate the controls with variables or memory locations in the embedded device to display or change variables at runtime. By adding virtual sliders or switches in the μC/Probe graphical interface, users can easily change parameters of the running system (such as filtering coefficients and PID loop gains) or start devices and test I/O ports.
6. μC/Probe sends requests to J-Link to read or write memory.
7. J-Link requests are converted into CoreSight commands to obtain variable values and display them in the μC/Probe graphical interface.
8. Another very useful tool for testing/debugging real-time embedded systems is SEGGER’s SystemView. This tool typically works with RTOS to display the execution of tasks and ISRs in chronological order, allowing users to see how long each task takes to execute (minimum/average/maximum), when tasks are ready, when each task actually starts executing, when ISRs execute, etc. SystemView can help discover hard-to-find errors. However, SystemView requires adding resident code to the target system to log RTOS events and ISRs (provided for free by SEGGER), and it also consumes a small amount of RAM to cache these events.
9. J-Link allows multiple processes to access CoreSight simultaneously, so you can use all three tools at the same time.
Issues in RTOS-Based Applications
Stack Overflow
In applications based on real-time kernels, each task requires its own stack. The size of the stack required by a task depends on the application. If the stack is larger than required by the task, memory is wasted. If the stack is too small, it may overflow. We can reduce the chances of stack overflow by allocating more memory, typically requiring an additional 25-50% of stack space. Some CPUs, such as those based on the ARMv8M architecture, have built-in stack overflow detection mechanisms. However, this feature does not help determine the appropriate stack size; it only prevents the negative consequences of stack overflow.
When allocating stacks, more space should be allocated for the task stack first, then run the application under known worst-case conditions and monitor actual stack usage.
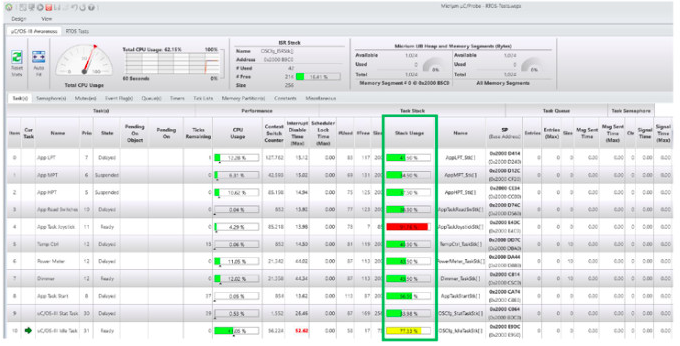
The figure below shows a screenshot of μC/Probe’s kernel-aware view of the test application using the μ/OS-III kernel. The Stack Usage column displays the maximum stack usage for each task at a given time. μC/Probe updates and displays stack usage information in real time without stopping the target application. Green indicates that the maximum stack usage has remained at 70%. Yellow indicates that stack usage is between 70% and 90%. Red indicates that stack usage has exceeded 90%. Clearly, a task using 92% of the stack should increase its stack size to bring it back below 70%.
Interrupt Response
When handling critical code, RTOS and application code often need to disable interrupts. Disabling interrupts affects the system’s response to events, and in RTOS applications, the time interrupts are disabled should be minimized.
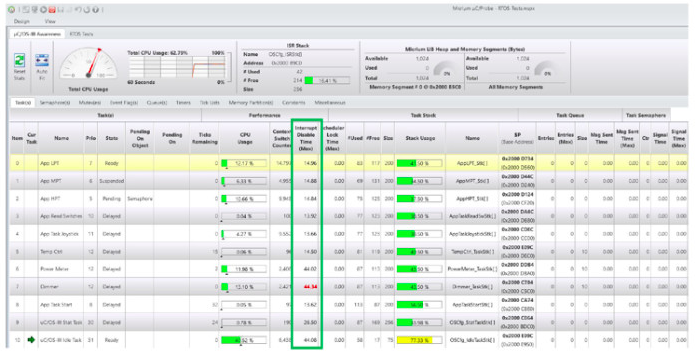
μC/OS-III monitors the worst-case interrupt disable time for each task, as shown in the figure below. This information is very useful if the application needs to meet real-time deadlines.
The duration for which interrupts are disabled largely depends on the CPU, its clock rate, the application, and the RTOS services being called. The longest task with interrupts disabled is highlighted in red, helping users quickly identify potential outliers.
If the maximum interrupt disable time is caused by the RTOS, you can:
🔸 Look for and use RTOS APIs with lower interrupt disable times.
🔸 Increase the CPU’s clock rate.
🔸 Use non-kernel-aware interrupts to handle highly time-sensitive code.
Priority Inversion
Priority inversion occurs when a low-priority task holds a resource needed by a high-priority task. The problem worsens when a medium-priority task preempts the low-priority task that is holding the resource. The term “priority inversion” refers to the situation where a low-priority task appears to have higher priority than a high-priority task, at least when sharing that resource.
Priority inversion is a problem in real-time systems and occurs when using a priority-based preemptive kernel. As shown in the figure below, SystemView illustrates a priority inversion scenario.
App HPT has the highest priority, App MPT has medium priority, and App LPT has the lowest priority.

The priority inversion issue described above can be resolved using the mutex mechanism of the RTOS. Priority inversion is limited to the time required by LPT to access shared resources, as shown in the figure below. Both LPT and HPT use a mutex instead of a semaphore to gain access to the shared resource. Without tools like SystemView, it would be difficult to identify and correct priority inversion.

Note that if LPT is only the next priority level below HPT, a semaphore can be used. In this case, the RTOS does not need to change LPT’s priority, and the semaphore is preferred because it is faster than a mutex.
Deadlock
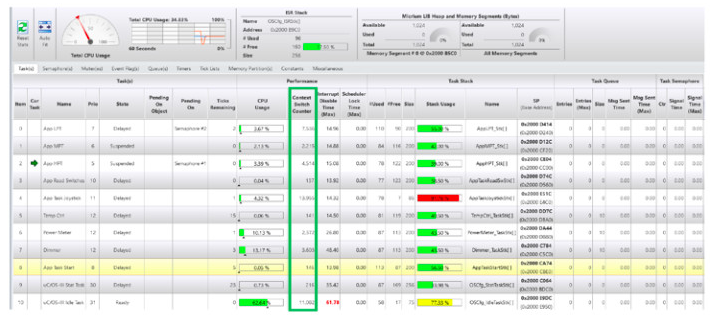
Deadlock occurs when at least two tasks are waiting for resources owned by each other. Deadlock may not occur immediately and largely depends on when the two tasks require each other’s resources. As shown in Figure 8, the kernel-aware view of μC/Probe has a column showing the execution frequency of each task (the frequency at which the RTOS switches tasks). By monitoring this column, deadlock can be detected. If the count for at least two tasks has stopped (μC/Probe updates these counters while the CPU is running), a deadlock may exist. For this situation, it is also possible to determine locking behavior without using tools like μC/Probe, but that tool makes it more apparent.
Deadlock can be avoided by:
1. Tasks should acquire all necessary resources in the same order and release them in the reverse order.
2. Use timeout mechanisms in RTOS API calls to avoid waiting indefinitely for resources to become available. Check the error codes returned by RTOS APIs to ensure successful requests for the required resources.
Task Starvation
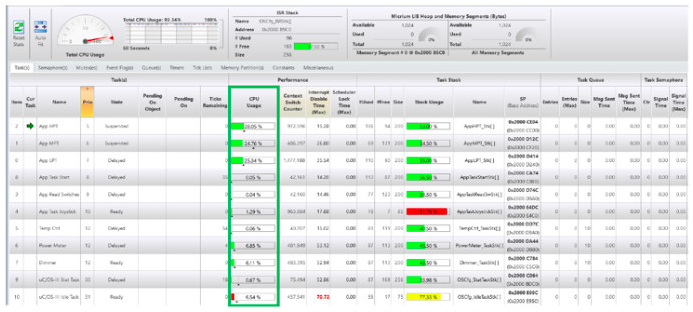
Starvation refers to high-priority tasks consuming all CPU bandwidth, leaving low-priority tasks with no or very little CPU time. The effects of starvation include decreased responsiveness and product characteristics, such as slow display updates on embedded targets, packet loss in communication stacks, and sluggish responses in user interfaces. To address starvation, one can:
1. Optimize code that consumes most of the CPU bandwidth.
2. Increase the CPU’s clock speed.
Summary
The built-in debuggers in IDEs are often insufficient for debugging RTOS-based real-time systems.
Fortunately, there are tools specifically designed for debugging RTOS-based systems. One such tool is Segger’s SystemView, which displays the execution of ISRs and tasks in chronological order, collecting runtime statistics such as minimum and maximum execution times, relationships between ISRs and tasks, CPU load, etc.
Another tool that can complement SystemView is Micrium’s μC/Probe, which is a general-purpose tool that allows developers to visualize and change the behavior of running embedded targets without interfering with the CPU. μC/Probe can be used in bare-metal or RTOS-based applications. For RTOS-based applications, μC/Probe includes non-intrusive, real-time kernel awareness and TCP/IP stack awareness features. SystemView and μC/Probe can be used throughout the development cycle, providing feedback on the runtime behavior of embedded targets.
Reply in the background with ‘RTOS’ or ‘Operating System’ to read more related articles.

Click ‘Read Original’ for more shares, and feel free to share, save, like, and view.