
Why Is Outputting Debug Information Important in Embedded Development?
Outputting debug information is a crucial practice in embedded development; it helps ensure software reliability, stability, and performance, and is one of the key tools for troubleshooting.
The Main Functions of Outputting Debug Information in Embedded Development Are as Follows:
1. Error Troubleshooting and Problem Localization
Outputting debug information can help you discover and localize errors in your code. When a program exhibits abnormal behavior or crashes, reviewing the output debug information can make it easier to identify the root cause of the problem, such as memory leaks or out-of-bounds access. By examining exceptional conditions, variable values, function call stacks, and other information, you can quickly locate and resolve issues.
2. Real-time Feedback
As you gradually add new features or modify existing ones during development, outputting debug information can provide real-time feedback. This allows for quick checks on the effects of changes.
3. Code Verification and Logic Analysis
Outputting debug information can be used to verify whether the code works as expected. You can insert print statements in critical code segments to monitor variable values and program flow, ensuring the logical correctness of the code. This helps identify potential problems early, reducing the workload for later debugging.
4. Hardware Connection Verification
By outputting communication information with external devices or modules, you can verify whether the hardware connections are correct and whether communication with external devices is functioning properly.
5. Status Monitoring
Outputting debug information allows for real-time monitoring of system status. This is particularly useful for embedded systems, where you can track sensor data, device status, communication status, etc., and take appropriate actions when necessary.
6. Performance Analysis
Outputting debug information can help you assess program performance. You can measure program execution time, check whether code paths are efficient, and examine any unnecessary delays.

What Are the Common Methods for Outputting Debug Information in Embedded Development?
1. Outputting Logs via Serial Port
This is a common debugging method. You can configure a UART (serial communication) module on an STM32 microcontroller to send debug information to a computer or other device, and then check the output log information in the corresponding terminal software (such as serial debugging tools).
2. Outputting Log Information to SRAM
This method is typically used to save debug information in the chip’s internal memory, such as SRAM (Static Random Access Memory), when there is no external debugging interface (like a serial port). You can use a function similar to sprintf to format the debug information and write it to SRAM, and then read the information from SRAM for analysis via other means (e.g., JTAG/SWD interface).
3. Outputting Logs via SWO
Serial Wire Output (SWO) is a hardware interface used for debugging output. This method is more flexible than serial port output but requires corresponding hardware and debugging tool support. You can configure SWO output in a debugger/programmer (such as ST-Link), then connect with debugging tools to view log information. SWO can output debug information at high speed without affecting CPU execution speed.

How to Output Logs via Serial Port?
To output log information via the serial port, you need to configure the STM32’s serial module and use corresponding library functions or drivers to send data. The specific steps are as follows:
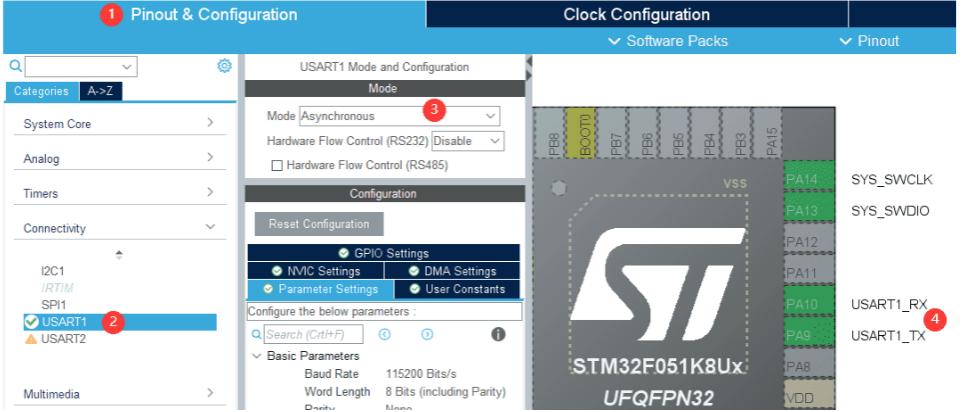
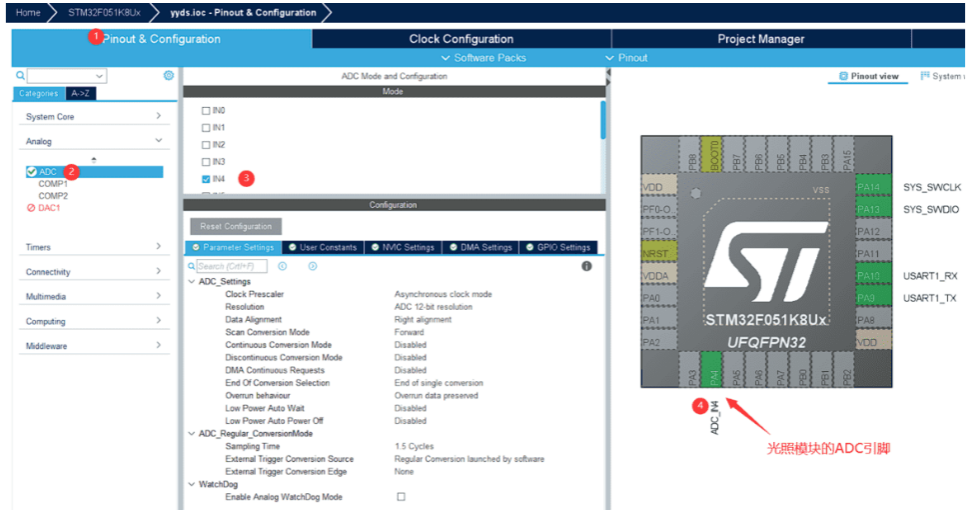
1. CubeMX Configuration
1) Enable Debug Serial Wire
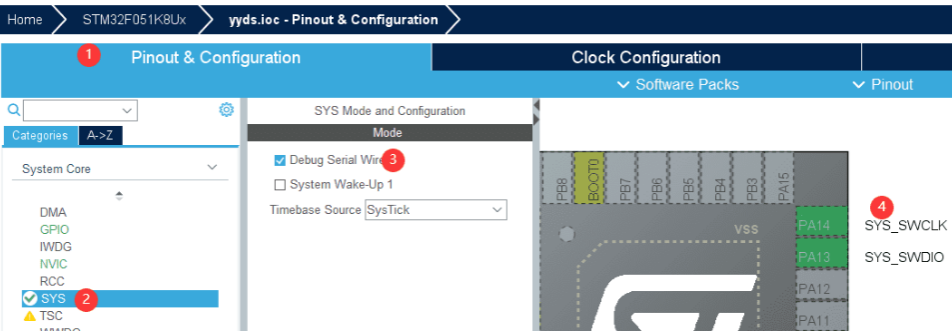
2) Enable USART1 Serial Port
3) Enable ADC’s ADC_IN4 (PA4 pin as the analog input pin for the light module, used to generate data).
2. Writing the Program
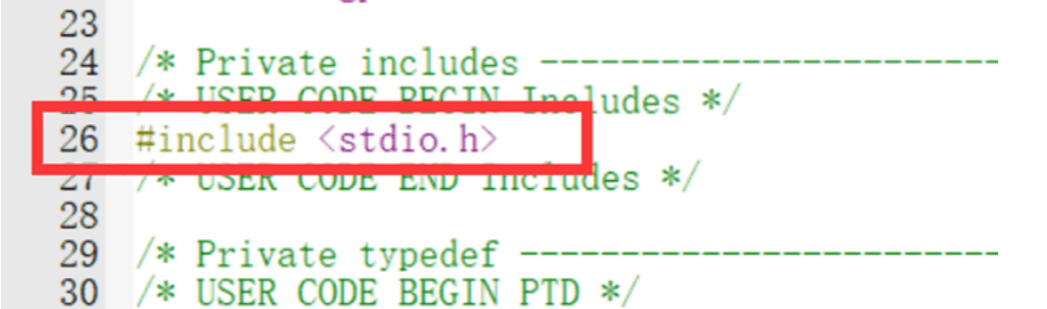
In the code, you can use a function similar to printf in the C standard library to format and output log information. Since you need to use printf, you should include the stdio.h header file and redirect the output.
1) Add Header File
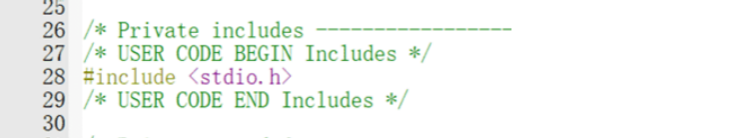
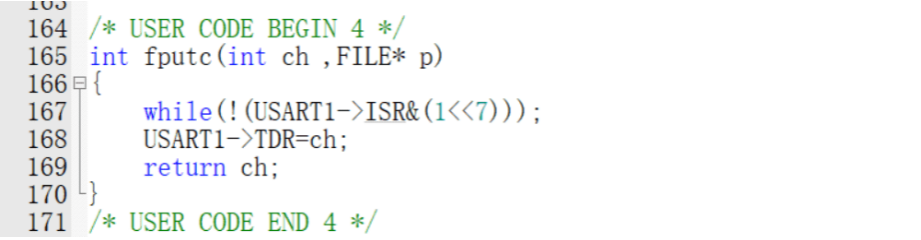
2) Redirect Standard Output (Note: Redirection varies for each MCU; configure the redirection according to your chip, redirecting standard output to the USART’s data register based on your MCU’s manual).
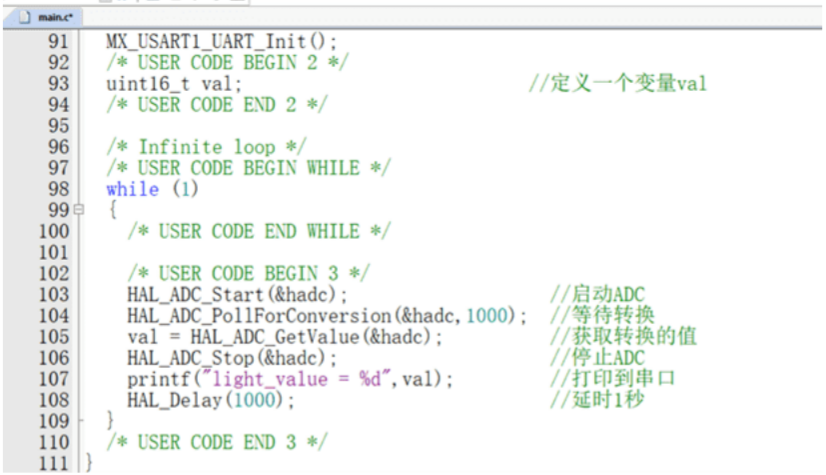
3) Write Code to define a variable to receive the ADC conversion value, and then print it to the serial port for debugging output.
3. Terminal Debug Output
1) Download and Run the Code
Burn the code onto the STM32 chip using the IDE, and then run it.
2) Connect the Serial Cable
Ensure that the serial cable is connected to the corresponding serial pins on the STM32 development board (e.g., PA9, PA10) and the other end to the serial port of a computer or other device (or through a serial-to-USB module to connect to the computer’s USB port).
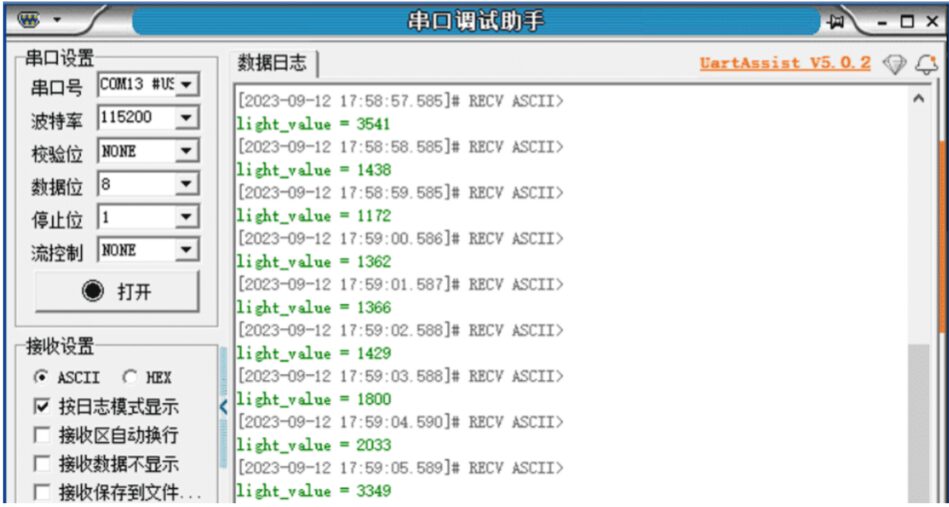
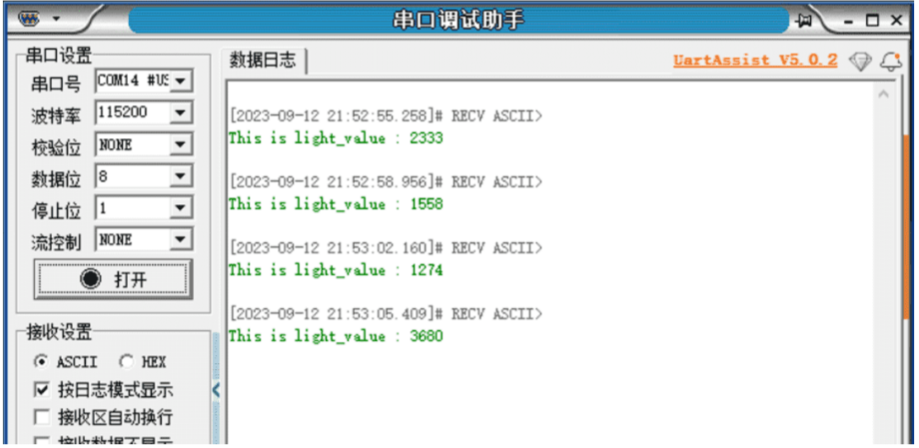
3) Use Serial Debug Assistant to Output Information

How to Output Log Information to SRAM?
To output debug information to the SRAM (Static Random Access Memory) of STM32, you can use a function similar to sprintf to write formatted strings into SRAM. The specific steps are as follows:
1. Initialize SRAM
In your project, ensure that you have correctly initialized SRAM. Typically, SRAM is mapped to a specific address space, and you can access it using the corresponding address. (Since chips vary, please refer to the manual or search online.)
2. Use sprintf Function
In your code, you can use a function similar to sprintf in the C standard library to write formatted strings into a buffer. For example:
1) First, define a buffer
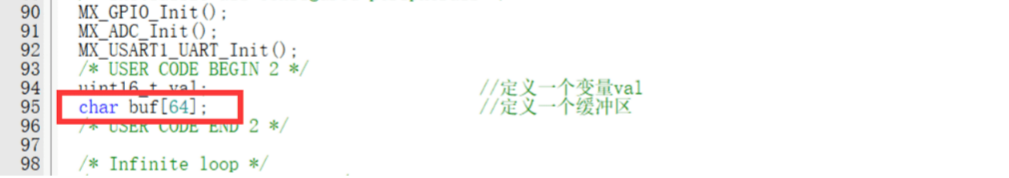
2) Then write the formatted string into the buffer

3. Write the String to SRAM
Using the SRAM address, write the contents of the buffer to SRAM. You can use pointers or functions like memcpy to achieve this. (Note to include the header file #include<string.h>.) The code is as follows:
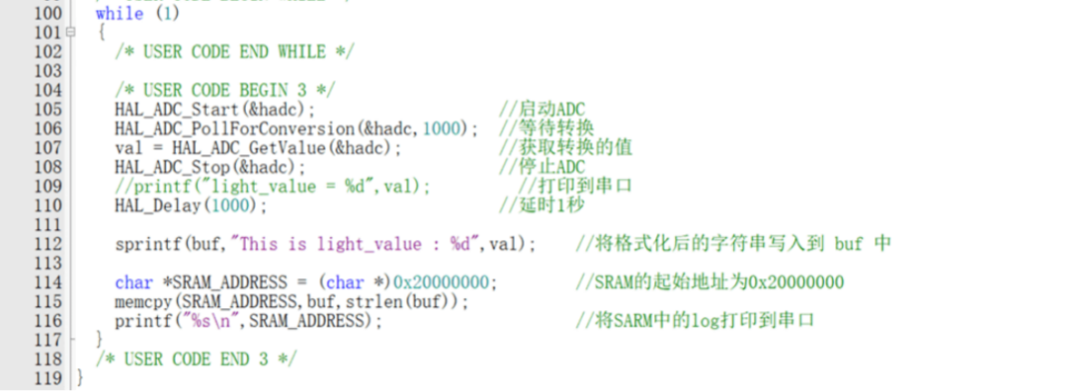
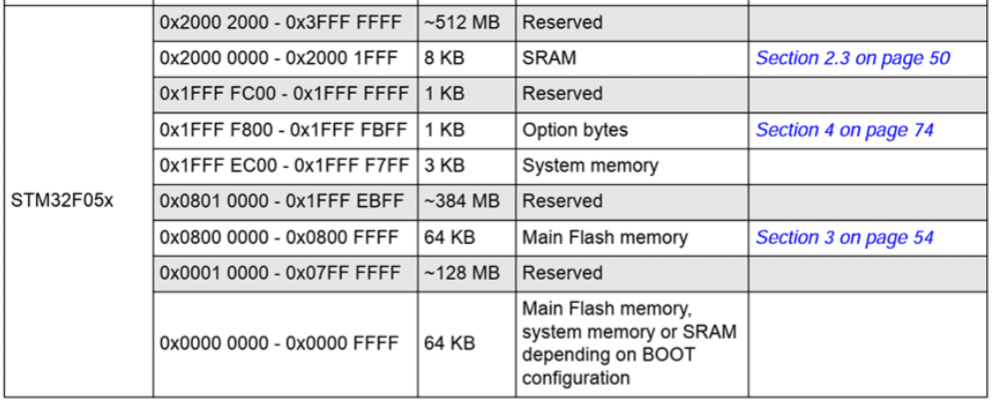
Note: The specific address and size of SRAM depend on your STM32 model and hardware configuration, and adjustments should be made accordingly (you can find this in Keil IDE by clicking Books). For STM32F051, the starting address of SRAM is 0x20000000.
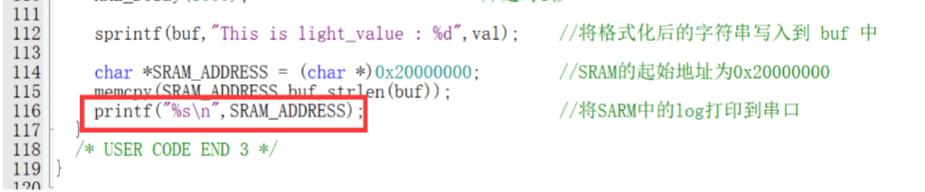
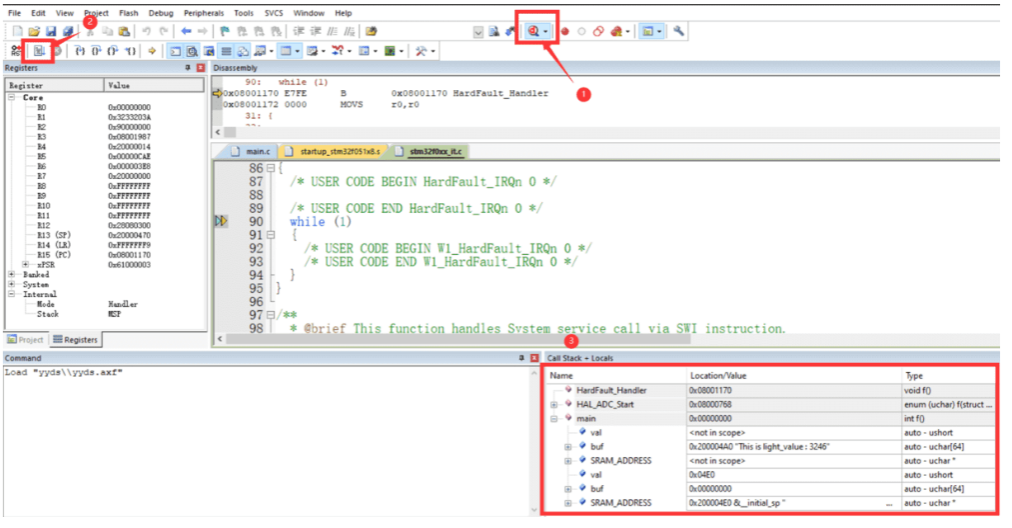
4. Read Information from SRAM
When you need to view log information, you can read the information from the SRAM address and output it to the serial port or other output devices. (Here, we directly output to the serial port.)
Of course, you can also view it in the IDE using Debug.
This method’s advantage is that even if your STM32 chip lacks external debugging interfaces (like a serial port), you can still save and view debug information on the device. However, note that SRAM is volatile memory, and information will be lost after power off, so it is only suitable for temporary debugging purposes.

How to Output Log via SWO?
1. Warm Tips
Terminology Explanation:
SWD:Serial Wire Debug
SWO:Serial Wire Output
SWV:Serial Wire Viewer
ITM:Instrumentation Trace Macrocell
2. About SWO and ITM
SWO serial wire output is a single-pin, asynchronous serial communication that can be used on Cortex-M3/M4/M7 and is detected by the main debugger. The connection pin is as follows:
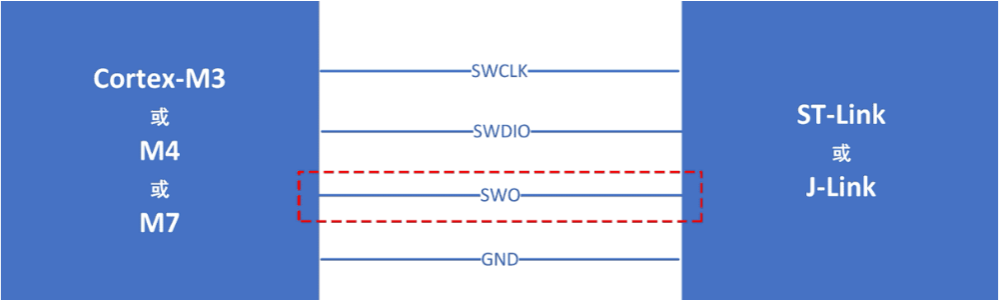
SWO output requires a SWO (pin) line and the use of SWV (viewer) to view data.
One of ITM’s main purposes is to support the output of debugging messages (such as printf-style output). ITM includes 32 stimulus ports, allowing different software to output data to different ports, enabling the debugging host to separate their messages. Unlike UART-based text output, using ITM output does not significantly delay the application, as there is a FIFO in ITM that buffers written output messages.
3. SWO Pin Configuration
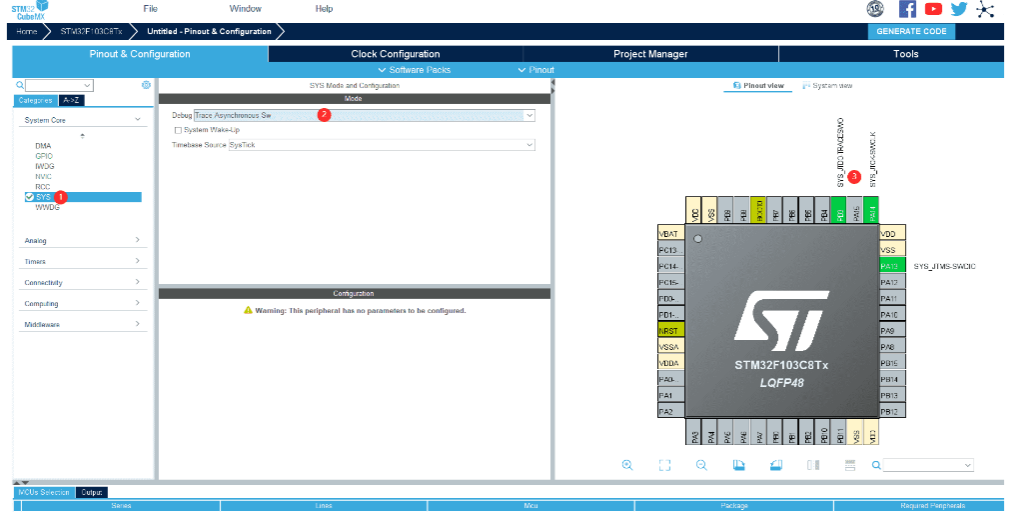
The SWO pin can be understood as the Tx pin of UART; if this pin is not connected, the SWV terminal will not receive printed information. For STM32, any MCU with a Cortex-M3/M4/M7 core has a SWO pin. However, Cortex-M0 does not have this feature, including STM32F0, STM32L0, and STM32G0. In STM32CubeMX, configure the Debug option as follows.
(Note: The most commonly used chip STM32F103C8T6 is used here)
4. ITM Sending Source Code
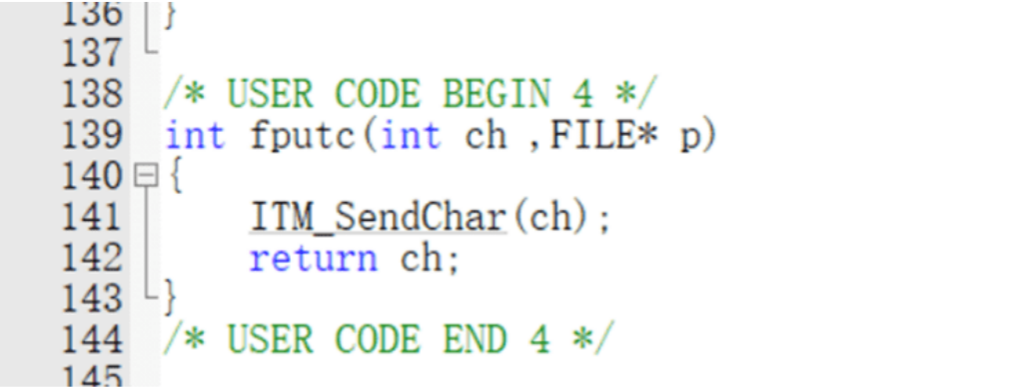
This method differs from the previous UART implementation of printf output in that it changes the code to send characters via ITM instead of UART.
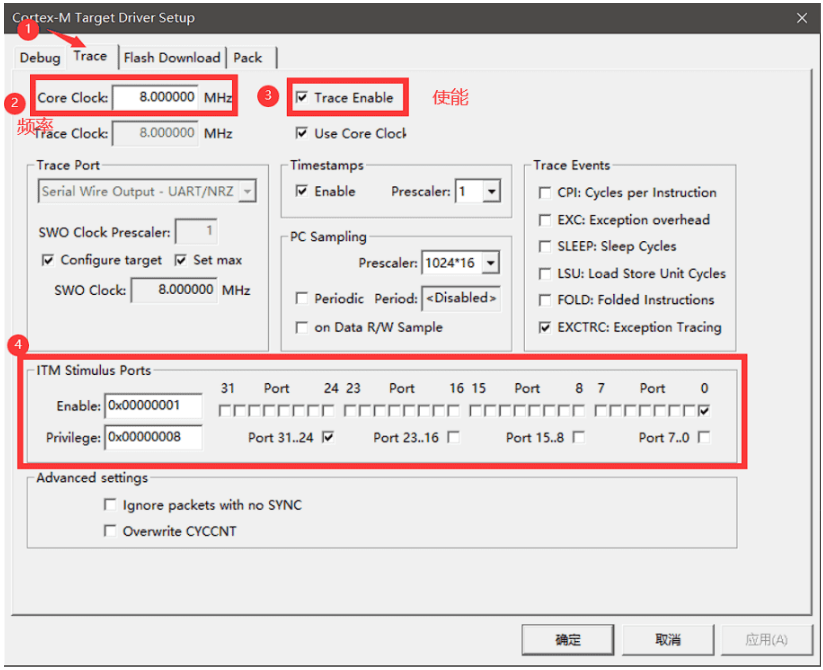
5. Keil SWO Output Configuration
Click the magic wand -> Click Debug -> Click Settings
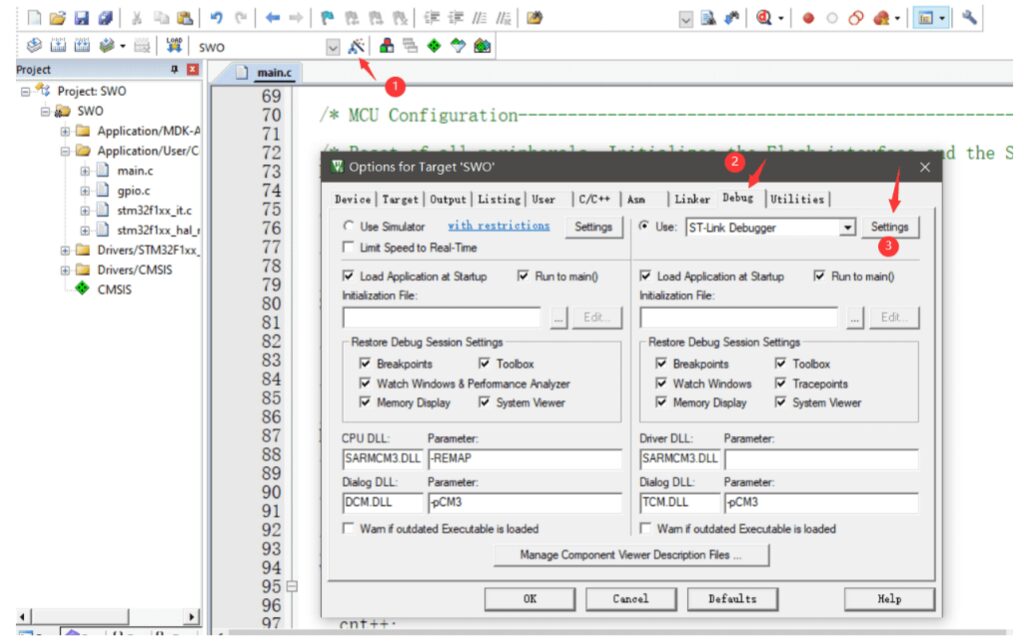
Note: Set Clock and ITM Stimulus Ports according to your situation.
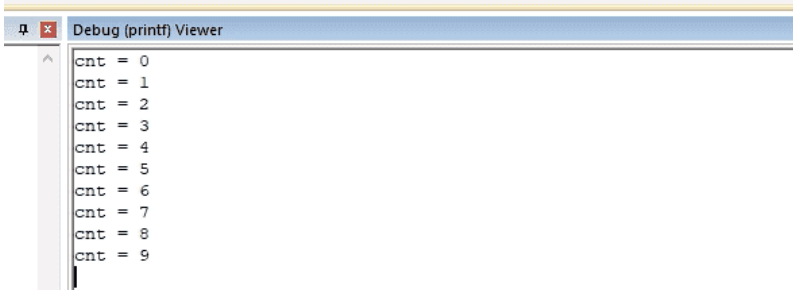
6. Debug Output
Here, the Debug (printf) Viewer is used to output debug information; of course, there are other methods (such as Terminal IO based on IAR, Serial Wire Viewer based on ST-LINK Utility, SWO Viewer based on J-Link).
Simply click Debug and follow the steps below:
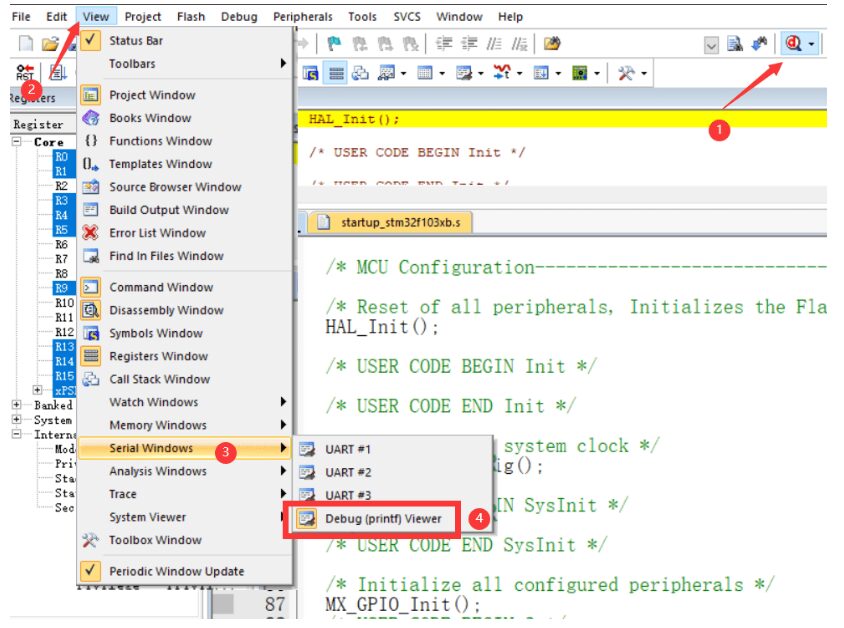
Click Run to see the results of the debug output.

Summary of Advantages and Disadvantages
1. Outputting Logs via Serial Port
Advantages:
1) Easy to Implement: Serial communication is a relatively simple communication method suitable for most STM32 microcontrollers.
2) Real-time: Information can be output in real-time, facilitating real-time monitoring of device status.
3) Stability: Reliable and stable, usually not prone to interference or errors.
Disadvantages:
1) Consumes Hardware Resources: Requires a UART module, and if multiple UART modules need to be used simultaneously, resource allocation may become an issue.
2) Physical Connection: Requires connecting physical serial cables, which can sometimes require complicated wiring.
3) Wired Connection: Usually requires connection to a computer or other device, not suitable for remote debugging.
2. Outputting Log Information to SRAM
Advantages:
1) Suitable for No External Interface: When the device lacks external debugging interfaces, this is an effective debugging method.
2) Low Cost: No additional hardware is needed, just a usable SRAM.
Disadvantages:
1) Temporary: SRAM is volatile memory; information will be lost after power off, suitable only for temporary debugging purposes.
2) Requires Additional Code: Requires writing code to write information to SRAM, increasing development workload.
3) Not Suitable for Remote Debugging: Cannot transmit information to remote locations, suitable only for local debugging.
3. Outputting Logs via SWO
Advantages:
1) Flexibility: SWO interface provides a flexible debugging method suitable for real-time debugging and performance analysis.
2) No Additional Hardware Needed: Only requires a supporting SWO debugger/programmer, no extra hardware devices needed.
3) Suitable for Remote Debugging: Can perform remote debugging through SWD interface.
Disadvantages:
1) Relatively Complex: Compared to serial output, configuring and using SWO output may require more setup and debugging work.
2) Requires Hardware that Supports SWO: Not all STM32 development boards and debuggers support SWO functionality.
Note: Each method has its applicable scenarios, and you should choose the appropriate method for outputting debugging information based on specific project requirements, hardware resources, and debugging environment. Sometimes, various methods can be combined based on actual conditions to obtain more comprehensive debugging information.
At this point, everyone should have a certain understanding of the methods for outputting debug information in embedded development. Returning to embedded systems themselves, various aspects need to be considered, such as the advancement of embedded technology and employment situations in embedded systems. To give everyone a deeper understanding of embedded systems, Huamei has prepared a live broadcast on “Embedded Employment Situation”, which will officially start on November 23 at 19:00~
Click the video number below to make a reservation directly
👇👇👇

Free Project Data Package
👇👇👇👇👇
Free Project Data Package Graduation projects, project practice, and skill improvement are all prepared for you~ Note: You must add WeChat with the remark “Smart Security Data Package” to successfully receive the data~

Multiple Project Data Packages Continuously Updated……
Huamei has prepared a surprise for everyone!
👇👇👇👇👇
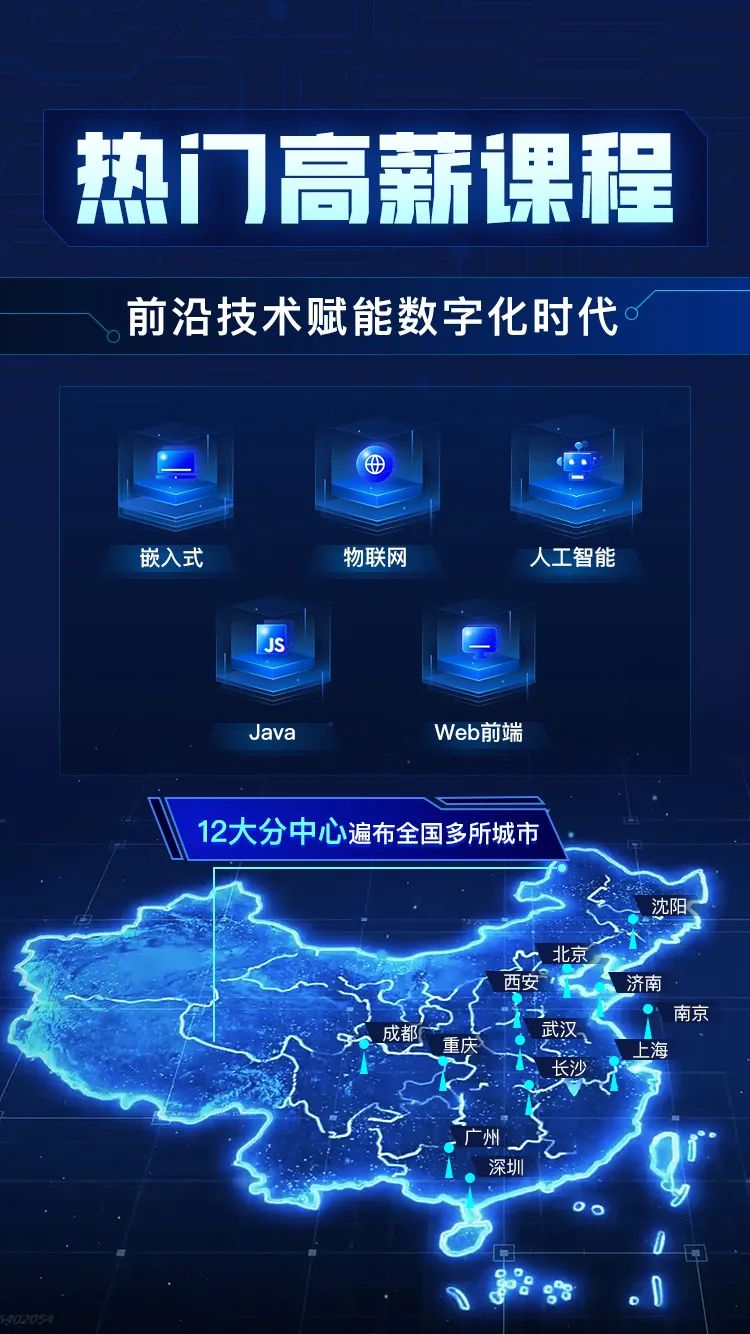
🔥Hot Enrollment🔥 Artificial Intelligence High-End Talent Practical Course Enrollment is Open

Huamei has prepared high-salary employment courses for everyone in Embedded Systems, IoT, Artificial Intelligence, Java Development, Web Frontend
And specially prepared course benefits for everyone
👇👇👇

If you have any questions, feel free to leave a message for Huamei Huamei is waiting for you~