Introduction
This article will demonstrate how to measure and visualize the real-time performance of VxWorks, explain why these measurements are important, and guide you in reproducing these tests. You will gain:
- • A brief explanation of why real-time performance is critical.
- • A reproducible test toolkit (VxWorks C language test program) to measure:
- • Interrupt latency
- • Context switch time
- • Timer precision
- • A Python plotting script that converts console logs into histograms and time series plots.
- • Step-by-step instructions for running similar tests on Linux (with/without PREEMPT-RT) and FreeRTOS.
- • Example/representative results and charts that can be used for publication in your experiments.
Why Real-Time Performance is Critical
- • In hard real-time systems, missing deadlines can lead to system failure. Key metrics include:
- • Interrupt latency — the time from when an event occurs to when the interrupt service routine (ISR) begins execution.
- • Context switch time — the time required to switch execution between tasks.
- • Timer precision — the accuracy of periodic tasks.
- • A true RTOS (like VxWorks) provides deterministic behavior with low jitter, which is crucial for avionics, industrial control, robotics, and other safety-critical areas.
Recommended Test Hardware and Software
- • Hardware target: modern embedded CPU or x86 target (e.g., Intel Core i7 development board).
- • VxWorks: VxWorks 7 (supports timestamp/timer API).
- • Host tools: Wind River Workbench (build and console), Python 3 and matplotlib on the host PC.
- • Optional: logic analyzer/oscilloscope for hardware-level precise interrupt timing.
VxWorks Real-Time Performance Test Toolkit
- 1. VxWorks C language test program (save as performanceTest.c)
This program demonstrates interrupt latency, semaphore-based context switch testing, and periodic timer callbacks for measuring timer precision.
/* performanceTest.c
   Compile and link in the VxWorks build system. Adjust interrupt vectors and
   timestamp API as needed for your BSP.
*/
#include <vxWorks.h>
#include <taskLib.h>
#include <semLib.h>
#include <intLib.h>
#include <sysLib.h>
#include <tickLib.h>
#include <timers.h>
#include <stdio.h>
#include <time.h>
#include <drv/timer/timestampDev.h>

SEM_ID sem1, sem2;
volatile UINT64 irqStartTime, irqEndTime;
volatile BOOL irqTriggered = FALSE;

/* ISR for latency measurement */
void latencyISR(void)
{
    irqEndTime = vxTimestamp();
    irqTriggered = TRUE;
}

/* Interrupt latency test */
void testInterruptLatency(void)
{
    UINT32 freq = sysTimestampFreq();
    irqTriggered = FALSE;

    /* Replace 0x60 with the vector suitable for your BSP, or use
       a hardware timer to trigger an external interrupt.*/
    intConnect(INUM_TO_IVEC(0x60), (VOIDFUNCPTR)latencyISR, 0);
    intEnable(0x60);

    irqStartTime = vxTimestamp();
    /* Trigger interrupt in BSP specific way; sysIntGen is just an example */
    sysIntGen(0x60);

    while (!irqTriggered) taskDelay(1);

    double latency_us = ((double)(irqEndTime - irqStartTime) / freq) * 1e6;
    printf("Interrupt Latency: %.2f microseconds\n", latency_us);
}

/* Context switch task */
void highPriorityTask(void)
{
    while (1)
    {
        semTake(sem1, WAIT_FOREVER);
        UINT64 t1 = vxTimestamp();
        semGive(sem2);
        double switchTime = ((double)(vxTimestamp() - t1) / sysTimestampFreq()) * 1e6;
        printf("Context Switch Time: %.2f microseconds\n", switchTime);
    }
}

void lowPriorityTask(void)
{
    while (1)
    {
        semGive(sem1);
        semTake(sem2, WAIT_FOREVER);
    }
}

/* Timer callback for measuring period */
void timerCallback(timer_t timerId, int arg)
{
    static UINT64 lastTime = 0;
    UINT64 now = vxTimestamp();
    if (lastTime != 0)
    {
        double period_us = ((double)(now - lastTime) / sysTimestampFreq()) * 1e6;
        printf("Timer Period: %.2f microseconds\n", period_us);
    }
    lastTime = now;
}

void testTimerPrecision(void)
{
    struct sigevent evp;
    timer_t tid;
    struct itimerspec ts;

    evp.sigev_notify = SIGEV_THREAD;
    evp.sigev_value.sival_int = 0;
    evp.sigev_notify_function = (void (*)(union sigval))timerCallback;
    evp.sigev_notify_attributes = NULL;

    timer_create(CLOCK_REALTIME, &evp, &tid);

    ts.it_value.tv_sec = 0;
    ts.it_value.tv_nsec = 1000000;  // 1 millisecond
    ts.it_interval = ts.it_value;

    timer_settime(tid, 0, &ts, NULL);
}

/* Entry: run tests */
void vxworksPerformanceTest(void)
{
    if (vxTimestampEnable() != OK)
    {
        printf("This platform does not support timestamps\n");
        return;
    }

    printf("VxWorks Real-Time Performance Test\n");

    /* 1) Interrupt latency (single shot)*/
    testInterruptLatency();

    /* 2) Context switch test */
    sem1 = semBCreate(SEM_Q_PRIORITY, SEM_EMPTY);
    sem2 = semBCreate(SEM_Q_PRIORITY, SEM_EMPTY);
    taskSpawn("tHigh", 100, 0, 4096, (FUNCPTR)highPriorityTask, 0,0,0,0,0,0,0,0,0,0);
    taskSpawn("tLow",  101, 0, 4096, (FUNCPTR)lowPriorityTask,  0,0,0,0,0,0,0,0,0,0);

    /* 3) Timer precision: periodic print */
    testTimerPrecision();
}- 2. Python plotting script (plot_vxworks_performance.py)
Copy the VxWorks console output to vxworks_performance.log. Then run this script on your host to generate histograms and timer precision plots.
import re
import matplotlib.pyplot as plt

LOG_FILE = "vxworks_performance.log"

interrupt_latencies = []
context_switch_times = []
timer_periods = []

re_interrupt = re.compile(r"Interrupt Latency:\s*([\d.]+)\s*microseconds")
re_context   = re.compile(r"Context Switch Time:\s*([\d.]+)\s*microseconds")
re_timer     = re.compile(r"Timer Period:\s*([\d.]+)\s*microseconds")

with open(LOG_FILE, "r") as f:
    for line in f:
        if m := re_interrupt.search(line):
            interrupt_latencies.append(float(m.group(1)))
        elif m := re_context.search(line):
            context_switch_times.append(float(m.group(1)))
        elif m := re_timer.search(line):
            timer_periods.append(float(m.group(1)))

plt.figure(figsize=(8, 5))
plt.hist(interrupt_latencies, bins=20)
plt.title("Interrupt Latency Distribution")
plt.xlabel("Latency (microseconds)")
plt.ylabel("Frequency")
plt.grid(True, linestyle="--", alpha=0.6)
plt.savefig("interrupt_latency_histogram.png", dpi=300)
plt.close()

plt.figure(figsize=(8, 5))
plt.hist(context_switch_times, bins=20)
plt.title("Context Switch Time Distribution")
plt.xlabel("Time (microseconds)")
plt.ylabel("Frequency")
plt.grid(True, linestyle="--", alpha=0.6)
plt.savefig("context_switch_histogram.png", dpi=300)
plt.close()

plt.figure(figsize=(8, 5))
plt.plot(timer_periods, marker='o', markersize=3, linewidth=1)
plt.title("Timer Period Precision (Target 1 millisecond)")
plt.xlabel("Sample Number")
plt.ylabel("Period (microseconds)")
plt.grid(True, linestyle="--", alpha=0.6)
plt.savefig("timer_period_plot.png", dpi=300)
plt.close()

print("Plots saved.")
Comparison with Linux and FreeRTOS
Linux (without RT patch)
Install <span>rt-tests</span> and use <span>cyclictest</span>:
sudo apt install rt-tests
sudo cyclictest -t1 -p99 -n -i1000 -l10000- • Peaks are expected occasionally (50–200 microseconds or more under heavy load).
Linux (PREEMPT-RT)
Boot the <span>PREEMPT-RT</span> kernel and run <span>cyclictest</span> again.
- • Typical improvement: 10–20 microseconds range, but jitter is still higher than hard real-time operating systems.
FreeRTOS
On bare-metal MCU, re-implement semaphore/ISR tests:
- • Use hardware microsecond timer.
- • Use
<span>xSemaphoreTake/xSemaphoreGive</span>for context switch timing. - • Typical FreeRTOS data varies with MCU clock — usually in the microsecond range, but more unstable under load.
Representative Results
These are representative/sample data used in the example figures and tables, intended to help readers compare different systems. Actual data largely depends on hardware, BSP, and system load.
| Operating System | Average Interrupt Latency | Maximum Jitter | Average Context Switch Time |
|---|---|---|---|
| VxWorks | 1.3 µs | ±0.1 µs | 3.8 µs |
| FreeRTOS | 2–5 µs | ±1 µs | 4–8 µs |
| Linux (no RT) | 50–200 µs | ±100 µs | 5–20 µs |
| Linux RT | 10–20 µs | ±5 µs | 5–10 µs |
Visualization
I generated two plots for comparison based on representative/simulated datasets:
- • Interrupt Latency Histogram
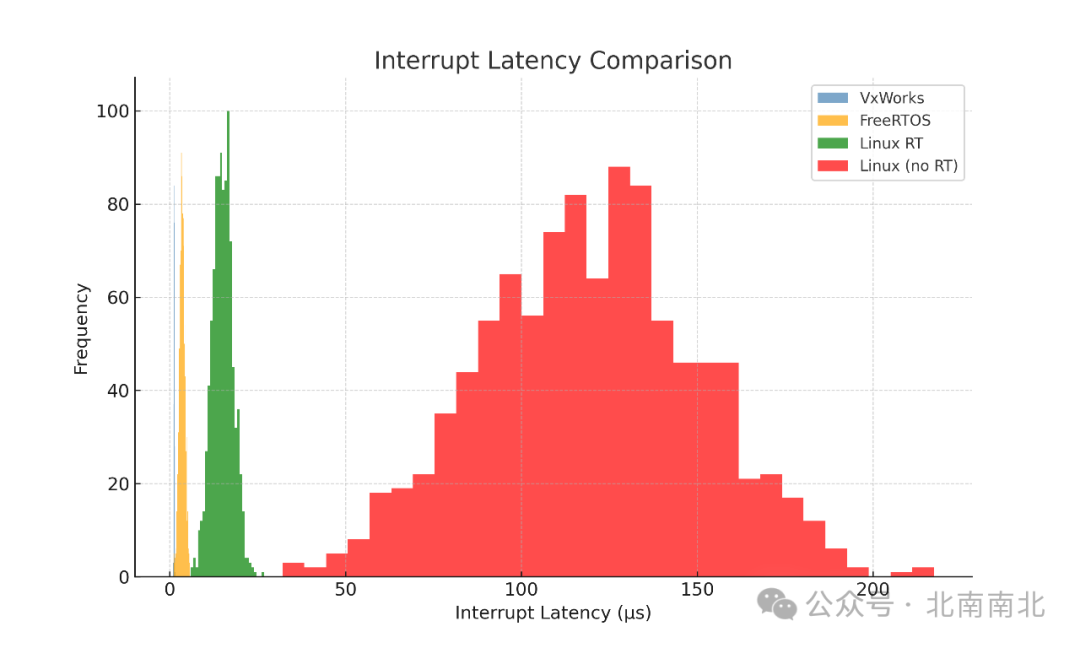
Interrupt Latency Histogram - • Latency and Jitter Boxplot
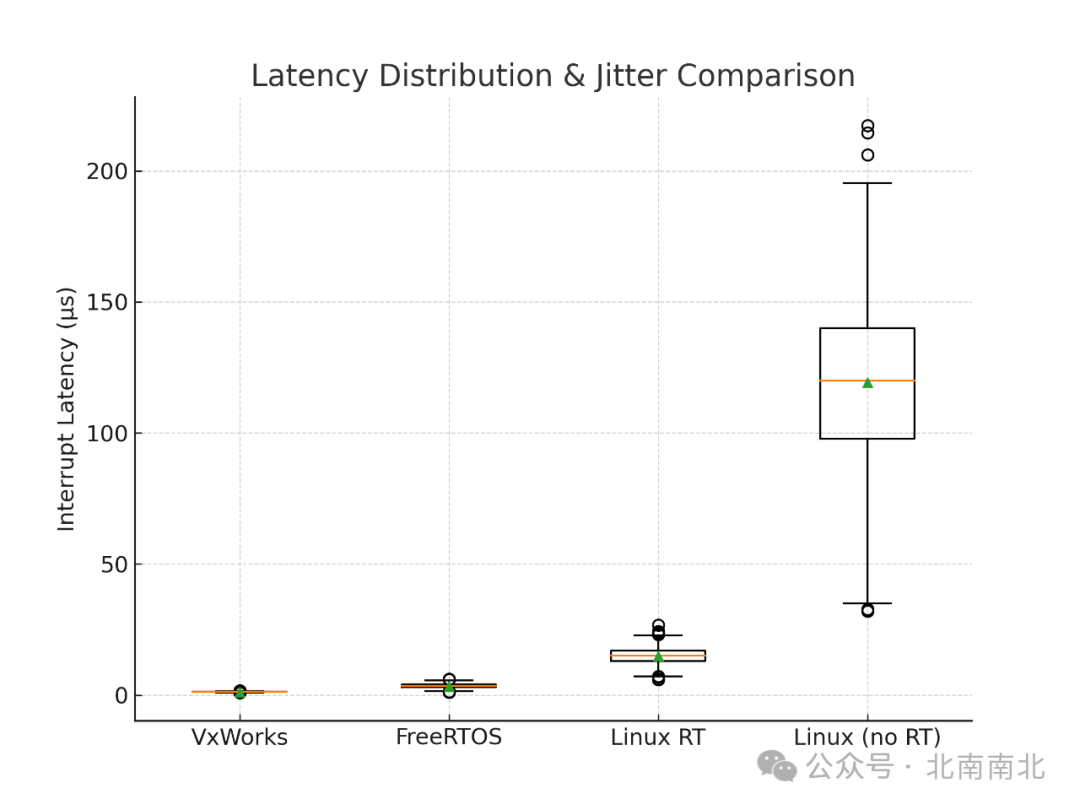
Latency & Jitter Boxplot
If you want a dataset that accurately reflects your hardware, run the VxWorks tests, save vxworks_performance.log, and then rerun the above Python plotting script.
Tips and Best Practices for Reproducible Results
- • Run tests on an idle system to obtain baseline data; then repeat tests under controlled load to demonstrate robustness.
- • Use hardware triggers + logic analyzers for the most accurate interrupt timing.
- • Ensure timestamps use high-resolution hardware timers (vxTimestamp() on VxWorks).
- • Record the exact BSP, CPU model, kernel/firmware version, and compilation flags — these details are important.
Conclusion
This combined toolkit (VxWorks C language tests + Python plotter + comparison guide) provides you with everything needed to measure and publish credible real-time performance results. The generated charts can easily showcase VxWorks’ comparison in latency and jitter against Linux and FreeRTOS.
Click “Read Original” for more VxWorks articles