1. Basic Information of the Article
Publication Date: October 19, 2016
First Institution: College of Agronomy and Biotechnology, Southwest University, Chongqing 400716, China
Corresponding Authors: Jia-Na Li ([email protected]) and Zhe Liang ([email protected])
Published Title: Genome-Wide Analysis, Classification, Evolution, and Expression Analysis of the Cytochrome P450 93 Family in Land Plants
Published Journal: PLOS ONE
 2. Abstract
The Cytochrome P450 93 family (CYP93) belongs to the cytochrome P450 superfamily and plays important roles in various plant processes. However, no previous studies have explored the evolution and expression of this family of members. In this study, we conducted a comprehensive genome-wide analysis to identify CYP93 genes in 60 species of green plants. A total of 214 CYP93 proteins were identified, which are specifically present in flowering plants and can be classified into ten subfamilies—CYP93A–K, with the last two being identified for the first time. CYP93A is derived from an ancestor in flowering plants, while the others show lineage-specific distribution—CYP93B and CYP93C are found in dicotyledons; CYP93F is only distributed in Poaceae; CYP93G and CYP93J are unique to monocots; CYP93E is specific to Fabaceae; CYP93H and CYP93K are found only in Aquilegia coerulea, while CYP93D is specific to Brassicaceae. Each subfamily typically has conserved gene numbers, structures, and features, indicating functional conservation during evolution. Synonymous nucleotide substitution (dN/dS) analysis shows that CYP93 genes are under strong negative selection. Comparative expression analysis of CYP93 genes in dicotyledons and monocotyledons indicates that they are preferentially expressed in roots and tend to be induced by biotic and/or abiotic stress, consistent with their known functions in plant secondary metabolism.

3. Results
Figure 1
Content of the paragraph:
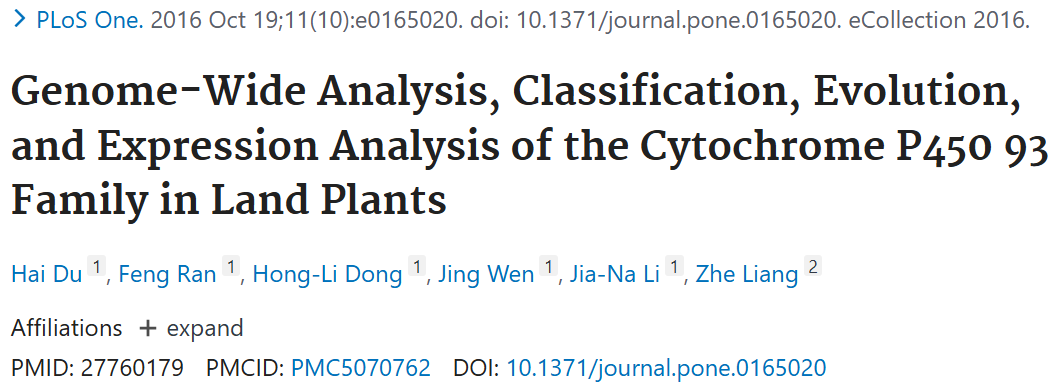
Figure 1 shows the phylogenetic relationships of the 60 plant species investigated in this study. The phylogenetic relationships of these species (branch lengths are arbitrary) have been previously described (http://www.phytozome.net/). The total number of cytochrome P450 93 (CYP93) proteins identified in each genome is indicated on the right. The study found that the CYP93 gene family is widely distributed in flowering plants, but no CYP93 sequences were found in the genomes of non-flowering plants, including green algae (such as Chlamydomonas, Volvox, Chlorella, and Ulva), mosses (such as Sphagnum), lycophytes (such as Lycopodium), and gymnosperms (such as spruce). To confirm these results, the researchers also searched the NCBI database, including expressed sequence tags (ESTs), and no CYP93 sequences were found in these non-flowering species. Interestingly, no CYP93 candidate genes were found in the beet genome, but two previously reported partial sequences were found in Genebank, so they were included in subsequent analyses. The widespread distribution of the CYP93 gene family in flowering plants suggests that the emergence of CYP93 genes predates the divergence of monocots and dicots.
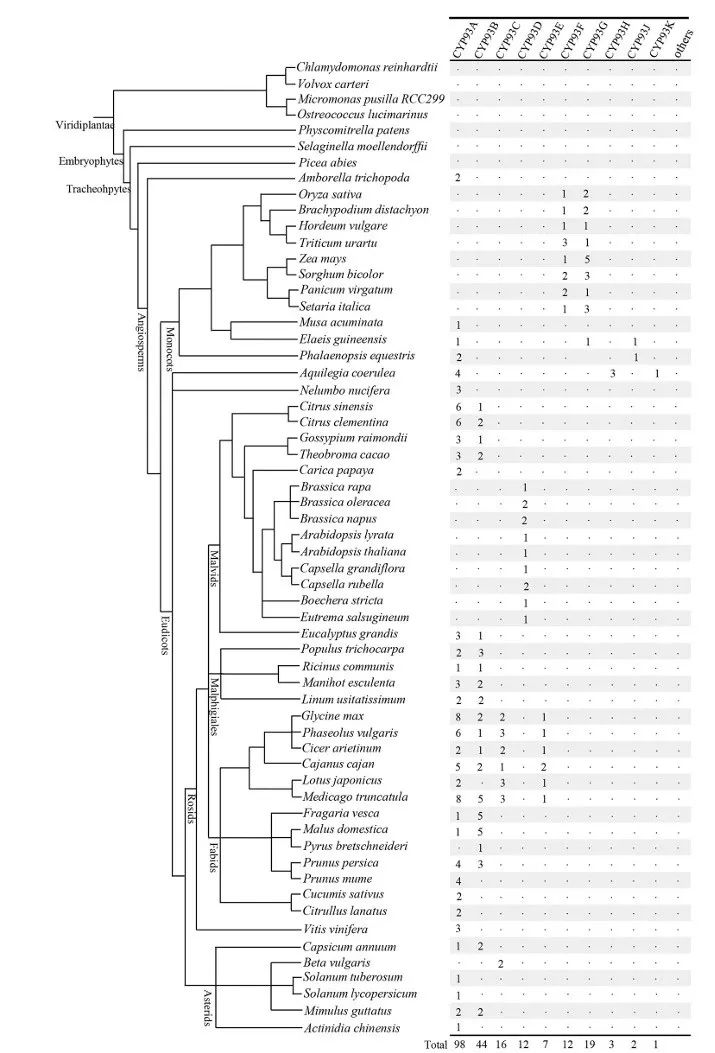
 Figure Legend:
Figure 1 shows the phylogenetic relationships of 60 plant species, which have been previously described. The total number of CYP93 proteins identified in each genome is indicated on the right. Different colors and lines represent different plant groups, such as green algae, mosses, lycophytes, gymnosperms, and flowering plants. The number of CYP93 proteins in each group is also indicated, showing the widespread distribution of the CYP93 gene family in flowering plants.
Figure 2
Content of the paragraph:
Figure 2 shows the phylogenetic tree and classification of 214 plant CYP93 proteins. The neighbor-joining (NJ) tree includes 214 CYP93 proteins from 60 eukaryotes. The proteins are clustered into ten subfamilies (e.g., CYP93A). Colored lines and names indicate the species to which each group of proteins belongs. Black dots represent major clades in the phylogenetic tree, with the corresponding bootstrap support values (1000 repetitions) shown next to the black dots. Bootstrap values less than 50% are represented by black circles, while those greater than 50% are represented by black dots. The numbers in parentheses indicate the dN/dS values for each subfamily or branch. The phylogenetic tree in Figure 2 shows a high consistency of CYP93 proteins, indicating that these genes may have undergone lineage-specific differentiation and loss during evolution. CYP93A is the largest subfamily, including almost all genes from flowering plants (both monocots and dicots), except for Poaceae and Brassicaceae, which form some lineage-specific subfamilies. CYP93B sequences are also widely distributed in many dicotyledons but not in Brassicaceae. CYP93D sequences are only distributed in Brassicaceae and are embedded in the CYP93A subfamily, suggesting they may have originated from one or more gene duplication events of the ancient CYP93A subfamily. CYP93C members are present in all Fabaceae and beet and are embedded in the CYP93B subfamily, indicating it originated from CYP93B and was conserved during evolution. CYP93E sequences are specifically present in Fabaceae. Monocotyledon CYP93 sequences cluster into CYP93F, CYP93G, and CYP93J branches; the CYP93F branch shows homologous distribution only in Poaceae, while the CYP93G branch has members in both Poaceae and oil palm, indicating it is older than CYP93F. CYP93H and CYP93K sequences are only distributed in the basal dicotyledon Aquilegia coerulea (Figures 1 and 2). Overall, phylogenetic analysis reveals the novel derivation of CYP93 genes in flowering plants: initially diverging from an ancient CYP93A group through gene duplication events, followed by further differentiation within the CYP93A group through gene duplication, resulting in the CYP93B–CYP93K subfamilies.
 Figure Legend:
Figure 2 shows the phylogenetic tree and classification of 214 plant CYP93 proteins. Different colors and lines represent different plant groups, such as monocots, dicots, and basal dicots. Black dots represent major clades in the phylogenetic tree, with the corresponding bootstrap support values (1000 repetitions) shown next to the black dots. Bootstrap values less than 50% are represented by black circles, while those greater than 50% are represented by black dots. The numbers in parentheses indicate the dN/dS values for each subfamily or branch. The names of each subfamily, such as CYP93A–CYP93K, are also indicated, showing the differentiation and distribution of the CYP93 gene family during evolution.
Figure 3
Content of the paragraph:
Figure 3 shows the sequence motifs of multiple sequence alignments of 214 plant CYP93 proteins. The sequence motifs generated from amino acid alignments based on MAFFT show the conserved regions of CYP93 proteins. The bit score of each site indicates the information content of each position in the sequence. The height of the amino acid residues at each position represents the degree of conservation. Key conserved motifs are indicated by underlines; red lines indicate less conserved regions; white triangles indicate conserved intron insertion sites in plant CYP93 genes; the numbers inside the triangles indicate the splicing phase of the introns (0 indicates phase 0). Red and black dots represent conserved amino acid insertion or deletion sites in the given subfamily and/or group, respectively; the numbers below each dot indicate the corresponding subfamily, e.g., B indicates the CYP93B subfamily.
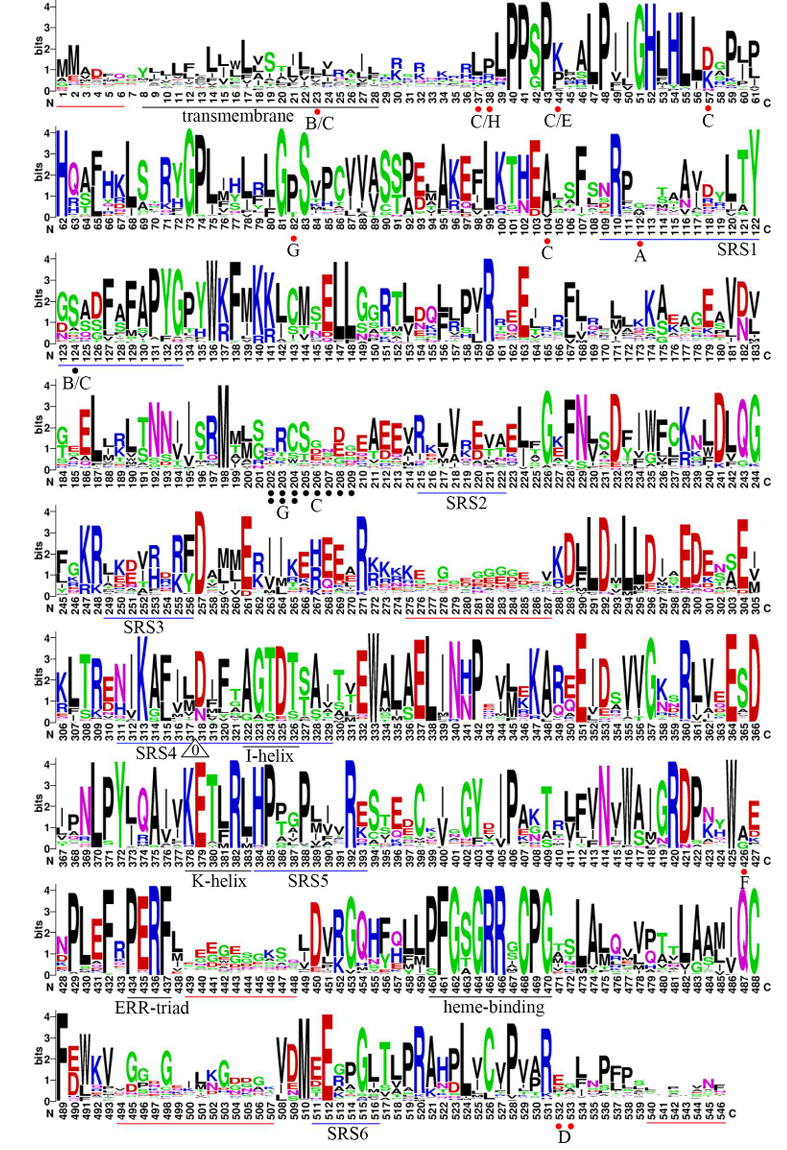
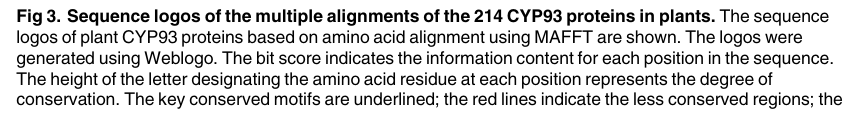
Figure Legend:
Figure 3 shows the sequence motifs of multiple sequence alignments of 214 plant CYP93 proteins. The height of the letters indicates the degree of conservation of the amino acid residues at each position, with higher heights indicating greater conservation. Key conserved motifs are indicated by underlines, and red lines indicate less conserved regions. White triangles indicate conserved intron insertion sites in plant CYP93 genes, with the numbers inside the triangles indicating the splicing phase of the introns (0 indicates phase 0). Red and black dots represent conserved amino acid insertion or deletion sites in the given subfamily and/or group, respectively, with the numbers below each dot indicating the corresponding subfamily, e.g., B indicates the CYP93B subfamily.
Figure 4
Content of the paragraph:
Figure 4 shows the architecture of conserved protein motifs in the eight subgroups of the plant CYP93 family. The sequence motifs of P450 transmembrane, I-helix, K-helix, PERF, and heme-binding motifs based on amino acid alignments show the conservation of these motifs. The bit score of each site indicates the information content of each position in the sequence. A−K indicates the subfamilies CYP93A−CYP93K. The results in Figure 4 show that these P450 motifs are relatively conserved across different subfamilies, but the conservation of transmembrane domains is lower (about 24%). In addition, some subfamily-specific amino acid insertion or deletion sites were found, which may affect protein-protein interactions.
 Figure Legend:
Figure 4 shows the architecture of conserved protein motifs in the eight subgroups of the plant CYP93 family. The height of the letters indicates the degree of conservation of the amino acid residues at each position, with higher heights indicating greater conservation. A−K indicates the subfamilies CYP93A−CYP93K. The positions of the P450 transmembrane, I-helix, K-helix, PERF, and heme-binding motifs are also indicated, showing the conservation of these motifs across different subfamilies.
Figure 5
Content of the paragraph:
Figure 5 shows the Weblogo of substrate recognition sites (SRSs) in the eight subgroups of the plant CYP93 family based on amino acid alignments. The bit score of each site indicates the information content of each position in the sequence. A−K indicates the subfamilies CYP93A−CYP93K. The results in Figure 5 show that the SRS regions have lower conservation across different subfamilies, with amino acid residues in these regions often showing some distinct subfamily-specific substitutions, indicating their important roles in functional differentiation among different CYP93 subfamilies. For example, the Ser 310 residue located in the I-helix motif, embedded in SRS4, shows subfamily-specific substitutions. Similarly, Leu 371 and Lys 375 located in SRS5 also show conserved substitutions between different subfamilies. These results confirm the important role of SRS regions in the functional differentiation of the CYP93 family.
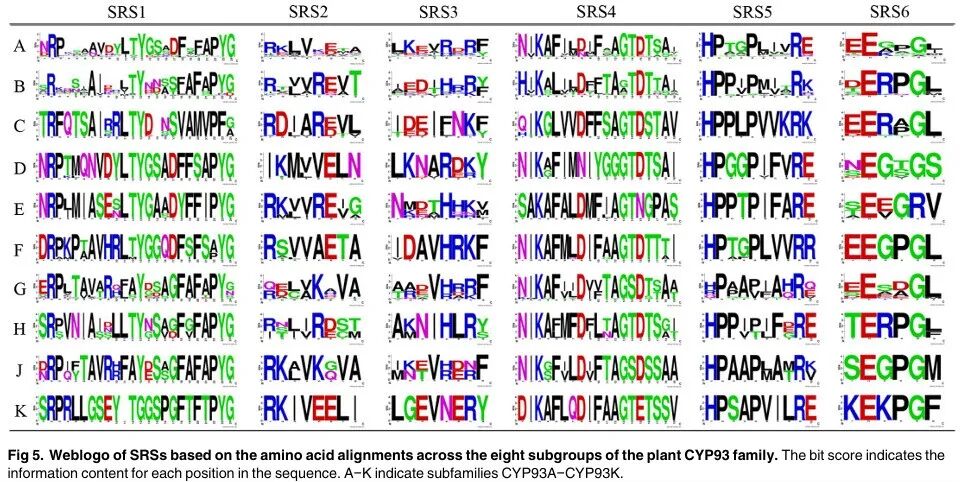 Figure Legend:
Figure 5 shows the Weblogo of substrate recognition sites (SRSs) in the eight subgroups of the plant CYP93 family based on amino acid alignments. The height of the letters indicates the degree of conservation of the amino acid residues at each position, with higher heights indicating greater conservation. A−K indicates the subfamilies CYP93A−CYP93K. The positions of SRS1−SRS6 are also indicated, showing the conservation and specific substitutions of these regions across different subfamilies.
Figure 6
Content of the paragraph:
Figure 6 shows the expression profiles of CYP93 homologous genes in Arabidopsis, soybean, rice, and maize. Figure 6A shows the expression profile of the AtCYP93D1 gene in Arabidopsis. Figures 6B and 6C show the expression profiles of GmCYP93 genes in soybean expression datasets 1[46] and 2[47]. Figures 6D and 6E show the expression profiles of OsCYP93 genes in rice expression datasets 1 (GSE14304) and 2 (GSE19024)[31]. Figure 6F shows the expression profile of the ZmCYP93 gene in maize[48]. The color bar indicates log2 expression values. The results in Figure 6 show that CYP93 genes in dicotyledons are preferentially expressed in roots, while CYP93 genes in monocotyledons are expressed strongly in roots and many other tissues and/or organs, indicating that the expression range in monocotyledons is broader than in dicotyledons.
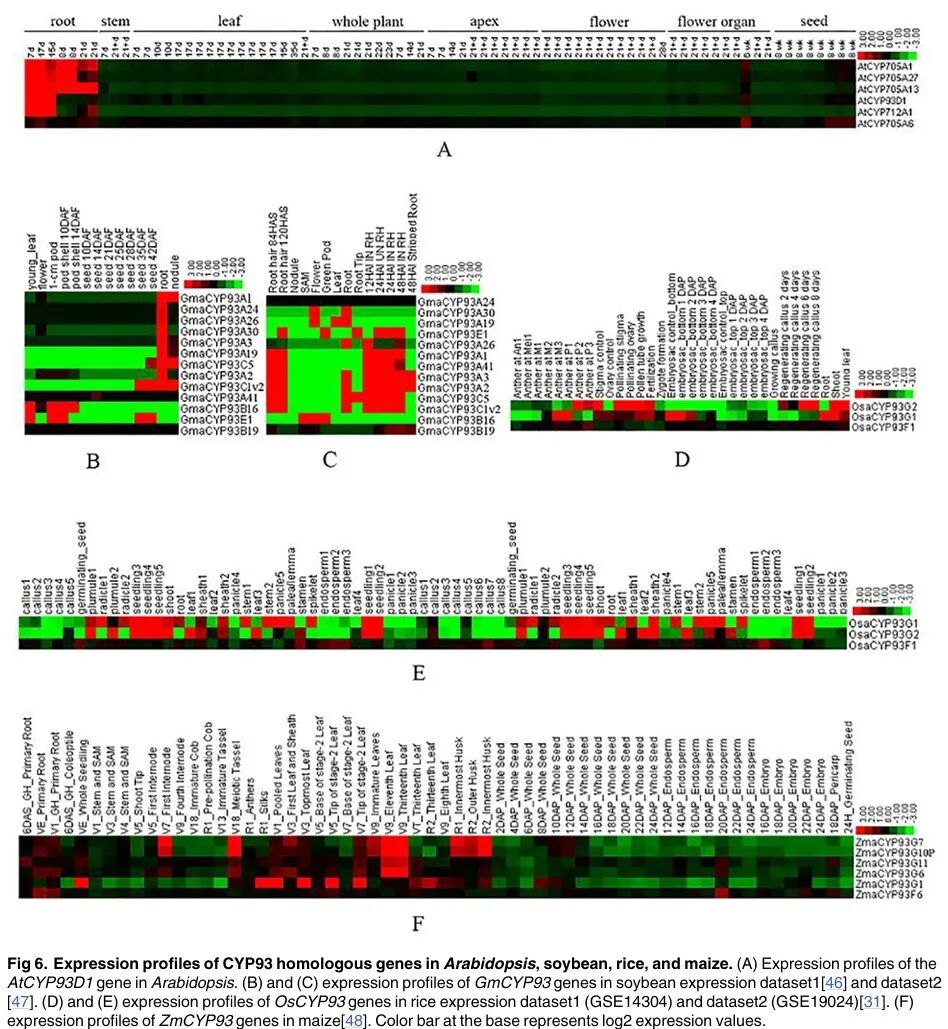 Figure Legend:
Figure 6 shows the expression profiles of CYP93 homologous genes in Arabidopsis, soybean, rice, and maize. Different colors represent the expression levels of different genes, with the color bar indicating log2 expression values. Figure 6A shows the expression profile of the AtCYP93D1 gene in Arabidopsis, Figures 6B and 6C show the expression profiles of GmCYP93 genes in soybean, Figures 6D and 6E show the expression profiles of OsCYP93 genes in rice, and Figure 6F shows the expression profile of ZmCYP93 genes in maize. The names of different tissues and organs, such as roots, stems, leaves, flowers, etc., are also indicated, showing the expression patterns of CYP93 genes in different tissues.
Figure 7
Content of the paragraph:
Figure 7 shows the qRT-PCR expression profile analysis of CYP93 homologous genes in Arabidopsis, soybean, rice, and maize. Figure 7A shows the expression profile of CYP93 genes in soybean. Figure 7B shows the expression profile of the AtCYP93D1 gene in Arabidopsis. Figure 7C shows the expression profile of CYP93 genes in maize. Figure 7D shows the expression profile of CYP93 genes in rice. The results in Figure 7 show that most CYP93 genes show positive results in qRT-PCR, except for OsaCYP93F1, which has no expression signal and may be expressed under specific developmental stages or special conditions. In soybean, multiple GmCYP93 genes have high expression levels in roots, stems, leaves, flowers, and seeds. In Arabidopsis, AtCYP93D has high expression levels in roots and leaves. In maize, ZmaCYP93G5, ZmaCYP93G7, ZmaCYP93G11, and ZmaCYP93G10P have high expression levels in leaves, while ZmaCYP93F6 and ZmaCYP93G6 have high expression levels in roots. In rice, OsaCYP93G2 has the highest expression level in leaves, while OsaCYP93G1 has the highest expression level in roots and stems. Overall, the expression patterns indicate that closely related paralogous genes have similar functions at different stages of plant development.
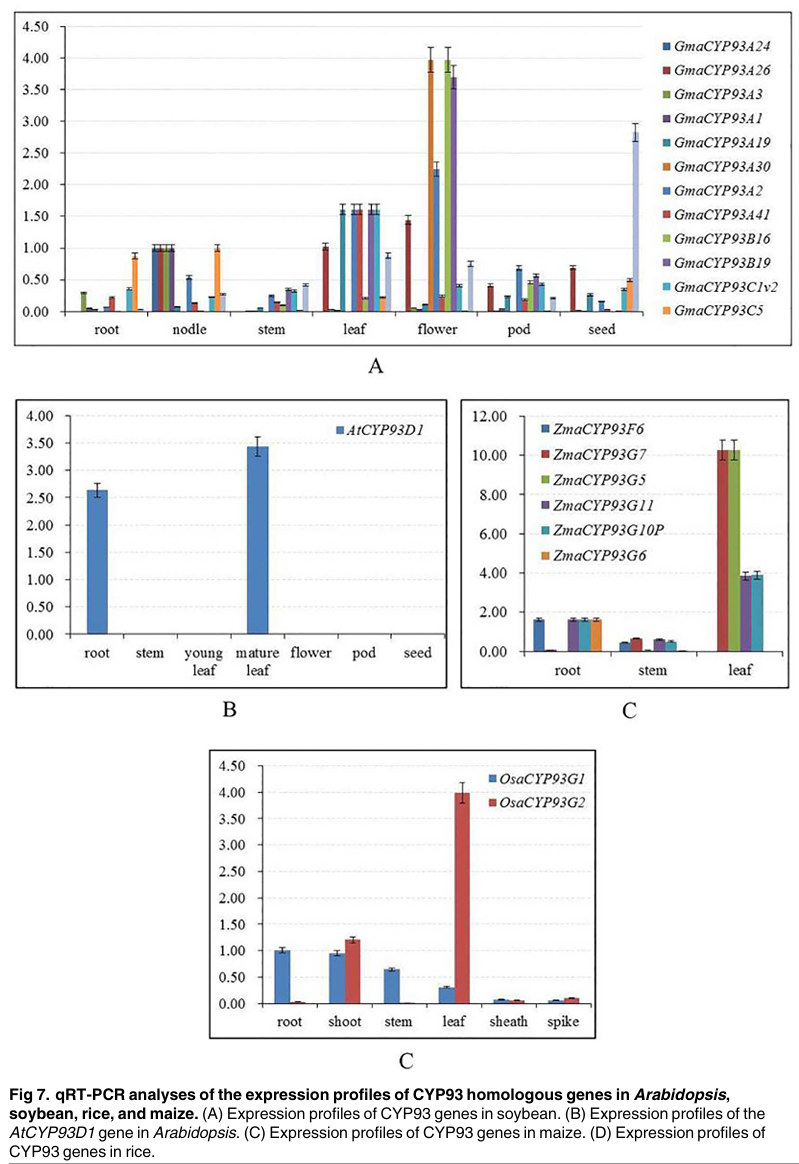
Figure Legend:
Figure 7 shows the qRT-PCR expression profile analysis of CYP93 homologous genes in Arabidopsis, soybean, rice, and maize. Different colors represent the expression levels of different genes, with Figure 7A showing the expression profile of CYP93 genes in soybean, Figure 7B showing the expression profile of the AtCYP93D1 gene in Arabidopsis, Figure 7C showing the expression profile of CYP93 genes in maize, and Figure 7D showing the expression profile of CYP93 genes in rice. The names of different tissues and organs, such as roots, stems, leaves, flowers, etc., are also indicated, showing the expression patterns of CYP93 genes in different tissues. Specific gene names, such as GmaCYP93A1, AtCYP93D1, ZmaCYP93G5, etc., are also indicated, showing the expression levels of these genes in different tissues.
Figure 8
Content of the paragraph:
Figure 8 shows the expression profiles of plant CYP93 genes under abiotic stress. Figure 8A shows the expression profiles of AtCYP93 and representative P450 genes under abiotic stress. Figure 8B shows the expression profiles of eight soybean CYP93 genes based on four abiotic stress microarray datasets. Figure 8C shows the expression profiles of rice CYP93 genes based on four abiotic stress microarray datasets. The color bar indicates log2 expression values. The results in Figure 8 show that AtCYP93D1 is preferentially expressed in roots and significantly increases under UV-B, cold, and heat treatments. In soybean, multiple CYP93 genes show significantly increased expression under NaHCO3 treatment and magnesium stress, but their expression is suppressed under aluminum and magnesium stress. In rice, OsaCYP93G1 shows suppressed expression under drought, salt stress, and cold stress, while OsaCYP93G2 shows suppressed expression under drought and cold stress but increased expression under heat stress. OsaCYP93F1 shows weak and relatively consistent expression under all investigated stresses.
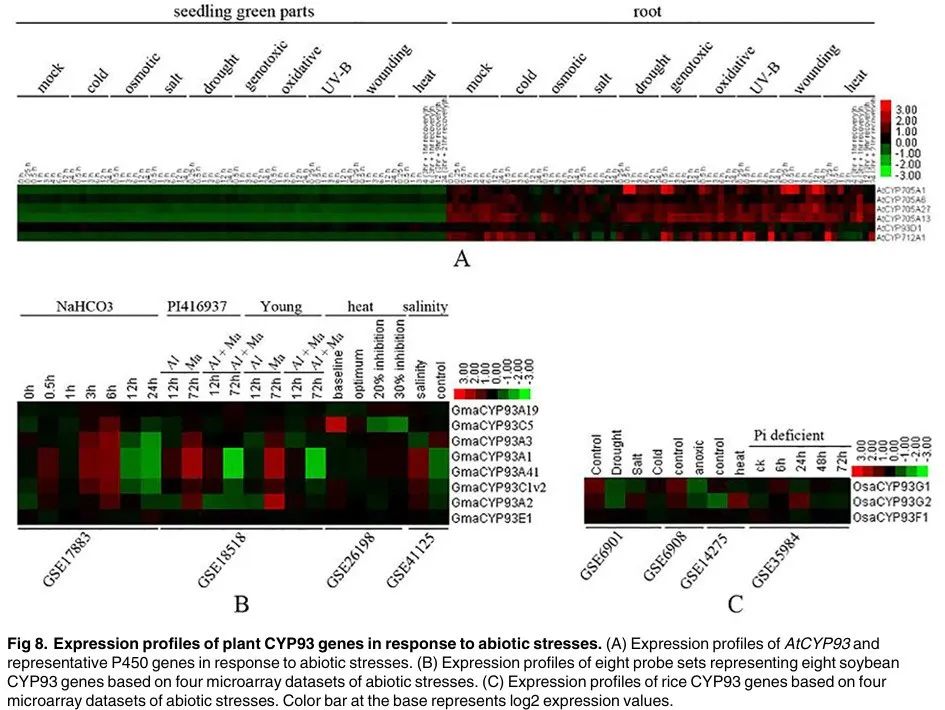 Figure Legend:
Figure 8 shows the expression profiles of plant CYP93 genes under abiotic stress. Different colors represent the expression levels of different genes, with Figure 8A showing the expression profile of AtCYP93D1 gene under abiotic stress, Figure 8B showing the expression profiles of eight CYP93 genes in soybean, and Figure 8C showing the expression profiles of CYP93 genes in rice. Different abiotic stress conditions, such as UV-B, cold, heat, drought, and salt stress, are also indicated, showing the expression patterns of CYP93 genes under different stress conditions. Specific gene names, such as AtCYP93D1, GmaCYP93A1, OsaCYP93G1, etc., are also indicated, showing the expression levels of these genes under different stress conditions.
Figure 9
Content of the paragraph:
Figure 9 shows the expression profiles of soybean CYP93 genes under biotic stress. Figure 9A shows the expression profile of soybean CYP93 genes after root knot nematode infection. Figure 9B shows the expression profile of soybean CYP93 genes after Phytophthora sojae infection. Figure 9C shows the expression profile of soybean CYP93 genes after soybean aphid infestation. The color bar indicates log2 expression values. The results in Figure 9 show that, except for GmaCYP93E1, the expression levels of soybean CYP93 genes significantly increase after rust disease, Phytophthora sojae infection, and soybean aphid infestation, indicating that these genes may play roles in plant defense against pathogens and insects.
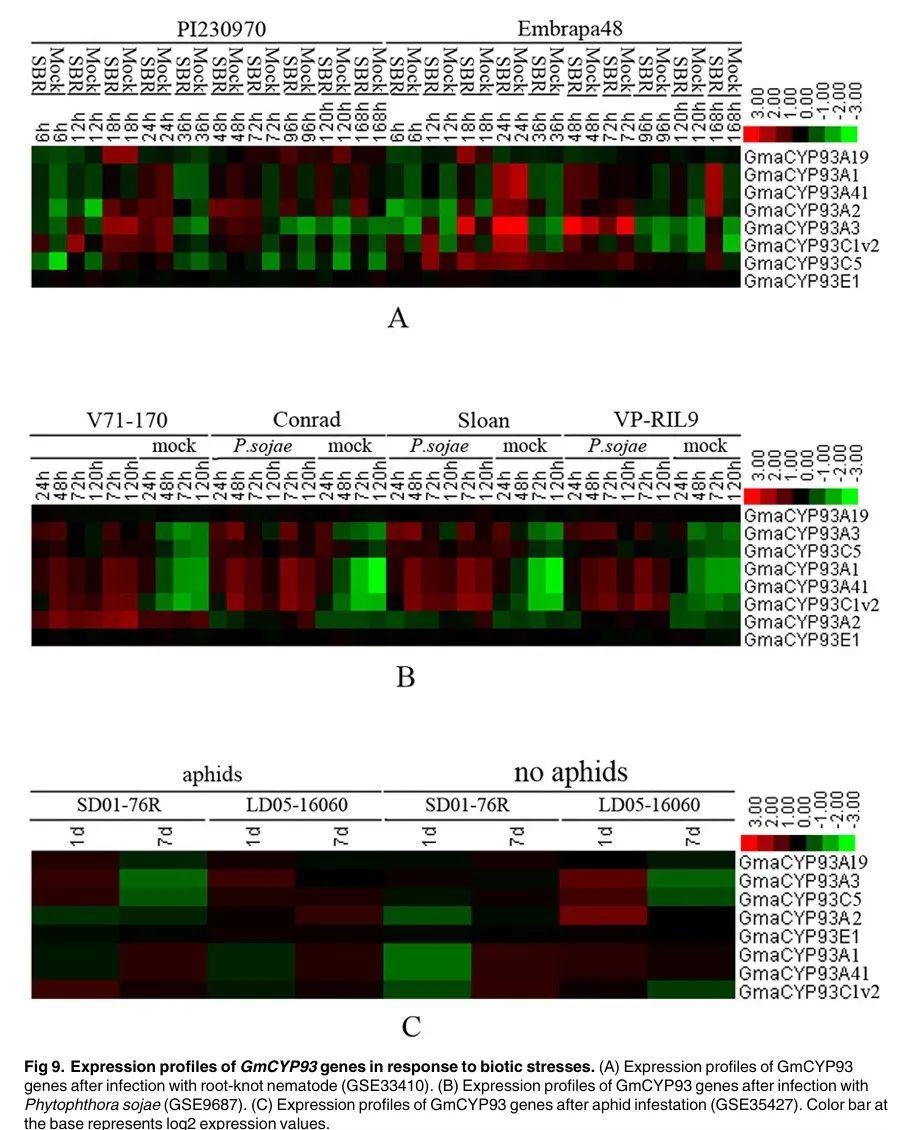 Figure Legend:
Figure 9 shows the expression profiles of soybean CYP93 genes under biotic stress. Different colors represent the expression levels of different genes, with Figure 9A showing the expression profile of soybean CYP93 genes after root knot nematode infection, Figure 9B showing the expression profile of soybean CYP93 genes after Phytophthora sojae infection, and Figure 9C showing the expression profile of soybean CYP93 genes after soybean aphid infestation. Different biotic stress conditions, such as root knot nematodes, Phytophthora sojae, soybean aphids, etc., are also indicated, showing the expression patterns of CYP93 genes under different biotic stress conditions. Specific gene names, such as GmaCYP93A1, GmaCYP93B16, GmaCYP93C1v2, etc., are also indicated, showing the expression levels of these genes under different biotic stress conditions.
4. Article Summary
This article provides a comprehensive genome-wide analysis, classification, evolution, and expression analysis of the Cytochrome P450 93 family (CYP93) in land plants. The study found that the CYP93 gene family is widely present in 60 species of green plants, with a total of 214 CYP93 proteins identified, which are specifically present in flowering plants and can be classified into ten subfamilies (CYP93A–K). CYP93A is derived from an ancestor in flowering plants, while the other subfamilies show lineage-specific distribution. Each subfamily typically has conserved gene numbers, structures, and features, indicating functional conservation during evolution. Synonymous nucleotide substitution (dN/dS) analysis shows that CYP93 genes are under strong negative selection, indicating that these genes are functionally conserved during evolution.
The study also found that CYP93 genes are preferentially expressed in roots in dicotyledons and monocotyledons and tend to be induced by biotic and/or abiotic stress, consistent with their known functions in plant secondary metabolism. Specifically, the expression patterns of CYP93 genes in roots suggest that they may play important roles in plant defense responses, especially under stress conditions. For example, AtCYP93D1 is mainly expressed in roots of Arabidopsis and significantly increases under UV-B, cold, and heat treatments. In soybean, multiple CYP93 genes show significantly increased expression in roots, especially under NaHCO3 treatment and magnesium stress. In rice, OsaCYP93G1 and OsaCYP93G2 show suppressed expression under drought, salt stress, and cold stress, but increased expression under phosphorus starvation conditions.
Additionally, the study analyzed the expression patterns of CYP93 genes under biotic stress, finding that soybean CYP93 genes significantly increase expression after rust disease, Phytophthora sojae infection, and aphid infestation, indicating that these genes may play roles in plant defense against pathogens and insects.
In summary, this study provides a detailed analysis of the evolutionary history and functions of the CYP93 gene family in land plants, revealing the important roles of these genes in plant secondary metabolism and stress responses. These findings provide a significant foundation for future functional analyses and metabolic engineering.