

GDB Dashboard is a visual tool for GDB modules, developed in pure Python, providing a modular visual interface for GDB in Python.

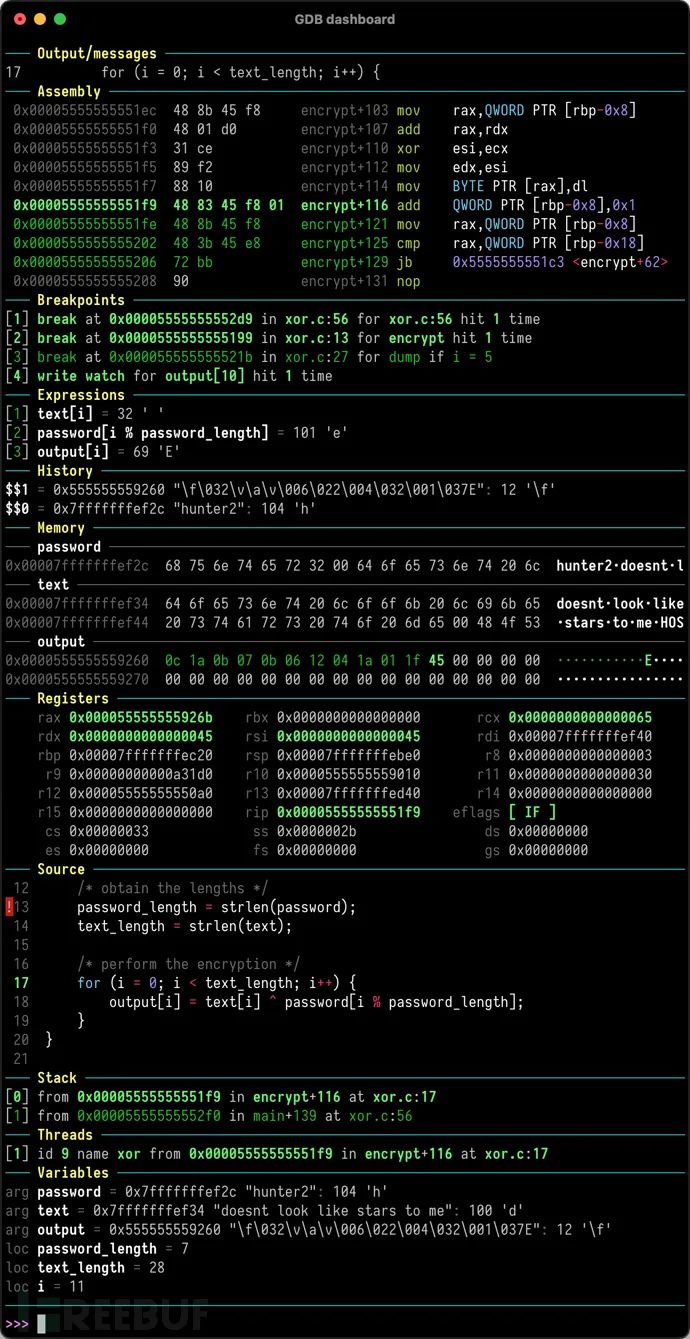
The GDB Dashboard provides a standalone single-file .gdbinit, which, among other features, enables a configurable dashboard to display the most relevant information during program execution. Its main goal is to reduce the number of GDB commands issued to check the current program state, allowing researchers to focus on control flow.
1. A single GDB initialization file;
2. Supports writing the dashboard to the main GDB console or an external TTY;
3. Interacts with GDB using a native Python API;
4. Contains several default modules to meet the most basic needs: source code, assembly, registers, etc.;
5. User-defined modules can be easily developed by extending Python classes;
6. Additional configuration files (GDB and Python) are read from ~/.gdbinit.d/.
7. Fully customizable styled user interface and dynamic command prompt;
8. Optional syntax highlighting using Pygments;
9. Does not redefine any GDB commands; instead, all functions can be used as subcommands of the main dashboard command;
Python 3
Since this tool is developed based on Python 3, we first need to install and configure the latest version of the Python 3 environment on our local device.
Next, researchers can clone the project source code to their local device using the following command:
git clone https://github.com/cyrus-and/gdb-dashboard.git
Simply place .gdbinit in your working directory root path:
wget -P ~ https://github.com/cyrus-and/gdb-dashboard/raw/master/.gdbinitYou can also install Pygments to enable syntax highlighting:
pip install pygments
This project is developed and released under theMITopen source license agreement.
GDB Dashboard:
https://github.com/cyrus-and/gdb-dashboard


http://pygments.org/