Click the blue text to follow us

Author
Chen Sixin / Quanzhou No. 7 Middle School, Fujian Province
The photoelectric effect experiment involves the most fundamental concepts of quantum physics and serves as an important bridge between quantum physics and classical physics. The physics curriculum standards require students to understand the experimental laws of the photoelectric effect through experiments, comprehend the meanings of concepts such as stopping voltage, threshold frequency, and work function; understand the photon theory and its explanation of the photoelectric effect; and be familiar with Einstein’s photoelectric effect equation and its physical significance. Traditional photoelectric effect demonstrators have some drawbacks, such as the inability to change the power supply direction to study the magnitude of the stopping voltage, missing an important aspect of the study of the photoelectric effect; using pointer-type dials that are small and inconvenient for observation during demonstrations; and the experimental circuit part being pre-connected inside the demonstrator, leaving little room for students to explore practical content, which is more about intuitive perception of phenomena and not conducive to quantitative research.

Design Concept
Design an automatic switching light source module that outputs multiple monochromatic lights to obtain accurate wavelength values; design electrical components as standard modules, using a bus method for data transmission; allow students to independently connect circuits, supporting the expansion of more modules for innovative experimental exploration; use a capacitive touch screen to control experimental equipment, set parameters, process data, and learn micro-lessons; utilize IoT technology to streamline experimental data flow, achieving multi-terminal data sharing and processing, including interactive interfaces, blackboard magnetic electric meters, web data displays, printing modules, and mobile terminals, supporting real-time display and in-depth analysis; record students’ operational traces during experiments for process evaluation; the device can complete multiple experiments such as depicting the volt-ampere characteristics of photoelectric tubes, the relationship between stopping voltage and incident light wavelength, determining factors of saturation photoelectric current, measuring liquid concentration, and designing photoelectric sensors. Multiple data terminals can meet different classroom needs and are suitable for demonstration experiments, group experiments, and extracurricular innovative expansions.
Project Production
Hardware Design
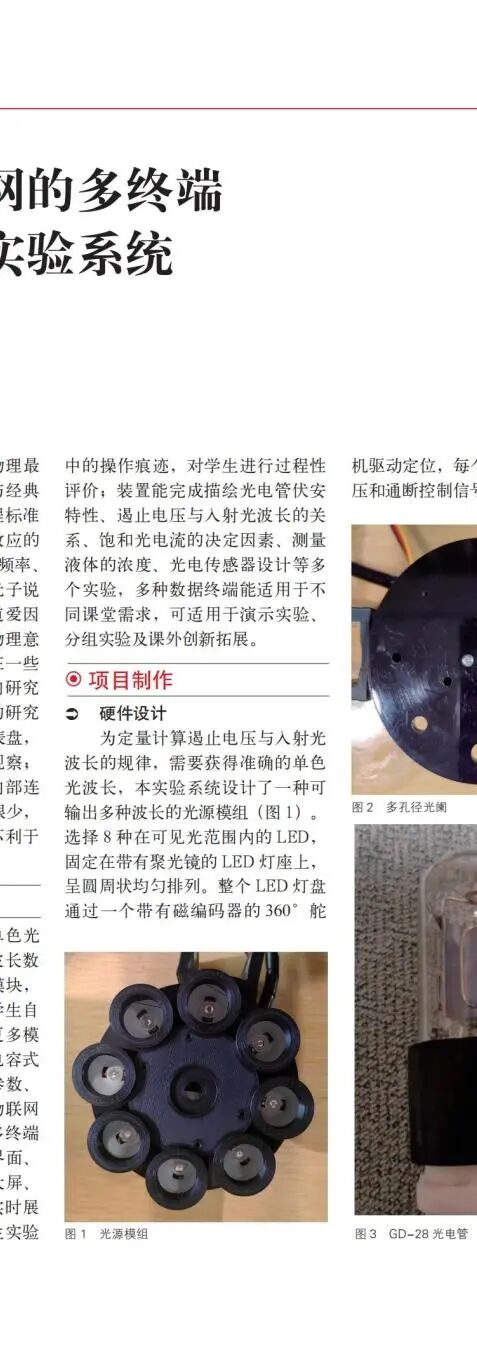
To quantitatively calculate the relationship between stopping voltage and incident light wavelength, it is necessary to obtain accurate monochromatic light wavelengths. This experimental system designs a light source module that can output multiple wavelengths (Figure 1). Eight types of LEDs within the visible light range are selected, fixed on an LED lamp holder with a condenser lens, arranged uniformly in a circular pattern. The entire LED lamp panel is driven and positioned by a 360° servo with a magnetic encoder, and the working voltage and on-off control signals for each LED can be issued by the main controller, with the accurate wavelength values of the LEDs measured by a spectrometer.
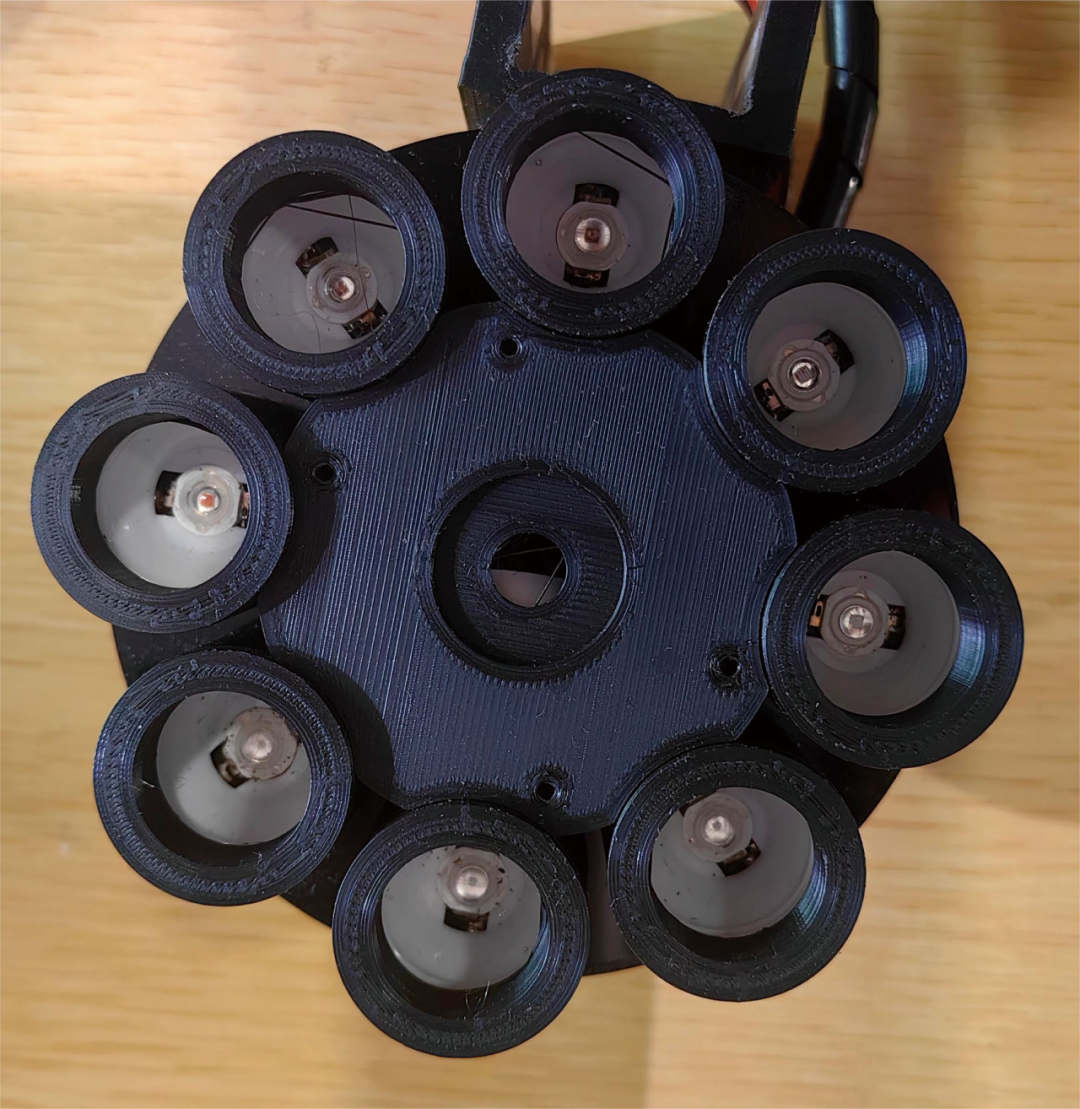
Figure 1 Light Source Module
This experimental system uses an automatically switching multi-aperture diaphragm (Figure 2), designed with 8 different apertures evenly distributed on a disk, driven by a servo. The diameter of this disk is the same as that of the fixed LED lamp holder, and it is concentrically mounted to ensure that the different apertures of the diaphragm are aligned with the LEDs.
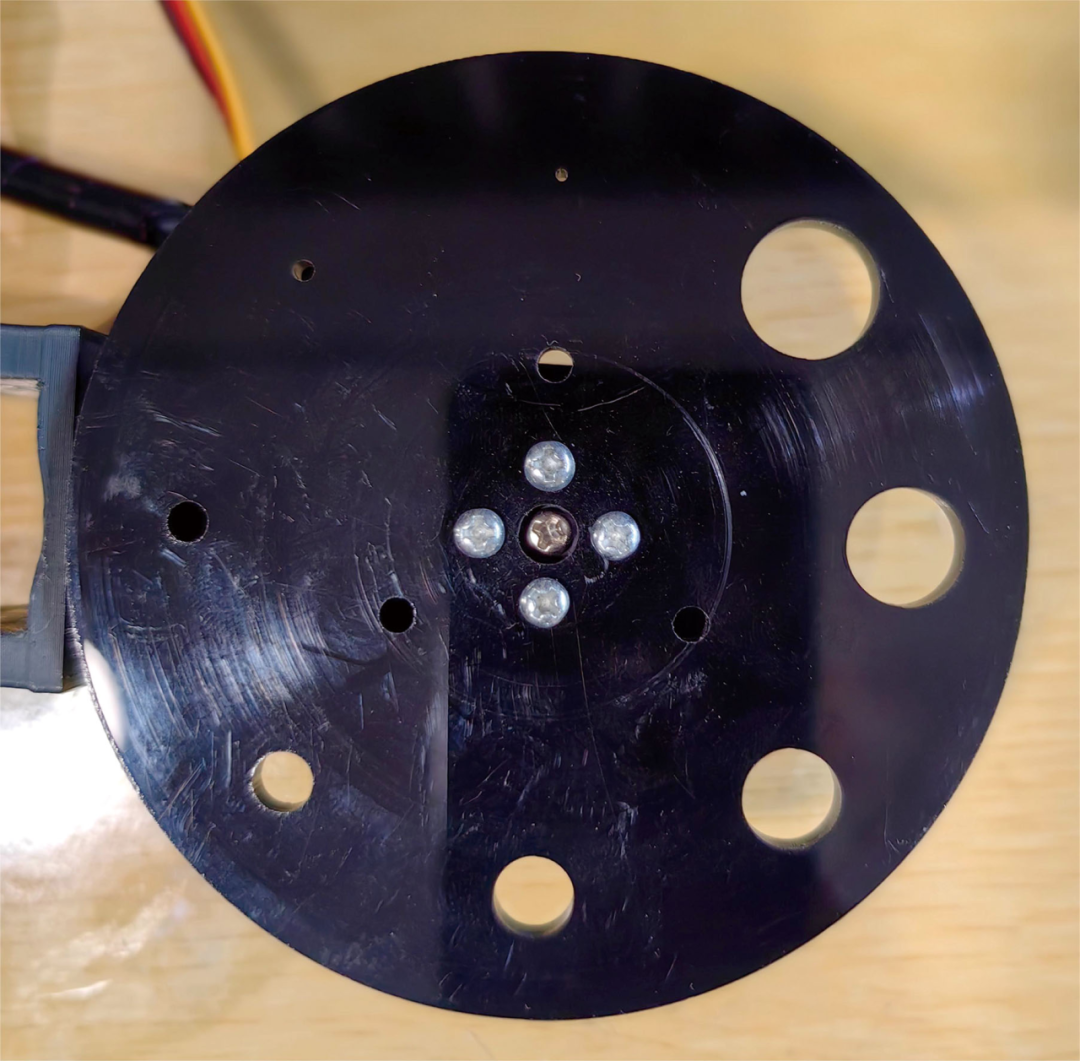
Figure 2 Multi-Aperture Diaphragm
The GD-28 photoelectric tube selected for this experimental system (Figure 3) is a side-window antimony-potassium cesium photoelectric cathode. To avoid interference from external light, the photoelectric tube is installed in a black 3D-printed light shield, with a window reserved on the side. The anode shape of the GD-28 photoelectric tube is a wire frame, and the light path avoids direct exposure to the wire frame, effectively reducing anode current, with the cathode and anode connected to the bottom terminal connector via wires.
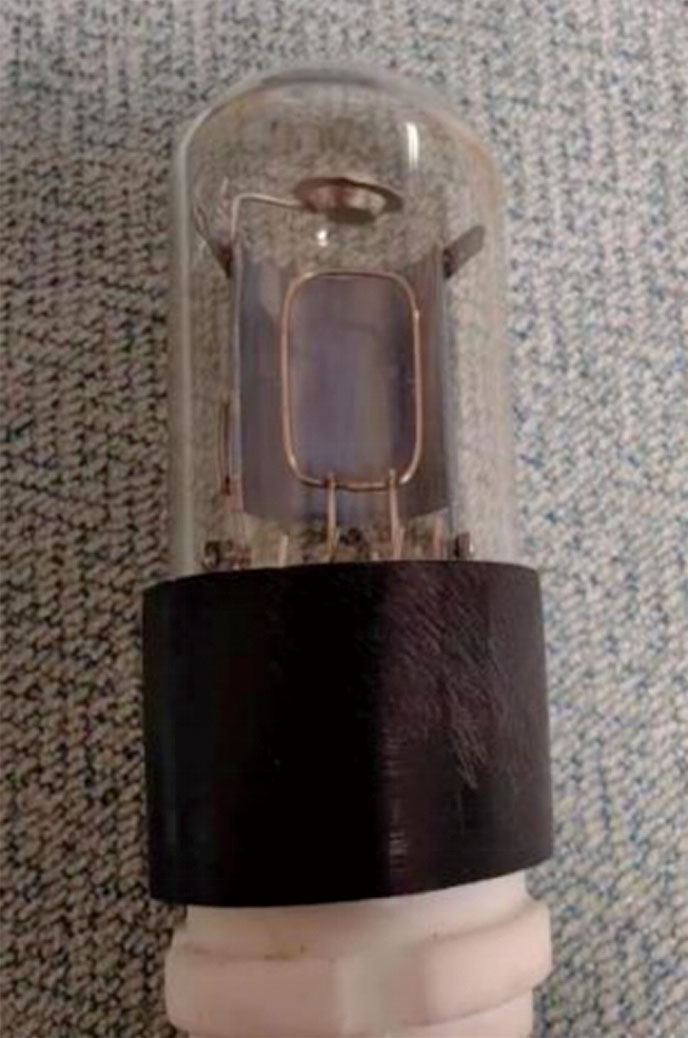
Figure 3 GD-28 Photoelectric Tube
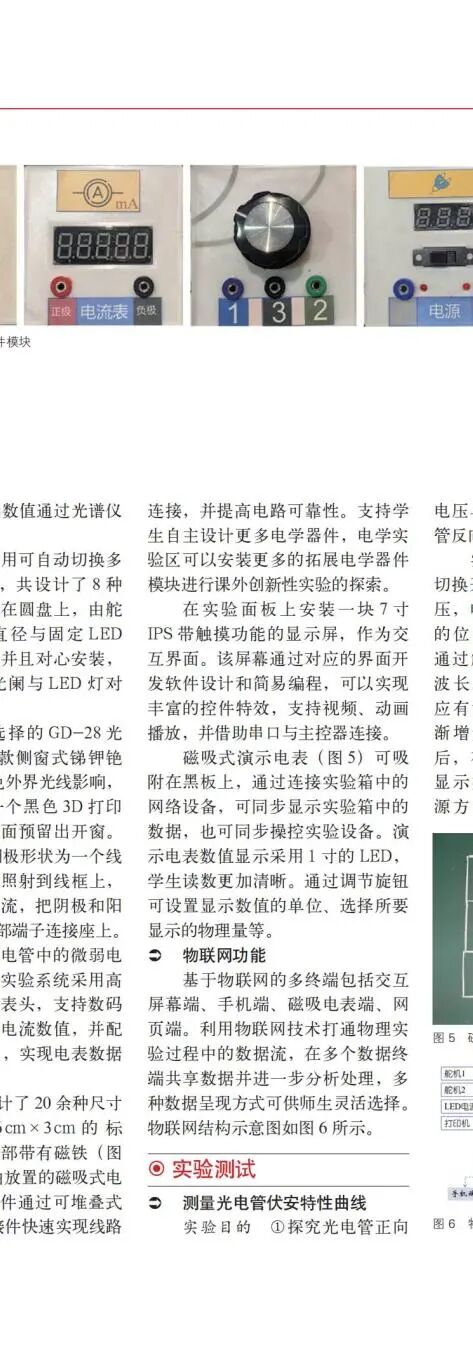
To accurately measure the weak current and stopping voltage in the photoelectric tube, this experimental system uses a high-precision DC digital display meter, supporting real-time display of voltage and current values on a digital tube, and equipped with an isolated RS485 interface for data transmission and collection.
This experimental system designs over 20 standardized electrical components with dimensions of 6 cm × 6 cm or 6 cm × 3 cm, with magnets on the bottom (Figure 4), and a freely placeable magnetic experimental area. The electrical components quickly connect circuits using stackable 2 mm banana plug connectors, improving circuit reliability. Students are supported to design more electrical components independently, and the electrical experimental area can install more extended electrical component modules for extracurricular innovative experimental exploration.
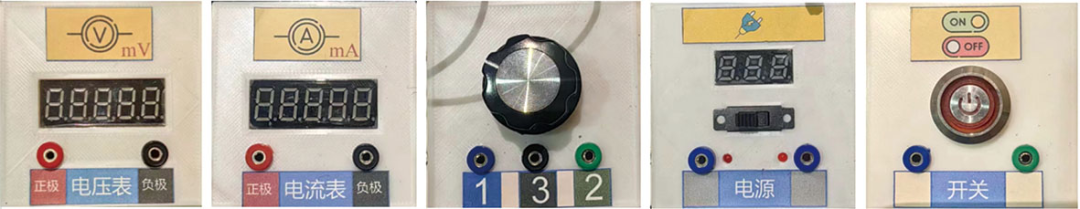
Figure 4 Standard Size Electrical Component Module
A 7-inch IPS touch-enabled display is installed on the experimental panel as an interactive interface. This screen can be designed and programmed using corresponding interface development software, achieving rich control effects, supporting video and animation playback, and connecting to the main controller via serial port.
The magnetic demonstration electric meter (Figure 5) can be attached to the blackboard, and by connecting to the network device in the experimental box, it can synchronize the display of data in the experimental box and control the experimental equipment. The value display of the demonstration electric meter uses a 1-inch LED, making it clearer for students to read. By adjusting the knob, the unit of the displayed value can be set, and the physical quantity to be displayed can be selected.
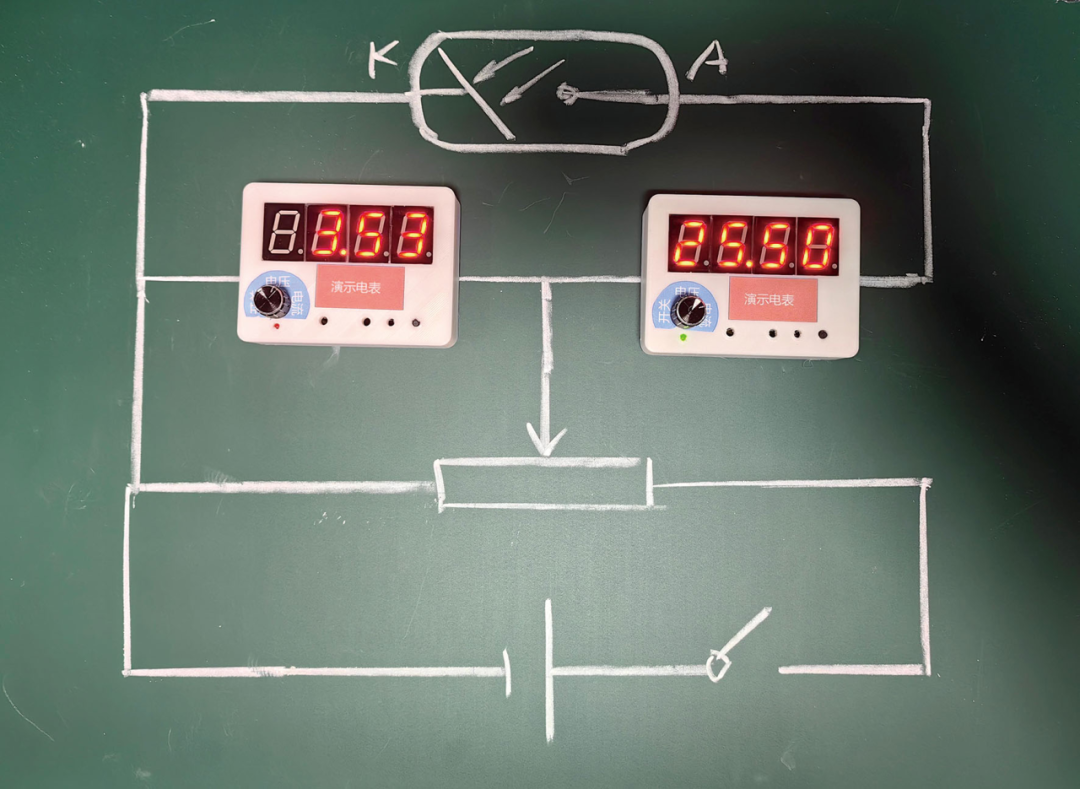
Figure 5 Magnetic Demonstration Electric Meter
IoT Functionality
The IoT-based multi-terminals include interactive screen terminals, mobile terminals, magnetic electric meter terminals, and web terminals. Utilizing IoT technology to streamline data flow during physics experiments allows for data sharing and further analysis across multiple data terminals, with various data presentation methods available for flexible selection by teachers and students. The schematic diagram of the IoT structure is shown in Figure 6.
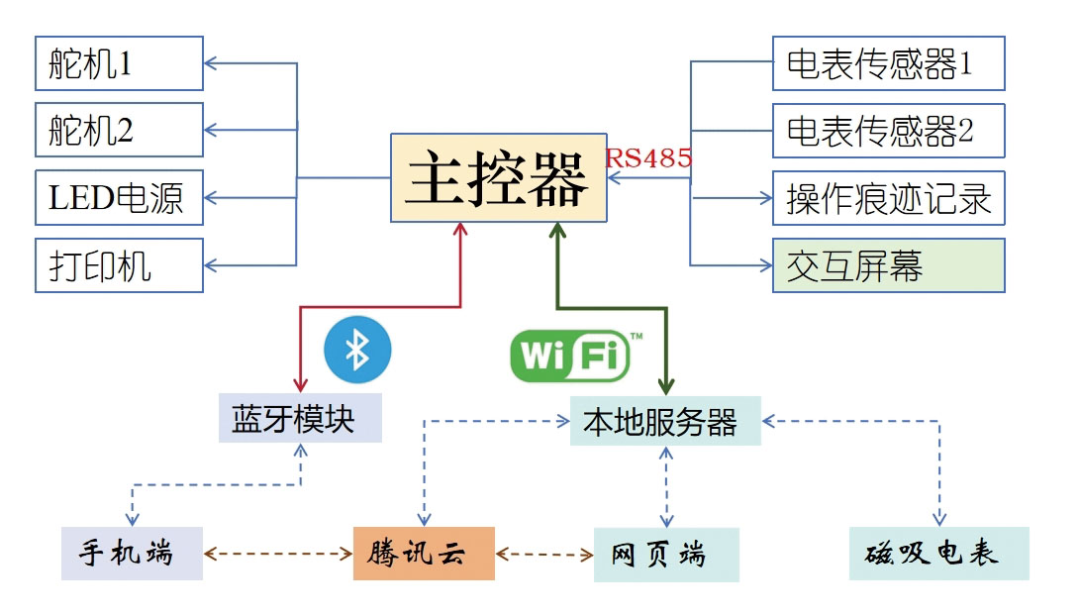
Figure 6 IoT Structure Schematic
Experimental Testing
Measuring the Volt-Ampere Characteristics of the Photoelectric Tube
Experimental Objectives ① Explore the relationship between the forward voltage of the photoelectric tube and the photoelectric current. ② Explore the relationship between the reverse voltage of the photoelectric tube and the photoelectric current.
Experimental Steps ① Use the power direction switch to select forward voltage for the photoelectric tube, turn the potentiometer knob to the position where the output voltage is 0, ensuring the switch is off. ② Control the light source output to 520 nm wavelength and diaphragm diameter of 14 mm via the touch screen; the ammeter should show a reading. ③ Gradually increase the forward voltage using the potentiometer knob, manually collect data, and synchronize the data display on the magnetic electric meter, web terminal, etc. ④ Disconnect the switch, switch the power direction to reverse, and repeat the measurement. ⑤ Change the monochromatic light wavelength of the power output, change the diaphragm diameter, and repeat the measurement.
Experimental Conclusion ① From the relationship between the forward voltage of the photoelectric tube and the photoelectric current, it can be seen that as the voltage increases, the photoelectric current increases and approaches a certain saturation current; for the same wavelength of incident light, the higher the supply voltage (the stronger the light intensity), the greater the photoelectric current. ② As the reverse voltage across the photoelectric tube increases, the photoelectric current rapidly decreases; when the photoelectric current is zero, the stopping voltage under different wavelengths can be measured. It can be seen that the shorter the wavelength, the greater the stopping voltage. For the same wavelength, the stopping voltage remains the same for different light intensities.
Relationship Between Stopping Voltage and Incident Light Wavelength
Experimental Objectives ① Quantitatively measure the relationship between stopping voltage and incident light wavelength. ② Measure Planck’s constant. ③ Measure the limit wavelength of the photoelectric tube’s cathode material.
Experimental Steps ① Apply reverse voltage across the photoelectric tube. ② Select different incident light sources and record the incident light wavelengths. ③ Keep the diaphragm diameter and supply voltage constant, adjust the potentiometer to increase the reverse voltage until the photoelectric current stabilizes at zero, and record the size of the reverse voltage. ④ Repeat the measurement for more than 5 incident light wavelengths corresponding to the stopping voltage.
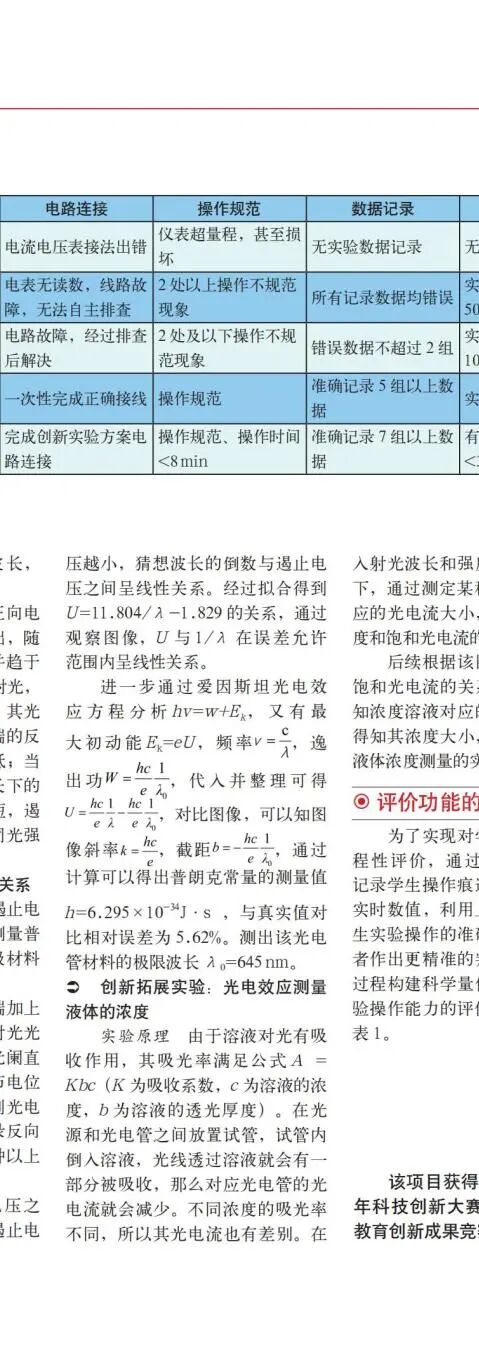
By observing the relationship between wavelength and stopping voltage, it is found that the longer the wavelength, the smaller the stopping voltage, hypothesizing that the reciprocal of the wavelength is linearly related to the stopping voltage. After fitting, the relationship U=11.804/λ-1.829 is obtained, and by observing the graph, U and 1/λ are linearly related within the error margin.
Furthermore, through Einstein’s photoelectric effect equation hv=w+Ek, with maximum initial kinetic energy Ek=eU, frequency, and work function, substituting and rearranging gives, comparing the graph, the slope and intercept can be used to calculate the measured value of Planck’s constant h=6.295×10⁻³⁴J·s, with a relative error of 5.62% compared to the true value. The limit wavelength of the photoelectric tube material is measured as λ0=645 nm.
Innovative Extension Experiment: Measuring the Concentration of Liquids Using the Photoelectric Effect
Experimental Principle Due to the absorption of light by the solution, its absorbance satisfies the formula A = Kbc (where K is the absorption coefficient, c is the concentration of the solution, and b is the thickness of the solution). A test tube is placed between the light source and the photoelectric tube, filled with the solution; as light passes through the solution, some will be absorbed, resulting in a decrease in the photoelectric current of the photoelectric tube. Different concentrations have different absorbance rates, so their photoelectric currents will also differ. Under constant incident light wavelength and intensity, by measuring the photoelectric current corresponding to different concentrations of a certain solution, the relationship between liquid concentration and saturation photoelectric current can be established.
Subsequently, based on the graph obtained from the relationship between concentration and saturation photoelectric current, the concentration of an unknown concentration solution can be determined by measuring its corresponding saturation photoelectric current, greatly simplifying the experimental steps for measuring liquid concentration.
Implementation of Evaluation Functionality
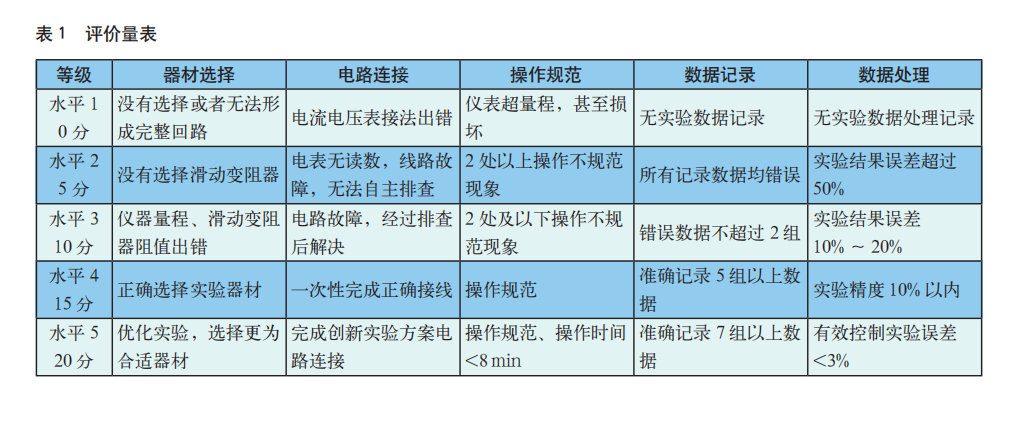
To achieve process evaluation of students’ experimental operations, real-time recording of students’ operational traces and real-time values of various sensors is conducted via RS485 bus, using upper-level software to analyze the accuracy of students’ experimental operations, assisting evaluators in making more precise judgments. A scientific quantitative standard is constructed for the experimental operation process, enabling evaluation of experimental operational capabilities; the evaluation scale is detailed in Table 1.
This project won the First Prize in Technological Education Innovation at the 38th National Youth Science and Technology Innovation Competition.
WeChat Subscription Process
Step 1
Scan the QR code with WeChat

Step 2
Click the image to directly jump to the mini-program

Source | “China Science and Technology Education” 2025-03
Editor | Meng Xiang
Reviewers | Ruo Xi, Zhu Zhi’an