This article is an excellent piece from the Kx forum.
Kx forum author ID:StrokMitream
Continuing from the previous article,Firmware Analysis: Tools, Methods, and Techniques (Part 1)
During firmware analysis, you may encounter files that are encrypted to some extent. In this case, you first need to confirm whether the entire file is encrypted or just a portion of it. If it is encrypted, you may need to check its details.
If you are just scrolling through the file line by line, it can be quite tedious. It would be much easier to examine the entire file from a higher-level perspective.
Calculating entropy is an effective method to perceive whether a given byte sequence is compressed or encrypted. A high entropy value indicates that it may be encrypted or compressed, while a low entropy value suggests the opposite. However, even with a specific entropy value, you may not always be able to make an accurate judgment immediately.
Visualization tools are very helpful for quickly overviewing entropy values. Here are some examples:
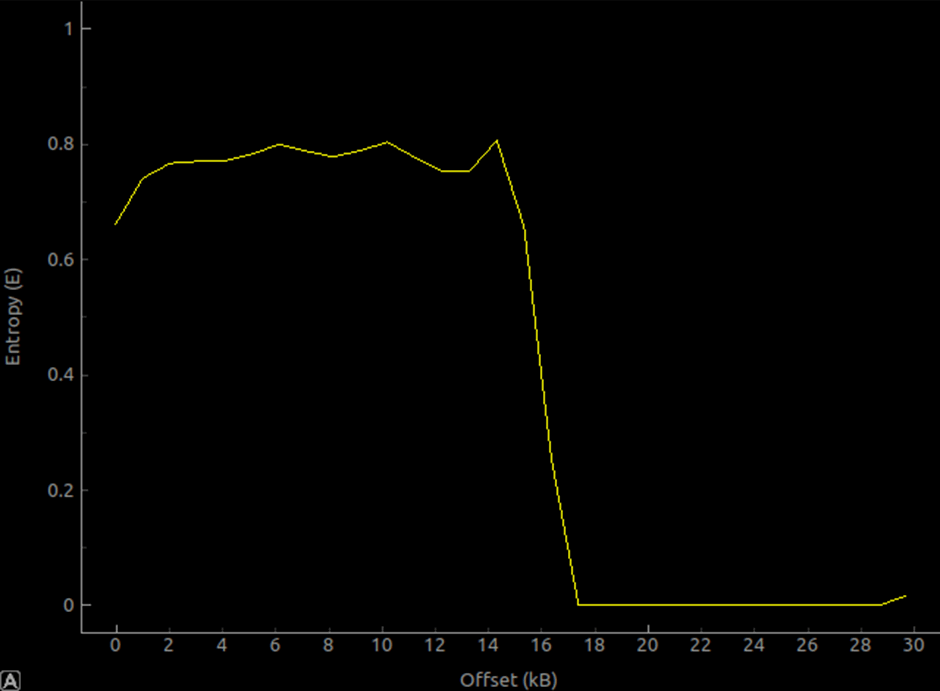
binwalk includes a built-in entropy calculator that can output 2D graphical results. In terms of entropy visualization, this tool is quite good. However, its output data only contains two dimensions, and some subtle data may be difficult to reflect.
The above image shows the entropy value of the STM32F4 bootloader. In fact, the first 16kb of content mainly consists of bare-metal startup thumb bytecode (and this part of the code is likely to have been specifically reduced and optimized), resulting in a relatively high entropy value for this section. Nevertheless, the entropy value is still far from 1, so it is clear that this part is not encrypted. The following 12kb mainly consists of 0xFF bytes, so the calculated entropy value for this part is extremely low, almost close to 0.
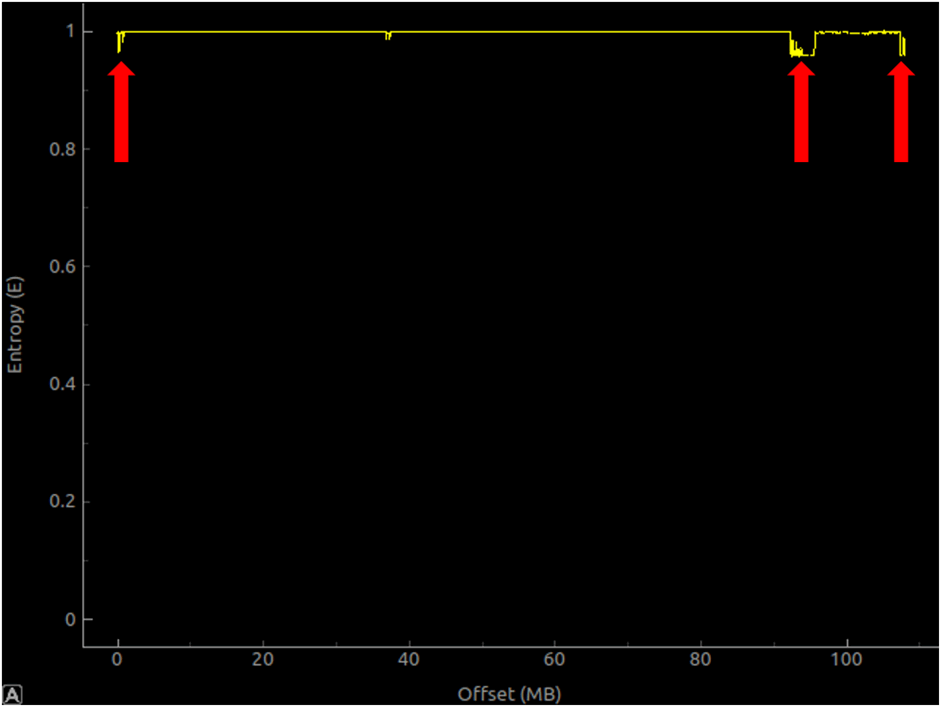
The above image is the entropy graph of a large encrypted firmware (over 100 mb). The entropy value of this file is very close to 1 (high entropy). However, some small dips (at 0mb, 90mb, and at the far right) indicate that there are slight flaws in the encryption at these points. Not overlooking these details may help in subsequent analysis.
[ binvis.io ] is a very good full-color binary visualization analysis tool. As long as you don’t mind uploading files to someone else’s server, binvis.io is quite powerful for analyzing small files.
There is a standalone project called [ binvis ] developed in C#, which stopped development a long time ago. On the surface, this project seems unrelated to binvis.io, but it does a great job in offline analysis, especially for large files.
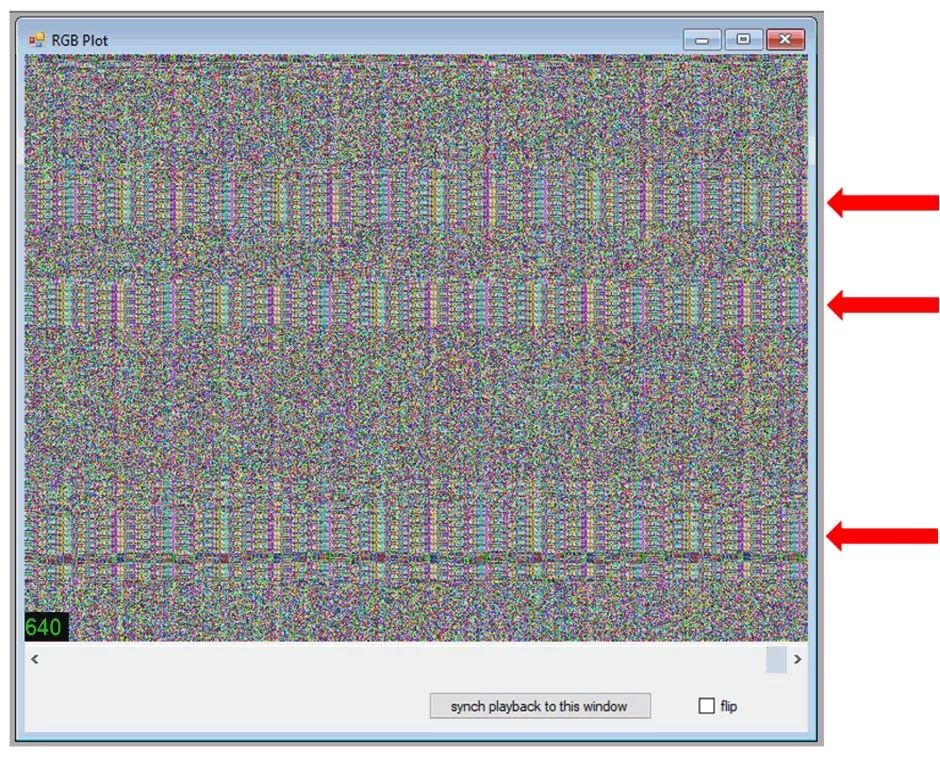
For example, the RGB-plot (although not as visually appealing as the output of binvis.io) is an effective tool for quickly checking if there are any repeating patterns or low-entropy areas in the file.
The example above analyzes a suspected encrypted firmware file from a well-known brand router. From the graph, you can quickly understand that “encryption” is not as imagined. The repeating patterns you see in the firmware file may very well be some degree of encryption, such as XOR, and the key would need further static analysis of the file to find (if you’re not lucky and encounter AES in ECB mode, decryption may be a bit difficult).
5.3 Encryption? Compression?
A certain expert wrote an article discussing the differences between encryption and compression from a mathematical perspective. Please refer to the following link:
http://www.devttys0.com/2013/06/differentiate-encryption-from-compression-using-math/
Most of the tools mentioned above are designed for firmware running on SoCs with operating systems. However, sometimes you may encounter bare-metal MCU firmware. In this case, you need to consider other strategies to understand the firmware.
If possible, please read the datasheet first. Never underestimate the value of these datasheets. When I say datasheet, I don’t mean those product sales descriptions with only 60 pages; I mean programming manuals with over 1000 pages, used in conjunction with processor core manuals.
Often, the datasheets are not publicly available and exist in hidden locations but are accessible. Sometimes, datasheets are stored on the chip manufacturer’s official website waiting for download. Here are some ways to find datasheets:
-
Google: The powerful and unmatched Google.
-
Yandex.ru: Don’t underestimate non-English search engines and forums.
-
Alibaba: A place to sell chips. Often there will be links to datasheets that cannot be found elsewhere. You can also communicate directly with the suppliers.
If you really can’t find any datasheets (which is very unlikely), you will need to identify the entry-point and the firmware loading address. You can try searching on powerful Google, some forums, source code, or other corners of the web for answers. If there is a toolchain for the target chip, there is often source code for that tool, which may guide you in the right direction.
In some desperate scenarios (where the chip manufacturer’s confidentiality measures are extremely strict and almost no usable information is disclosed), you may need to take various measures to dig out usable information and keep moving in that direction…
6. Analyzing Bare-Metal Binary Firmware with IDA
Indeed, in the area of bare-metal firmware analysis, IDA is still the most useful (and universal) disassembly tool. When discussing analyzing bare-metal binary files with IDA, it would not be excessive to write a separate article for this. However, we are only discussing the general rules for analyzing bare-metal binary files; you just need to understand the concepts of loading address and entry point.
The load address is the address in memory that the binary is being executed from. The entry point is the location within the binary where the processor starts executing.
Additionally, you need to clearly know the background information of the firmware you are analyzing. Understanding the processor core it runs on and its characteristics will greatly assist in the analysis. If you are analyzing firmware running on Cortex-M series chips, you must be familiar with infocenter.arm.com this website.
Let’s take an example. I will demonstrate using the most common ARM bare-metal binary file.
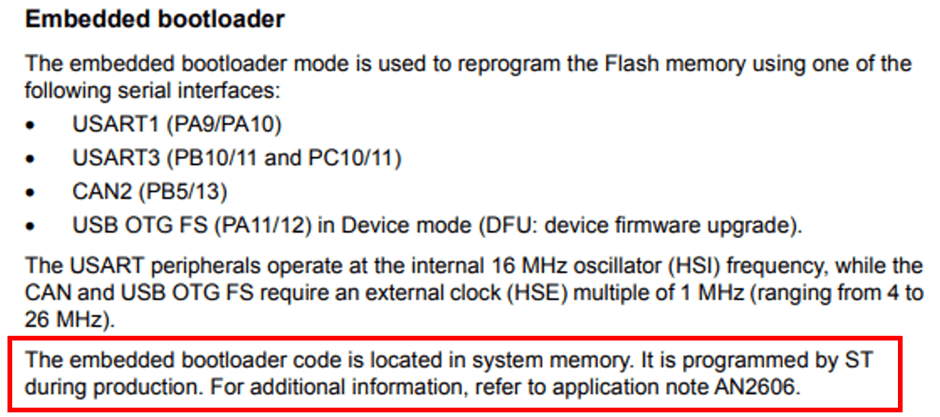
Let’s look at the bootloader of the STM32F405. We have a chip in hand that allows unrestricted access to memory and can dump anything, making it very convenient. The STM32 datasheets are publicly available online, so we used Google to find the datasheet for [ STM32F405 ].
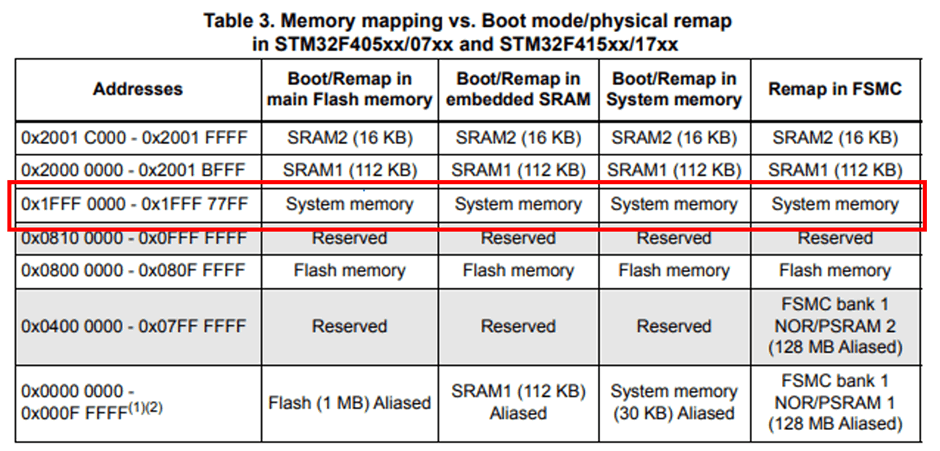
This datasheet shows that the bootloader is located in the “system memory” area. But where exactly is it?
Indeed, this table tells us that the “system memory” is at0x1fff0000.
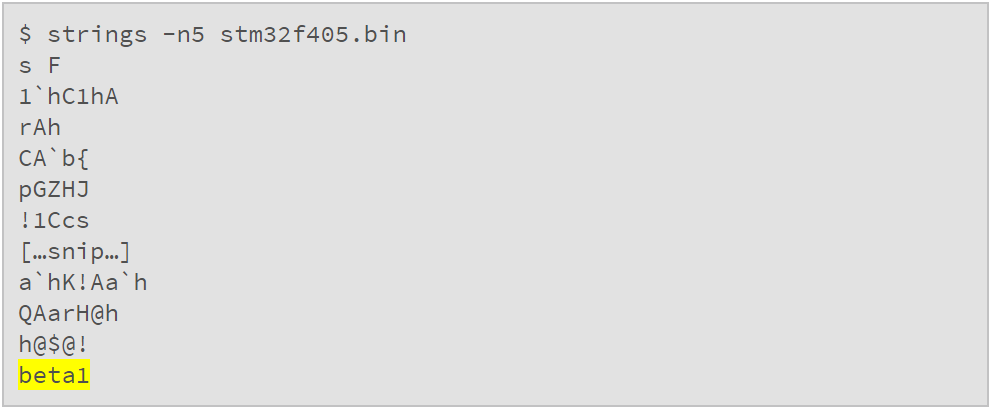
Therefore, extracting the bootloader from 0x1fff0000 to 0x1fff77ff allows us to conduct a more complete inspection. For example, we can check if it contains strings:
Most of it is meaningless garbage, but there is one meaningful string. Perhaps changing the encoding method can reveal more:
$ strings -el stm32f405.bin
@Internal Flash /0x08000000/04*016Kg,01*064Kg,07*128Kg
@OTP Memory /0x1FFF7800/01*512 e,01*016 e
@Option Bytes /0x1FFFC000/01*016 e
@Device Feature/0xFFFF0000/01*004 e
STMicroelectronics
STM32 BOOTLOADER
STM32F2STM32
"11
Indeed, quite good; there are even memory reference addresses.
We can also check the target processor architecture of the code running, whether it is big-endian or little-endian. For this, we can (again) use binwalk.
binwalk has long had a built-in opcode scanner, just add the -Y option to activate it. Now, it is not performing a magic-byte scan. Instead, it uses the Capstone engine to detect valid instructions for mainstream system architectures, collecting valid instruction sequences, architectures, and byte orders. This is a very useful method for quickly analyzing the firmware at hand, regardless of how much you previously understood about it.
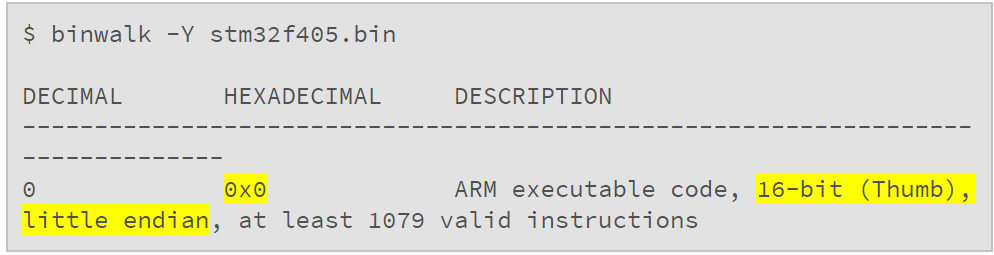
Here is binwalk analyzing the STM32F405 bootloader:
One thing must be emphasized, binwalk -Y is merely a means to detect whether the file contains valid byte sequences. It does not return other information about the firmware itself; it only determines whether valid bytecode exists.
The result indicates that from offset 0, the Capstone engine detected valid little-endian Thumb code — 1079 valid instructions, which is quite a long segment of code. Knowing this, we can then load the firmware into IDA.
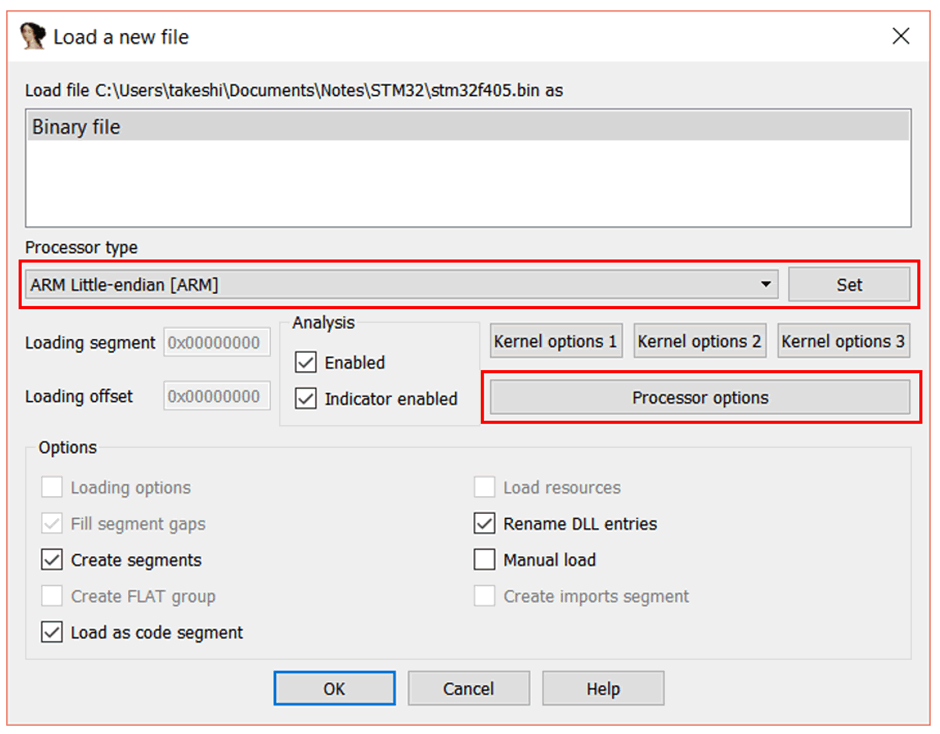
When opening the file in IDA, a pop-up window will appear. In this case, IDA cannot handle it, so we need to change the “Processor Type” to “ARM Little-endian [ARM]” and then click “Set”.
If you want to exclude ARM code (keeping only Thumb), you can set it like this:
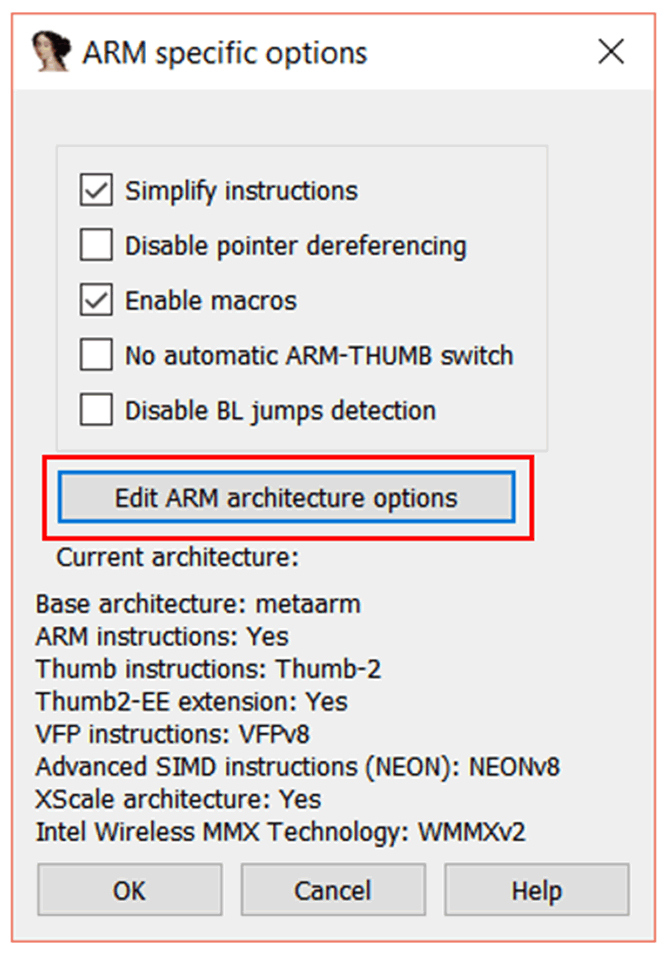
Click on “Processor options”, and you will see the “ARM specific options” window.
Click on the “Edit ARM architecture options” button.
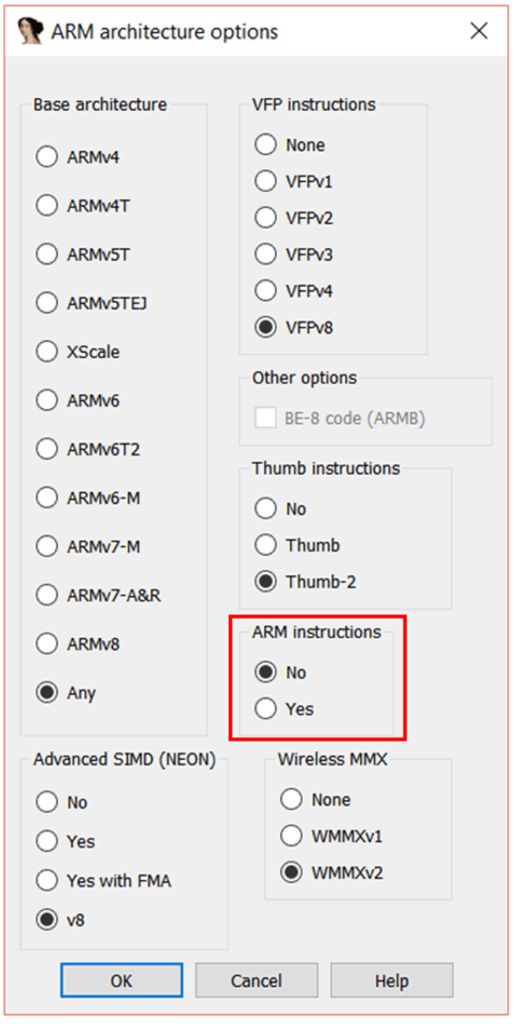
In the “ARM architecture options” window, set “ARM instructions” to “No”. Keep the Thumb instruction settings default. Click “OK”, “OK”, “OK”, and IDA will remind you again — this time to configure the memory space.
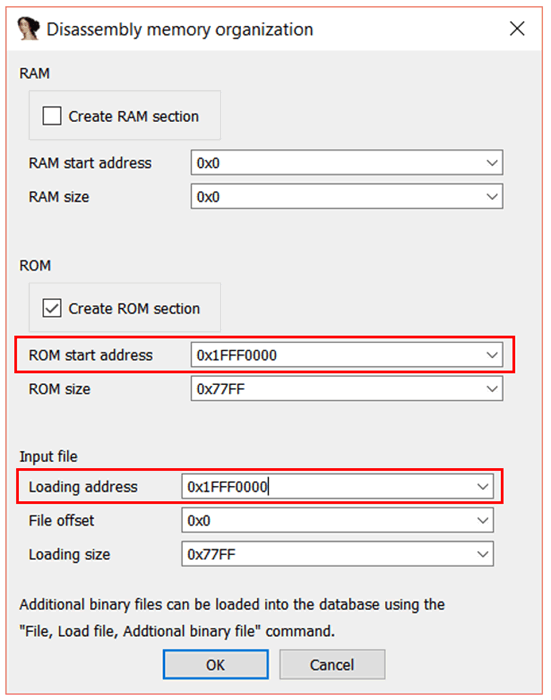
We already know that the bootloader starts at address 0x1FFF0000. Therefore, enter 0x1FFF0000 in the “ROM start address” field. Similarly, we also need to map the “Loading address” to this location, so set it to 0x1FFF0000 as well.
Click “OK”, and there may be a pop-up prompt. You can switch between ARM and Thumb using the shortcut key Alt + G. Sometimes this is a nice little trick, but it is not very intuitive, so let’s delve a little deeper.
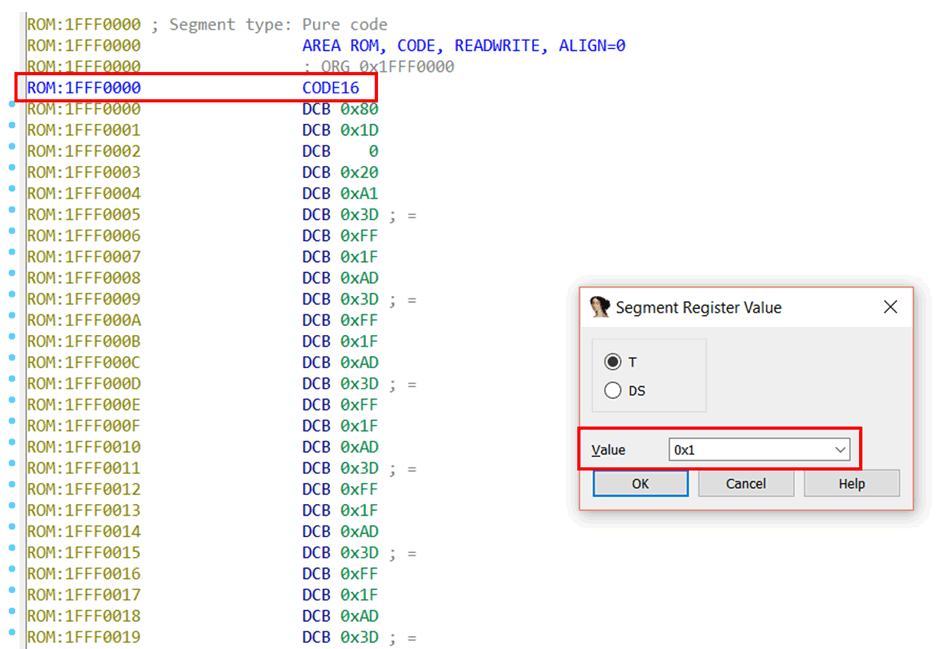
When the binary file is loaded into IDA, if you click an address (for example, here we are at 0x1FFF0000) and then press Alt+G, a “Segment Register Value” window will pop up.
![19_SegmentRegisterValue.png
The “Value” of 0x1 indicates that the code after this point (0x1FFF0000) will be considered Thumb instructions. The setting at this point reflects in the ARM processor status register as a “T” mark. A “T” mark set to 1 indicates Thumb code execution, while 0 indicates ARM code execution.
Note that the “CODE16” mark will also be added at this address. If the “T” flag is set to 0x0, ARM code is executed. In this case, CODE32 will be added at this point.
You can choose any address in the file, set its Value to 0x0, and all code after that address will be considered ARM. Since we want Thumb instructions here, we set the Value to 0x1.
7. Dude, Where is the Entry Point?
OK IDA, let’s sort this out.
We can determine the entry point through the [ interrupt vector table ]. We just need to know which entry in the vector table is the Reset vector, as the reset vector is our entry point. Yes, you guessed it, the reset vector is the address where the CPU starts executing code after a machine restart.
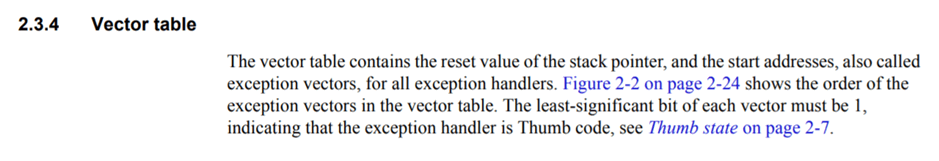
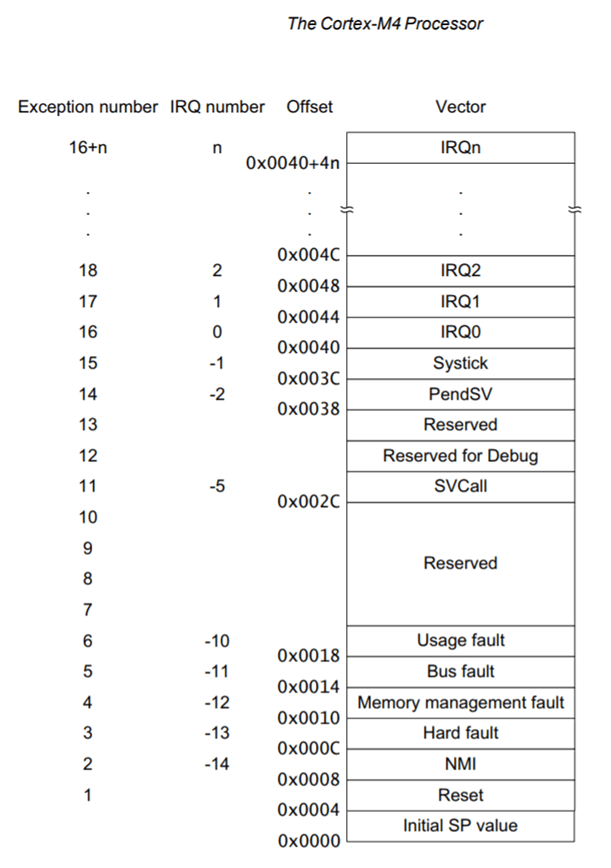
This STM32F405 has a Cortex-M4 core, so we can Google the vector table for Cortex-M4. In the [ Cortex-M4 Device Generic User Guide ], we find this:
This is quite interesting, let’s remember this for now. Additionally, there is this:
This table indicates that the initial position of the stack pointer is at offset 0x0, the reset vector is at offset 0x4, and the pointer at offset 0x8 is for Non-Maskable Interrupt, etc. The interrupt vector is the address where the processor starts executing code after startup.
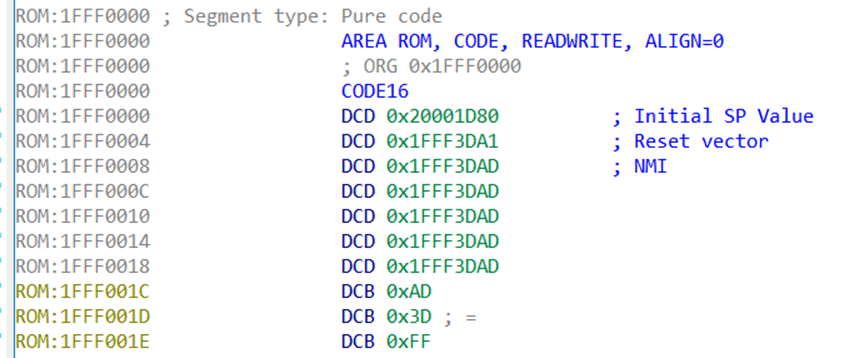
In IDA, we can define the data at addresses 0x0, 0x4, and 0x8 as “double word” (i.e., 32 bits wide). Right-click on the byte at address 0x1FFF0000 and select “Double word”, and do the same for 0x1FFF0004.
Let’s look at the following figure. I added some annotations, making it clearer. The offset at 0x0 is the initial stack pointer, pointing to a section of memory in SRAM (as learned from the datasheet), so this makes sense.
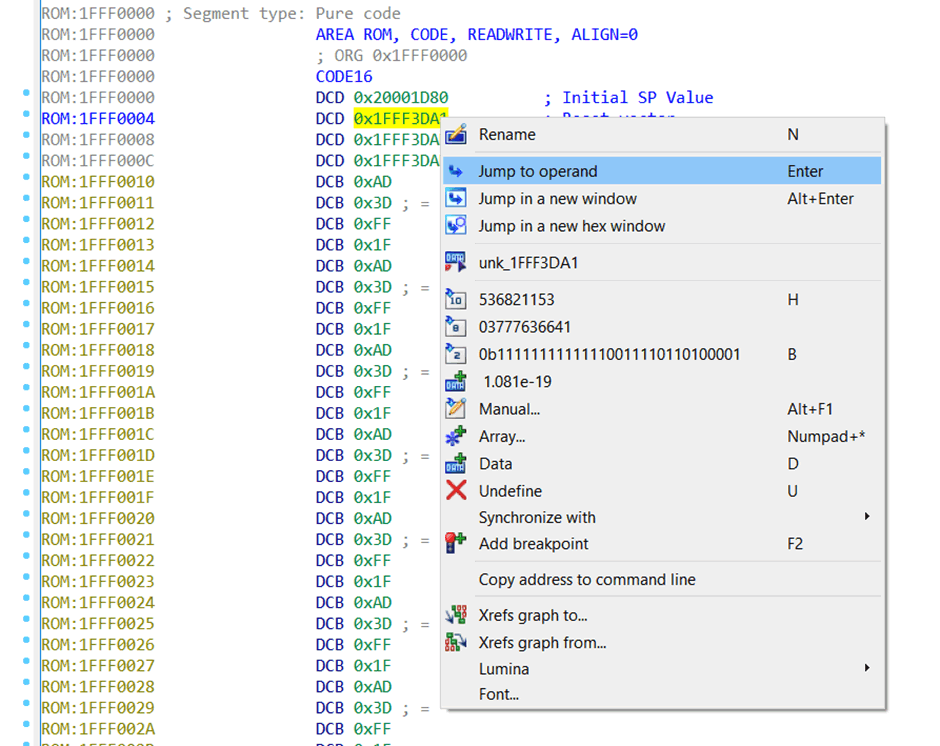
The reset vector, 0x1FFF3DA1, is also reasonable. Let’s jump to this location and check. You can highlight it and then press the “Enter” key, or select “Jump to operand”.
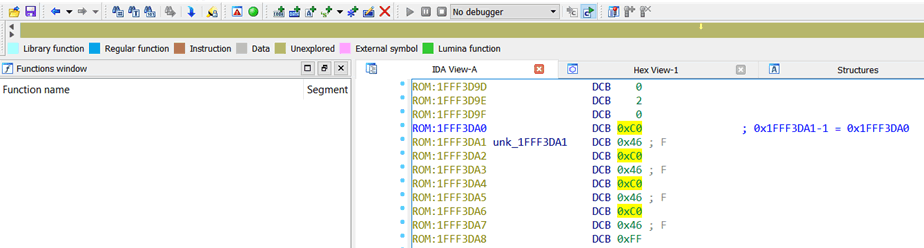
However, remember what was said in the Cortex-M4 manual! In Thumb mode, the least significant bit of the reset vector has been incremented by 1. Therefore, the actual reset vector is (Reset vector – 1).
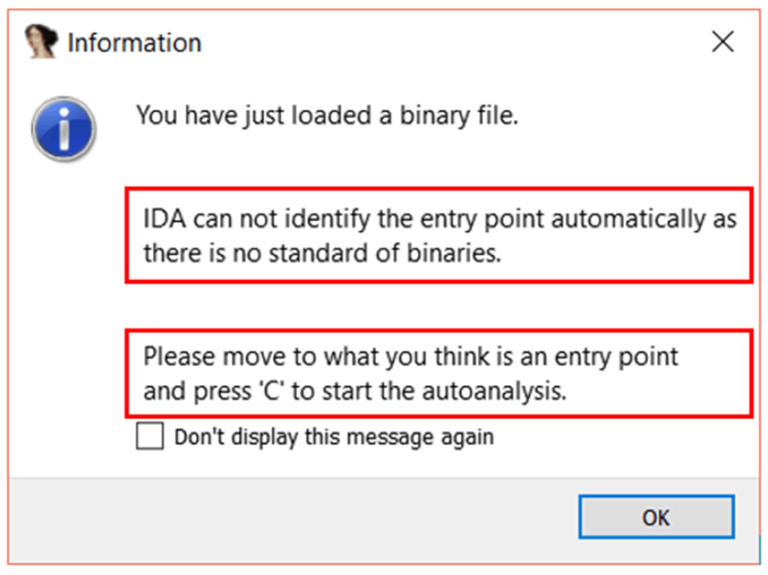
Notice the brown bar at the top of IDA — this indicates that so far, no content of the file has been parsed. We will change that.
Select the address of the Reset vector, subtract 1, and press “C”; IDA will start disassembling.
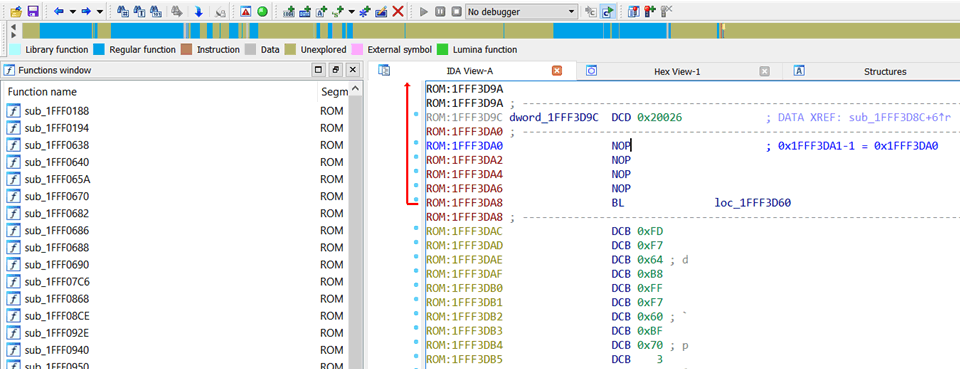
Well, it looks interesting. Many subroutines are defined, so the blue part on the status bar gradually increases. Following these unique pointers in the vector table will reveal more blue.
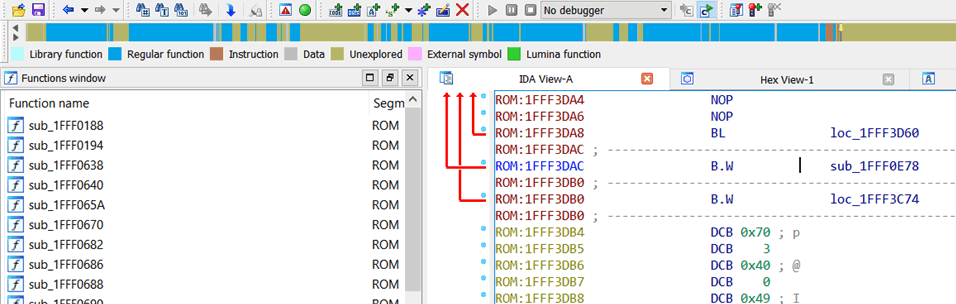
From here, you can start exploring the complex workings of the firmware.
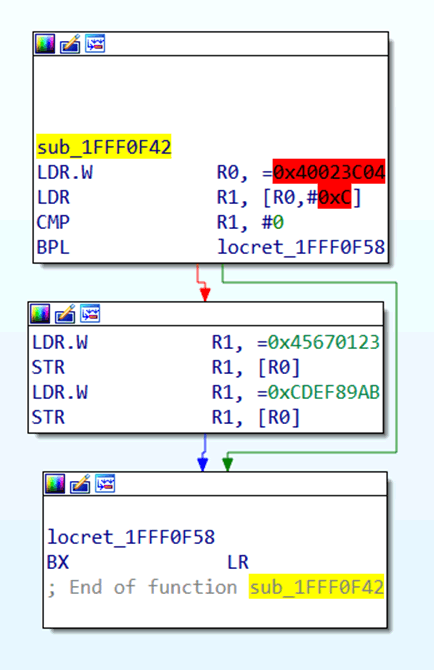
Pokey-pokey. Let’s quickly look at this subroutine to help everyone get started faster. In this routine, you can see the value 0x40023C04 being loaded into the R0 register, and then the values 0x45670123 and 0xCDEF89AB are sequentially written to memory at address 0x40023C04.
The memory addresses highlighted in red are the addresses to be accessed and have not been mapped to the IDA file. Therefore, the content at memory 0x40023C04 has not been mapped to the current IDA file. We actually do not need to map it, but you might want to check what this address does in the datasheet.
By browsing the STM32F4 datasheet, we can learn that 0x40023C04 is located in the memory segment of the Flash interface register:
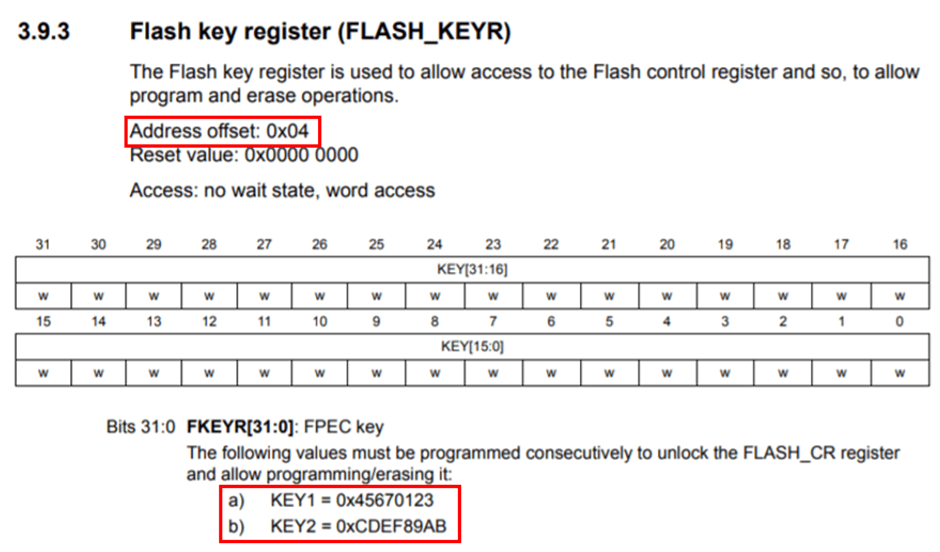
Moreover, offset 0x4 from the base address 0x40023C00 corresponds to the Flash key register (FLASH_KEYR).
Look, the datasheet lists the values 0x45670123 and 0xCDEF89AB — these are the two values that unlock the Flash controller’s register. So, that’s what this subroutine accomplishes.
Remember to have the datasheet handy for quick reference; it is very useful.
Somewhere on the internet, there are IDA Scripts to assist in embedded firmware analysis with IDA. The IDA Python Embedded Toolkit is a well-known set of tools that can reduce the difficulty of reverse engineering bare-metal firmware. However, in general, searching online for specific chip model-related information often does not disappoint, saving a lot of time. Many specific (targeted) codes available online will help reverse engineer elusive chip firmware.
There is more than one way to solve a problem. Always pay attention to the context of the firmware you are analyzing. Don’t expect binwalk to solve everything. Be cautious of your doubts; consider switching search engines. Try to learn a bit of Russian and Chinese. Get used to spending hours carefully studying these hexadecimal bytes, and in the end, you will find it all worthwhile.
Kx ID:StrokMitream
https://bbs.pediy.com/user-747320.htm
* This article is translated by the Kx translation team StrokMitream.
Original link: How To Do Firmware Analysis. Tools, Tips, and Tricks
* Some summaries on getting started with PWN
* Firmware Analysis: Tools, Methods, and Techniques (Part 1)
* A method to restore white-box AES keys
* Some attack ideas for RSA in CTF
* Classic integer overflow vulnerability example XCTF int_overflow
A must-read book in the advanced security circle