AirMOSS: L2 Hourly In-Ground Soil Moisture at AirMOSS Sites, 2011-2015
The ground sensors (L2) hourly volume (cm³/cm³) soil moisture profile from seven sites in North America.
Introduction
This dataset provides Level 2 (L2) hourly volume (cm³/cm³) soil moisture profiles collected from ground sensors at seven sites in North America, as part of the Airborne Subcanopy and Subsurface Microwave Observatory (AirMOSS) project. Each site has three profiles, with samples taken at seven different depths (2 cm to 80 cm). Initial sampling began in September 2011 at three locations, with additional sites added in 2012 and 2013. All sampling was completed by December 2015. The AirMOSS project uses airborne radar instruments to estimate soil moisture in the root zone at ten research sites in North America. The collection of these ground soil moisture data is intended to calibrate and validate AirMOSS data. This dataset consists of 29 NetCDF v4 (*.nc4) format files.
Abstract
AirMOSS is a geoscience research project, fully known as the “Airborne Microwave Observatory of Subcanopy and Subsurface.” The project was conducted from 2011 to 2015, aiming to utilize airborne microwave radar technology to measure underground soil moisture.
The AirMOSS project utilized NASA’s C-20A aircraft, which was equipped with a microwave radar called “L-band Synthetic Aperture Radar” (SAR). This radar emits and receives L-band (1-2 GHz) microwave signals, inferring soil moisture by measuring the reflection and scattering of the signals. This technology is advantageous for its strong penetration capability and minimal impact on surface vegetation.
This dataset contains underground soil moisture data collected by the AirMOSS project at various observation points from 2011 to 2015. These data are recorded at hourly intervals, providing insights into soil moisture variations at depths ranging from 0 to 100 cm. This data can help scientists understand the spatial and temporal distribution characteristics of soil moisture, as well as the relationship between soil moisture, surface vegetation, and climate change.
The AirMOSS data are significant for research in areas such as groundwater cycling, soil moisture management, climate change, and ecosystem modeling. Additionally, these data can be used to improve the accuracy of meteorological and hydrological models, providing more precise soil moisture monitoring and forecasting capabilities.
Code
!pip install leafmap
!pip install pandas
!pip install folium
!pip install matplotlib
!pip install mapclassify

import pandas as pd
import leafmap

url = "https://github.com/opengeos/NASA-Earth-Data/raw/main/nasa_earth_data.tsv"
df = pd.read_csv(url, sep="\t")
df

leafmap.nasa_data_login()


results, gdf = leafmap.nasa_data_search(
    short_name="ABoVE_ASCENDS_XCO2_2050",
    cloud_hosted=True,
    bounding_box=(-165.68, 34.59, -98.1, 71.28),
    temporal=("2017-07-20", "2017-08-08"),
    count=-1,  # use -1 to return all datasets
    return_gdf=True,
)


gdf.explore()

#leafmap.nasa_data_download(results[:5], out_dir="data")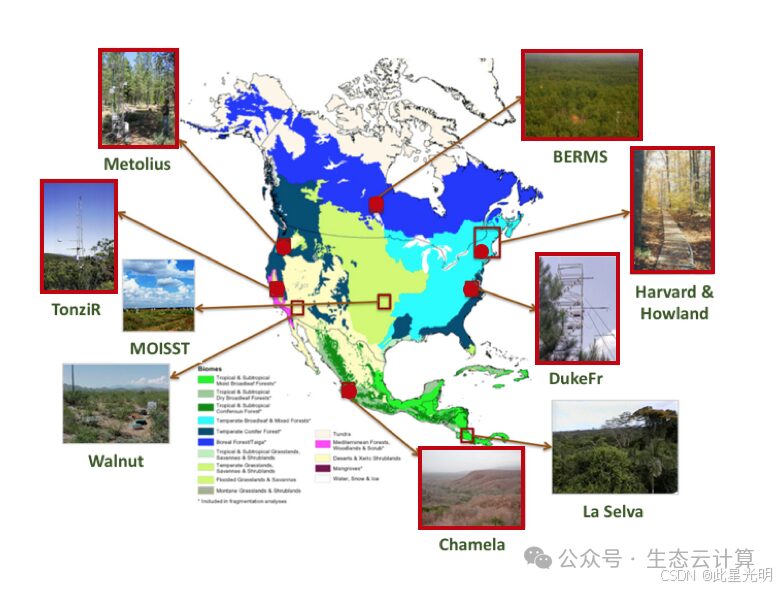
Citation
Hagimoto, Y., R. Cuenca, and AirMOSS Science Team. 2016. AirMOSS: L2 Hourly In-Ground Soil Moisture at AirMOSS Sites, 2011-2015. ORNL DAAC, Oak Ridge, Tennessee, USA. AirMOSS: L2 Hourly In-Ground Soil Moisture at AirMOSS Sites, 2011-2015, https://doi.org/10.3334/ORNLDAAC/1416
Recommended Links
Knowledge Planet
Knowledge Planet | Deeply connect core fans, operate high-quality communities, and tools for knowledge monetization (zsxq.com) https://wx.zsxq.com/group/48888525452428
Machine Learning
https://www.cbedai.net/xg
Drought Monitoring Platform
Huitian Drought Monitoring and Early Warning – Homepage https://www.htdrought.com/