Address丨https://blog.csdn.net/u013872857/article/details/109045686
Android Studio 4.1 has been released, fixing a total of 2370 bugs and 275 issues. The main new features include:
-
Material Design component library updates
-
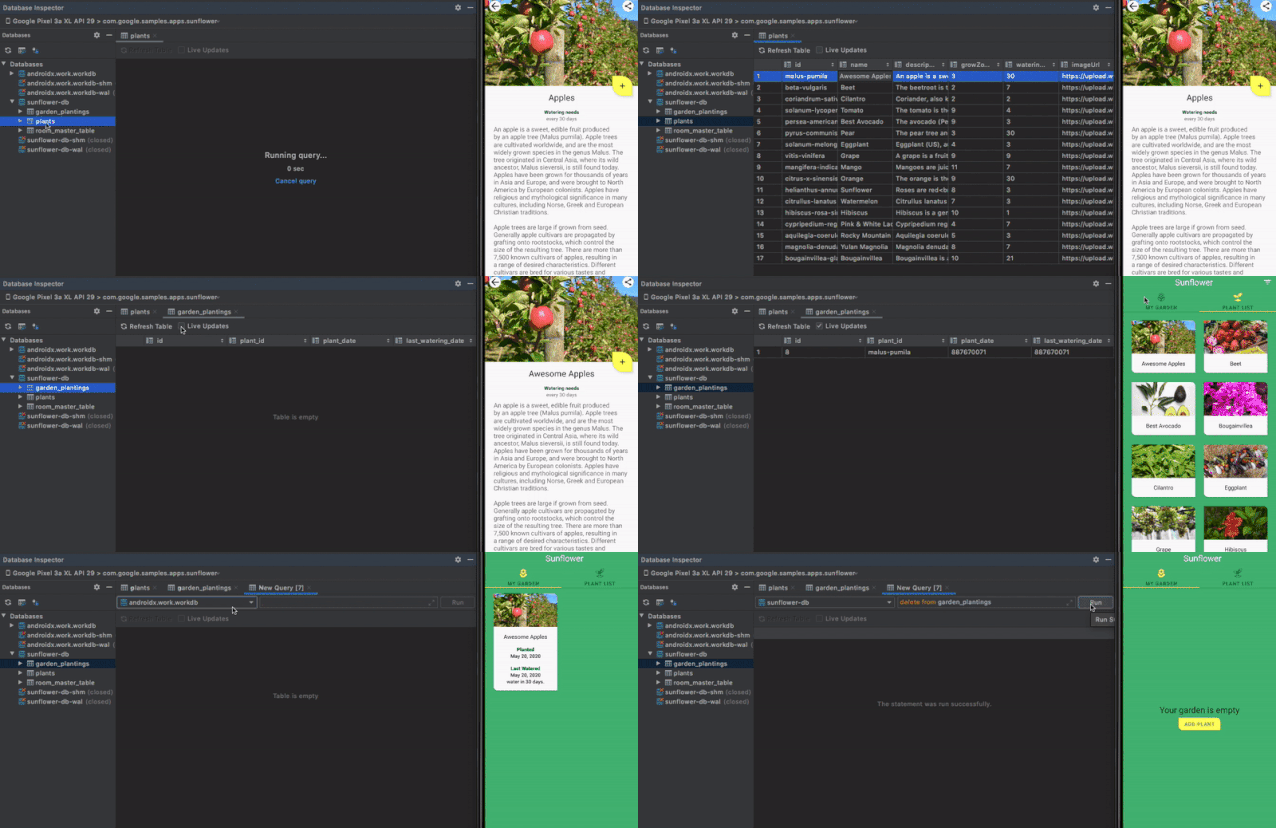
Database Inspector feature
-
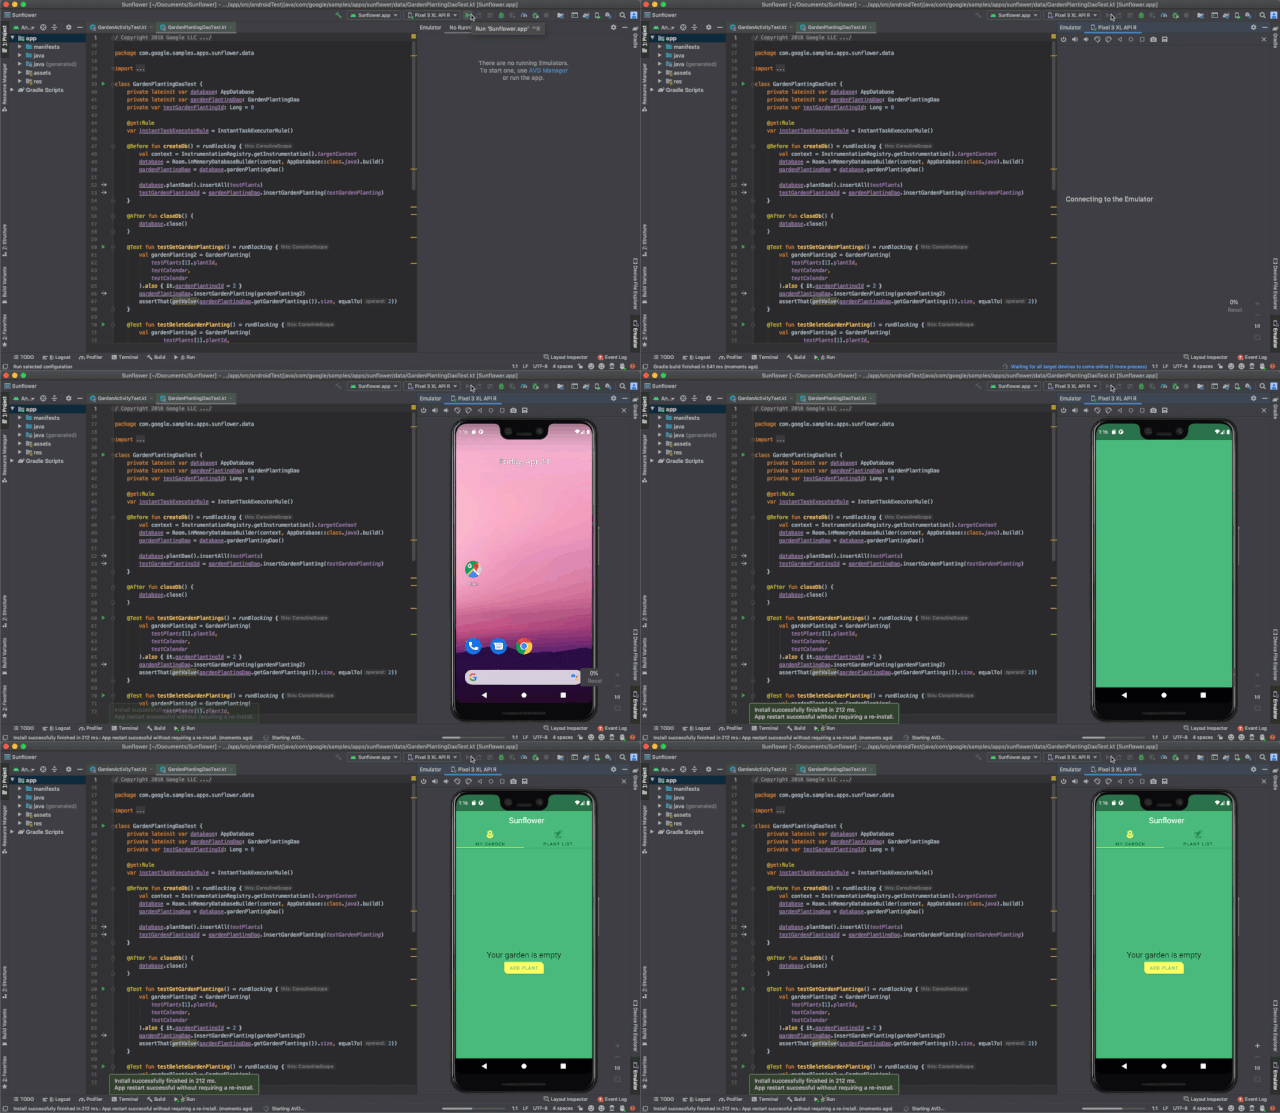
Run the emulator directly in Android Studio
-
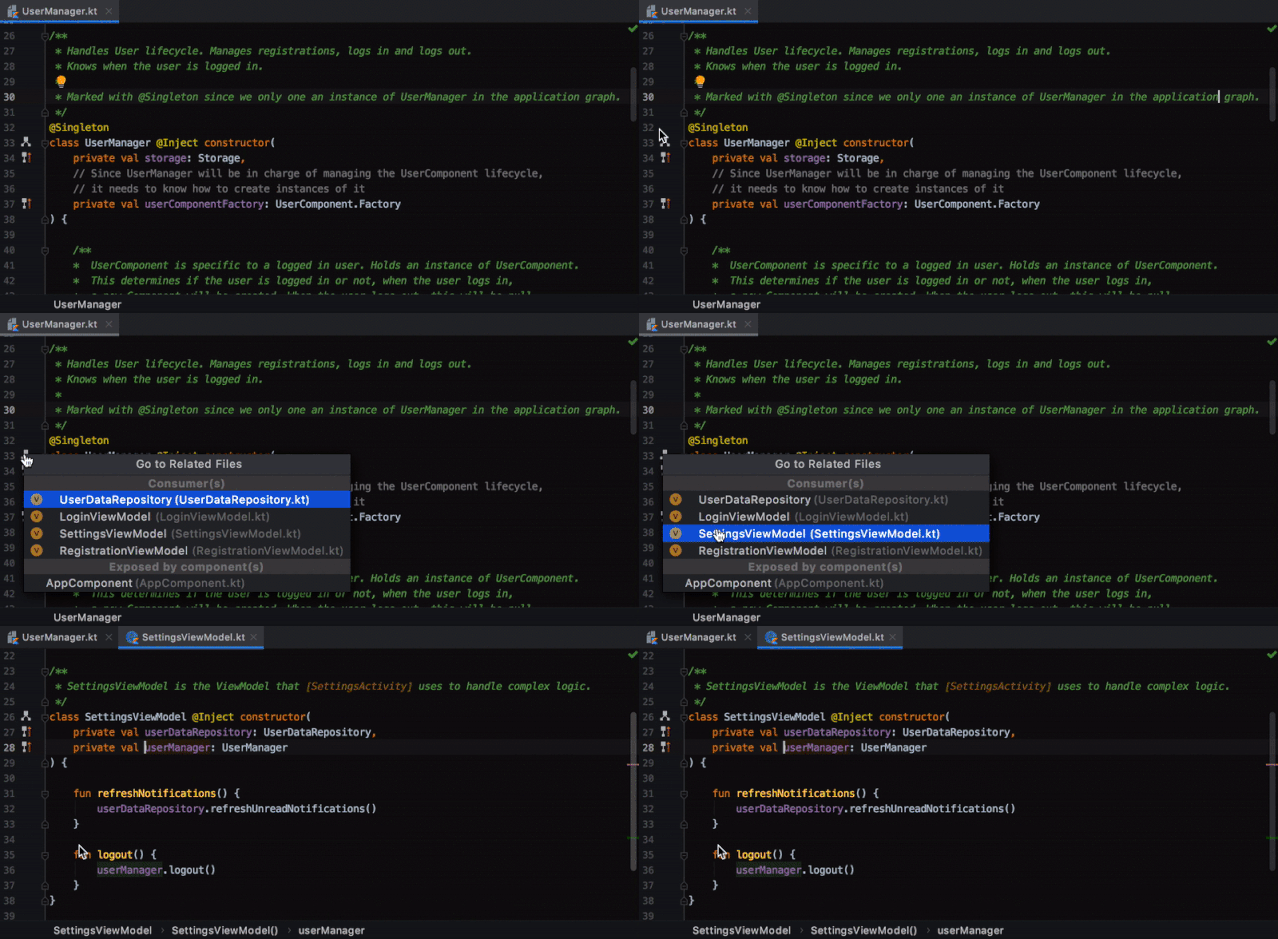
Dagger navigation support
-
Use TensorFlow Lite models
-
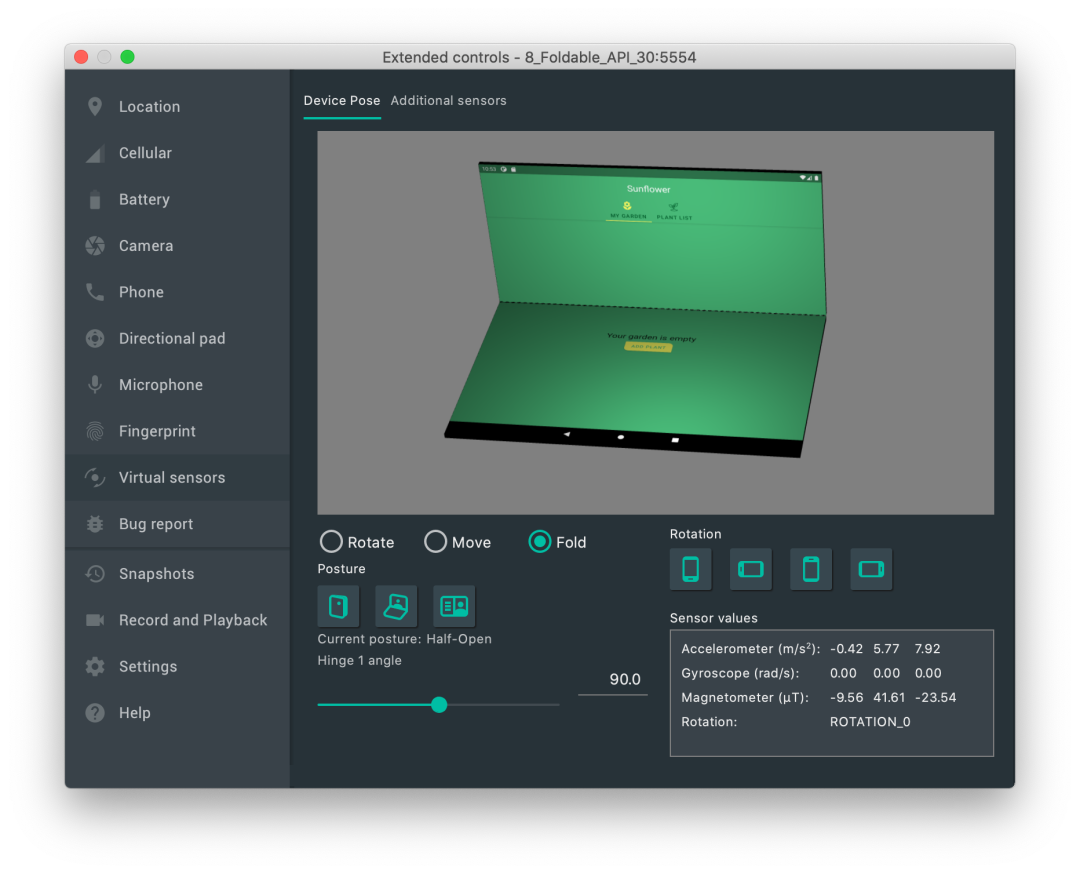
Android emulator supports foldable screens
-
Apply Changes updates
-
Export dependencies from AAR in C/C++
-
Native crash reporting symbolization
The Database Inspector feature allows for easier viewing of the application’s database. First, ensure the application is running API >= 26, then select View -> Tool Windows -> Database Inspector to view or modify the database.

Run Emulator Directly in Android Studio
Previously, the emulator had to run in a separate window; now it can run directly in Android Studio. This feature can be enabled in Files->Setting->Tools->Emulator.

Dagger Navigation Support
Dagger is a popular dependency injection library for Android, and AS provides a Find Usages feature to make navigating Dagger-related code easier.

Android Emulator Supports Foldable Screens
In addition to the recently added 5G cellular testing, support for foldable devices has also been added to the Android emulator. This feature will be supported in emulator versions 30.0.26 and above.

Export Dependencies from AAR in C/C++
The Android Gradle Plugin 4.0 added the ability to import Prefab in AAR dependencies. Now, the AGP 4.1 version enables the ability to export dependencies from AAR. To export native libraries, add the following code to your module’s<span>build.gradle</span>file:
buildFeatures {    prefabPublishing true}
prefab {    mylibrary {      headers "src/main/cpp/mylibrary/include"    }
    myotherlibrary {        headers "src/main/cpp/myotherlibrary/include"    }}
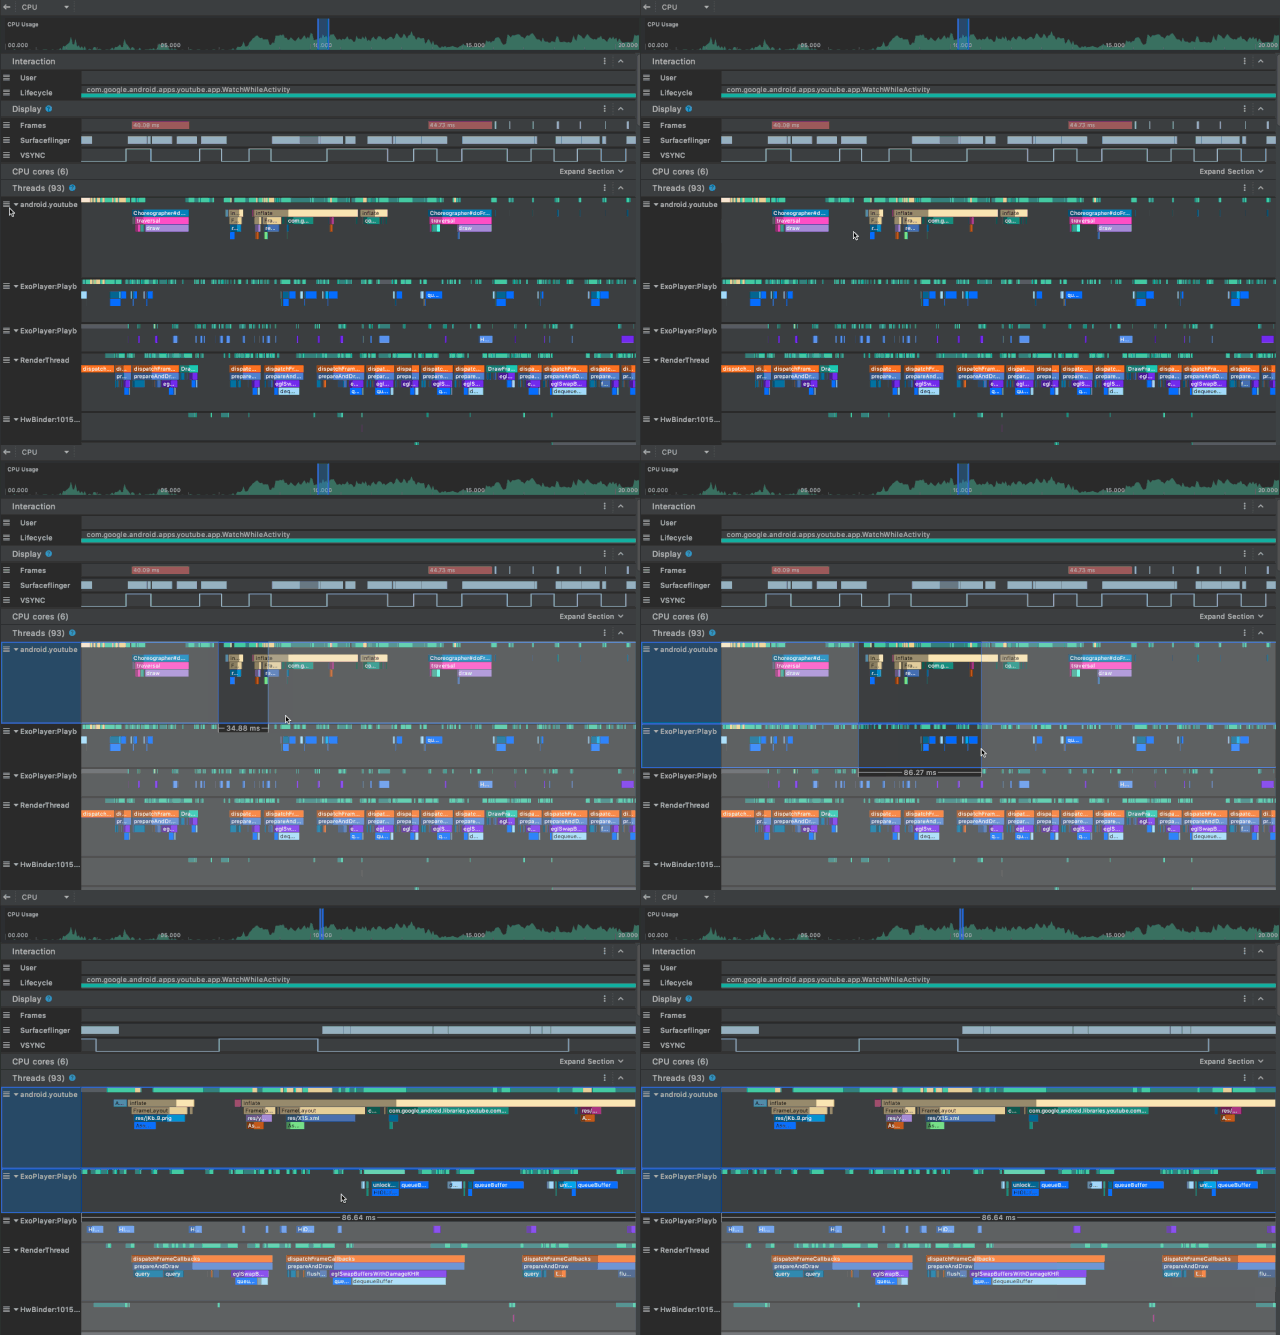
Use the selection box to more easily choose traces:

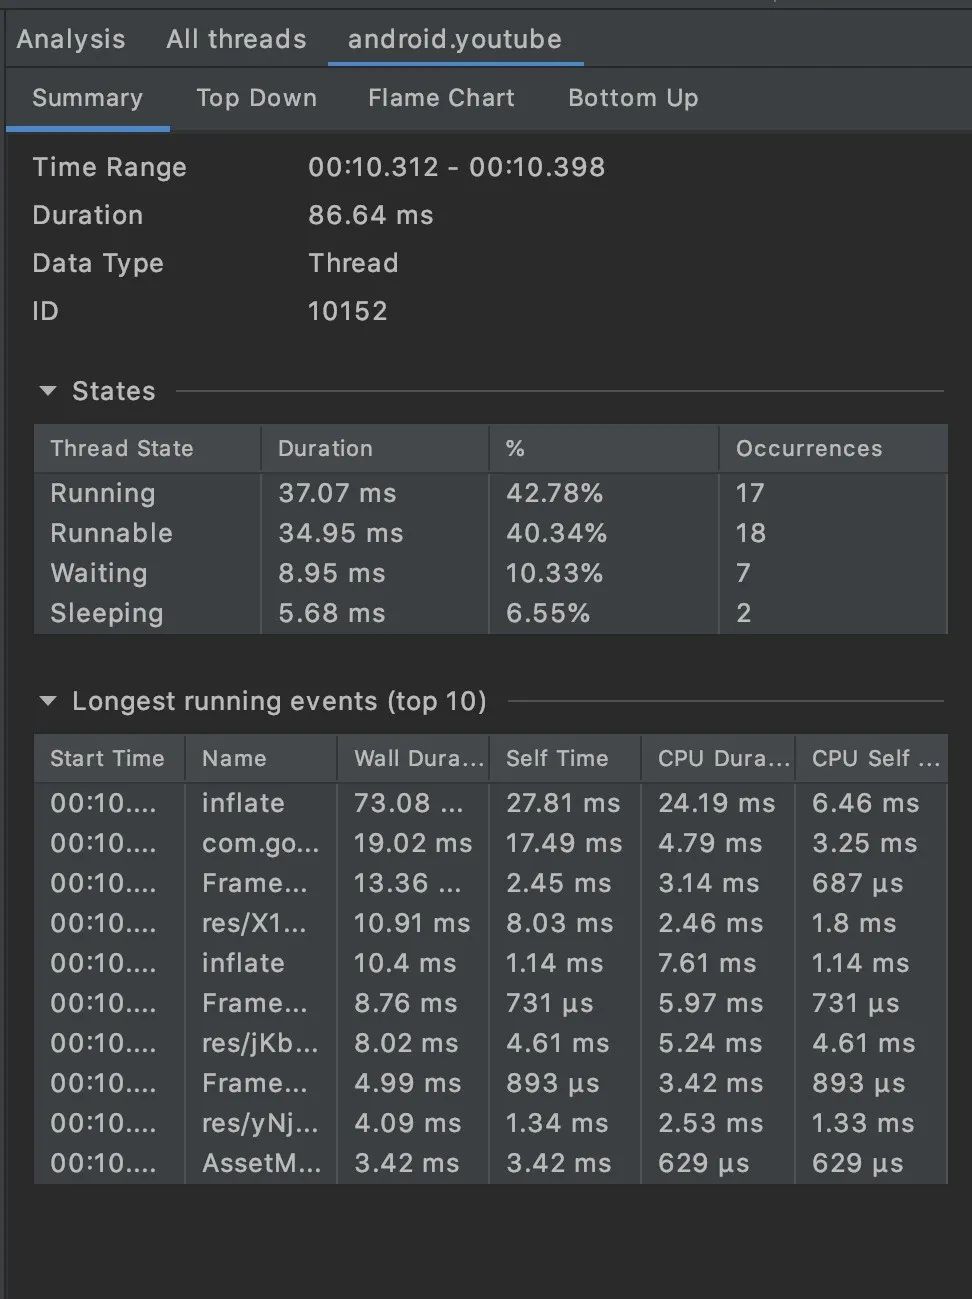
Summary tab: The new summary tab in the analysis panel shows:
-
Statistics summarizing all occurrences of specific events, such as occurrence counts and minimum/maximum durations.
-
Event statistics for selected events.
-
Data on thread state distribution.
-
The longest-running events for the selected trace events.

Android Studio Profilers can now be used independently of Android Studio. Before running, ensure that no other profilers are running on the system.
Windows/Linux:<span><studio-installation-folder>\bin</span>macOS:<span><studio-installation-folder>/Contents/bin</span>
Then run profiler.exe or profiler.sh.
The Android Studio Memory Profiler now includes a Native Memory Profiler for deploying applications to physical devices running Android 10 or higher. Start recording by clicking Record native allocations.
