STM32CubeMonitor not only provides variable monitoring capabilities but also offers a rich set of components to build various styles of graphical interfaces, along with numerous free third-party components for functional expansion. Additionally, STM32CubeMonitor supports remote monitoring functionality.
STM32CubeMonitor is a variable monitoring and visualization tool that connects to the target MCU via the ST-LINK’s SWD or JTAG interface, allowing the reading of variable values without interrupting the program’s full-speed operation. It is particularly suitable for debugging scenarios where the program needs to run at full speed, complementing traditional debugging methods that rely on setting breakpoints.
STM32CubeMonitor is developed based on NODE-RED, featuring a wealth of graphical development components that enable the creation of flexible and varied visual graphical interfaces.
As an open-source visual interface development tool, NODE-RED has an active developer community with numerous new nodes developed by various developers. STM32CubeMonitor supports importing these third-party nodes to continuously expand its functionality.
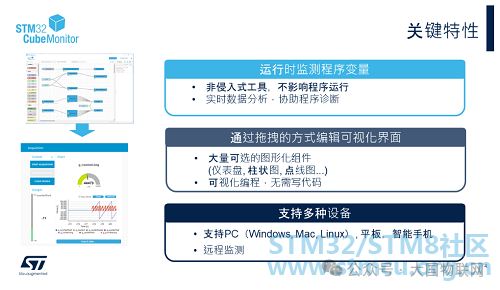
STM32CubeMonitor can detect program variables in a non-intrusive manner (Direct mode), analyzing collected data in real-time to assist in program diagnostics. Besides Direct mode, the Snapshot mode allows for more precise sampling by adding specific sampling code to the application. Variables can be imported based on the executable file or manually added according to their addresses, and various post-processing operations can be performed on the collected variables, including setting sampling trigger conditions.
STM32CubeMonitor employs a graphical programming interface, allowing the entire programming process to be completed through drag-and-drop, eliminating the need to write code. A large number of graphical components (dashboards, bar charts, line graphs, etc.) are available.
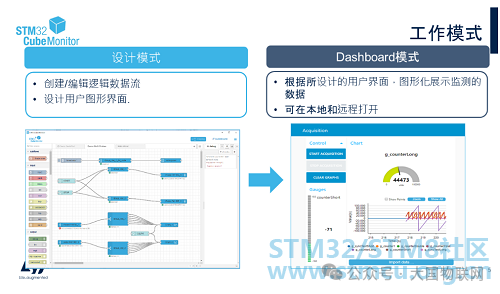 STM32CubeMonitor has two operating modes: Design mode and Dashboard mode. The Design mode is the editing mode, and STM32CubeMonitor opens in this mode by default. In Design mode, the leftmost column lists all currently available nodes, allowing us to create or edit different logical data flows (Flows) by dragging different nodes to achieve the desired functionality. For example, we can display the variables to be monitored in real-time using a line graph or control the state of a GPIO pin with a button. The rightmost column in Design mode shows the usage instructions for the currently selected node and debugging information about the program’s operation.
Once all nodes are edited and deployed, we can enter Dashboard mode by clicking the DASHBOARD button in the upper right corner. In Dashboard mode, we can see the results of the “flow” edited in Design mode, view the interface we designed earlier, and monitor or control the variable values through this interface.
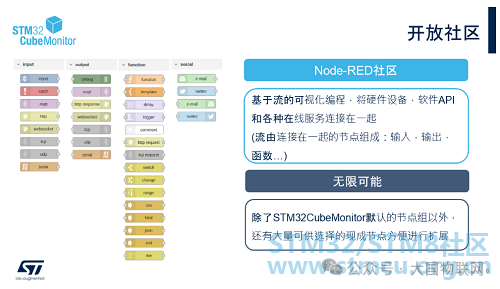
STM32CubeMonitor is based on Node-RED, which is a flow-based development tool. So what is a “flow”? Node-RED provides many functional nodes, which can be categorized into input nodes, output nodes, and function nodes. Connecting these nodes together forms a “flow”. The combination of multiple “flows” is also referred to as a “flow”. For example, the label page in Design mode is also called a “flow”, which actually contains multiple individual “flows” with different functionalities.
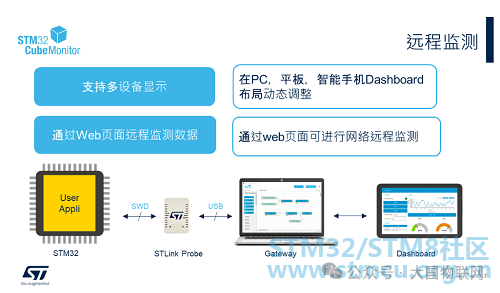
The above image illustrates the connection diagram for remote monitoring using STM32CubeMonitor. As mentioned earlier, the STM32 development board is connected to the local computer via ST-LINK, and STM32CubeMonitor can run on the local computer (Host PC). It can also be accessed from other computers, tablets, or smartphones via a browser by entering the host PC’s IP address (port number 1880) to open the STM32CubeMonitor interface for editing or viewing the Dashboard (provided they are on the same local area network).
Practical Operation
Having gained a basic understanding of STM32CubeMonitor, we will now move on to the practical operation section.
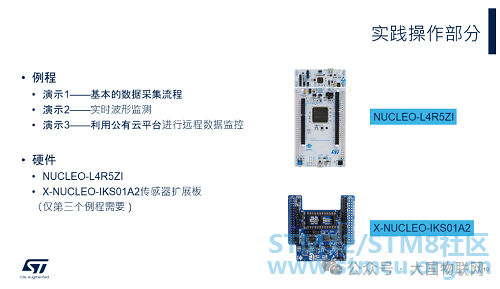
In this section, we will introduce the use of different functions of STM32CubeMonitor through three examples: “Basic Data Collection Process”, “Real-time Waveform Monitoring”, and “Remote Data Monitoring Using Public Cloud Platforms”. This course provides the MCU and CubeMonitor programs corresponding to the three examples, using the Nucleo-L4R5ZI development board and the X-NUCLEO-IKS01A2 sensor expansion board (used only in the third example). You can also use other STM32 development boards and implement the corresponding MCU functions according to the instructions for each example.
Basic Data Collection
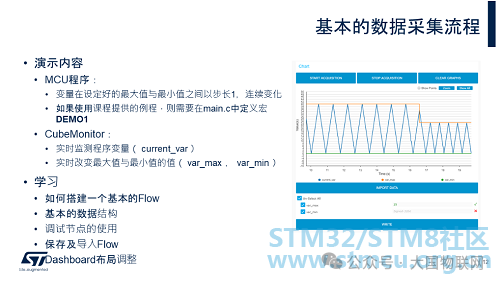
In the first example, a global variable (current_var) is defined in the MCU program, which continuously changes between a set maximum value (var_max) and minimum value (var_min) with a step of 1. We will use CubeMonitor to monitor these three variables in real-time and also change the limits of the maximum and minimum values in real-time.
Through this example, we will learn:
• How to build a basic “flow”
• Understand the basic data structure of messages passed between “flow” nodes
• The use of debugging nodes
• How to save and import “flows”
• How to adjust the Dashboard layout
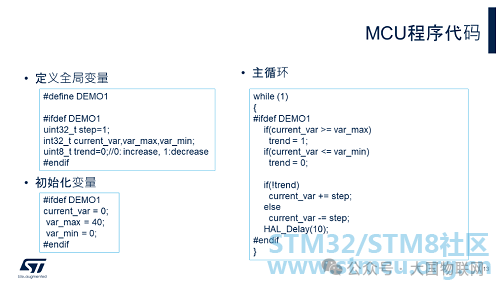
Here is the MCU-related code implementation for the example. Copy it into any existing project, recompile, and flash it.
Among them, the variables current_var, var_max, and var_min are the variables we want to monitor.
Next, let’s see how to configure CubeMonitor.
CubeMonitor Configuration
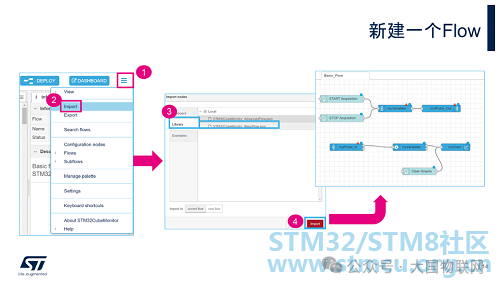
When you first open CubeMonitor, a “flow” is opened by default. You can develop based on this “flow” or go to the menu import>Library, select “STM32CubeMonitor_BasicFlow.json”, and then click the “import” button to import a new Basic flow. At this point, a new tab named “Basic_Flow” will appear in Design mode. This tab is also referred to as a “flow”.
In the Library, there are two types of flows to choose from: BasicFlow and AdvancedFlow. You can think of them as two flow templates that STM32CubeMonitor has already prepared to facilitate getting started. BasicFlow has only one tab, which has already implemented the basic functionality of starting/stopping sampling and displaying the results on a line graph. You only need to update the parameters of the nodes within it. AdvancedFlow includes two tabs: one tab contains flows related to STM32 nodes (such as setting variable addresses, reading variable values and processing them, outputting to charts, etc.); the other tab contains user interface buttons. The nodes in the two tabs are connected through Link in and Link out nodes. In AdvancedFlow, you can also connect two ST-LINKs simultaneously to monitor the operation of two STM32 development boards.
Returning to BasicFlow, the entire BasicFlow consists of two flows: the upper flow consists of two button nodes (Start, Stop), a variables node, and an acq_out node. The functionality of this flow is to set the address of the variable to be monitored and add two buttons (Start, Stop) on the Dashboard to start and stop sampling. The lower flow consists of an acq_in node, a processing node, a button node, and a chart node. The acq_in node receives data sent from ST-LINK, the processing node receives messages from acq_in, and sends the selected variable data to the chart node for display. The Clear button is used to clear the display of the chart.
Next, we will explain how to configure each node in BasicFlow.
Node Configuration
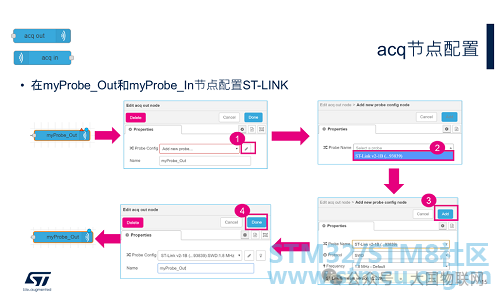
First, let’s take a look at the myProbe_Out and myProbe_In nodes. These two nodes belong to the STMicroelectronics node group, specifically acq_out and acq_in. All nodes in STM32CubeMonitor can be renamed to other more meaningful names to help us understand the role of each node. The acq_out node is used to define or select an ST-LINK configuration (communication protocol, frequency, etc.), open or close the connection, and send commands to the selected ST-LINK. The acq_in node is used to define or select an ST-LINK configuration and receive data sent from ST-LINK.
Before configuring these two nodes, we will notice a red triangle and a blue dot in the upper right corner of each node. The red triangle indicates that the node has not yet been configured, while the blue dot indicates that the node has been updated but not yet deployed.
Before configuring these two nodes, connect the ST-LINK to the PC. Then follow the steps in the image to configure:
1. Double-click the node to open the editing window, and click the “ProbeConfig” edit button.
2. Select the available ST-LINK from the drop-down menu (if no ST-LINK is connected, you will see “No results found”).
3. Click Add to add the ST-LINK.
4. Click Done to complete the configuration, and the editing window will close automatically.
At this point, the red triangle in the upper right corner of the node disappears, while the blue dot remains, indicating that the current node has been configured but not yet deployed.
Use the same method to complete the configuration of the myProbe_Out and myProbe_In nodes.
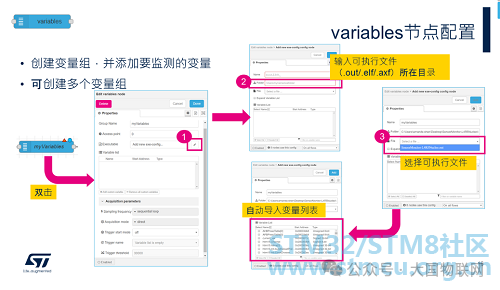
Next, configure the variables node to add the variables to be monitored. Sometimes we need to send different variables to different display components, or some variables require more precise sampling and need to be configured in different sampling modes. For the convenience of subsequent processing, we can place multiple variables nodes in one flow to group the variables. In the current example, we only used one variables node (myVariables).
Double-click myVariables to open the editing window and follow the steps in the image to configure:
1. Click the edit button.
2. Add the directory of the executable file (simply copy the path).
3. In the drop-down menu for the File item, select the executable file, and CubeMonitor will automatically analyze and import the list of all global variables.
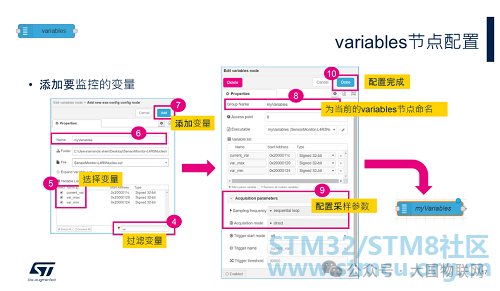
4. There are many variables listed in the variable list; you can use a filter to filter out the variables you want to monitor by keyword. For example, if we input “var”, the list will only show the three variables we want to monitor.
5. Click the box in front of the variables to select these three variables.
6. Give the current configuration a name, which represents the current selected variable combination. This name can be used to select the configured variable combination in all variables nodes.
7. Click Add to add the variables.
8. Name the current variables group, which can be selected by name in the processing node later (as described in subsequent sections).
9. After adding the variables, you also need to configure the sampling parameters for the variables (sampling mode and sampling speed, as well as whether there is a sampling trigger). The sampling speed is generally set to “sequential loop”, under which CubeMonitor will sample at the fastest speed. Alternatively, you can set your own sampling frequency. There are two sampling modes: Direct and Snapshot. The Direct mode is non-intrusive, reading the values from memory via JTAG or SWD protocol without needing to add any code to the MCU program. The Snapshot mode requires adding specific code to the MCU program, which samples at intervals and stores the results in the MCU’s memory, which CubeMonitor periodically reads. The Snapshot mode can provide more precise sampling. In the current example, we can use the Direct mode. We will further introduce the Snapshot mode in the second example.
10. Finally, click Done to complete the configuration.
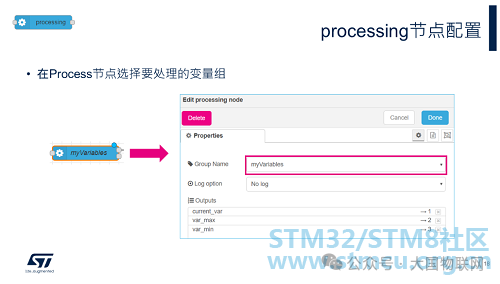
The processing node’s input connects to the acq_in node, receiving data sent from ST-LINK, and combining the data by different variables, outputting once every 50ms. For example, if three variables are to be monitored, the processing node will output three messages every 50ms, containing the sampled data for these three variables during that time, which could be one or multiple, depending on the set sampling speed. The output of the processing node is directly connected to the chart node for display.
This node’s configuration is relatively simple; you only need to select the variable group to be processed from the drop-down list in GroupName (which is the variable group name set in step 8 of the variables node configuration).
Finally, let’s configure the graphical components used in the Dashboard: the chart node and three button nodes.
Double-click the chart node (myChart) to open the editing window, setting the overall size of the chart, type, and display window time, etc.
The three button nodes are already configured in the template, so no further configuration is needed. However, we can open their editing windows to see how they are configured. From the image, we can see that these three button nodes achieve different functionalities by setting different topics.
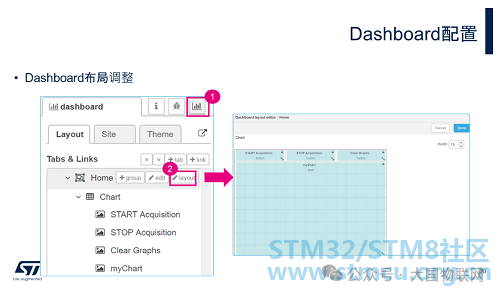
If you want to adjust the layout of the Dashboard, you can follow the steps shown in the image to enter the layout design interface. Here, you can group graphical components, change the size and position of each component. The Dashboard can have multiple tabs (Home, Advanced), which can be selected in the upper left corner of the Dashboard interface. When configuring graphical components, you need to choose which tab to place them under. In the subsequent examples, we will place them under the Home tab without further special instructions.
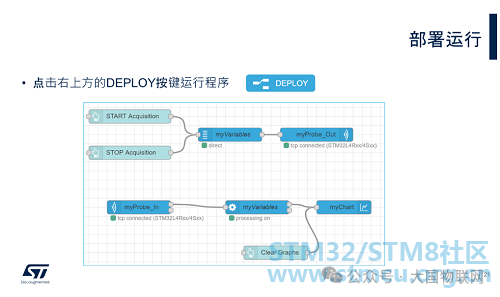
Now that all nodes have been configured, click the DEPLOY button in the upper right corner to deploy and run the edited “flow”. After deployment, the blue dots on all nodes will disappear.
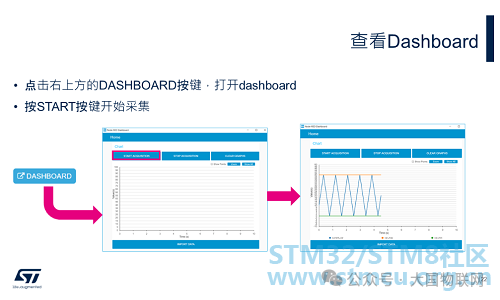
Click the DASHBOARD button in the upper right corner to open the dashboard, and you will see the interface we edited. Click the START ACQUISITION button to begin data collection, and you will see the real-time changes of the three monitored variables.
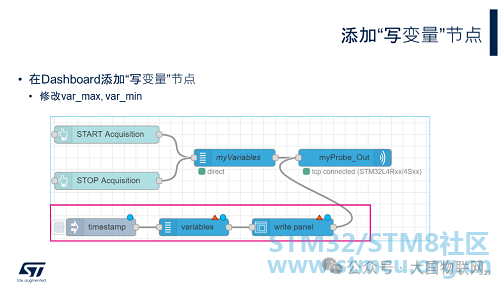
Now that we can monitor the changes of the variables in real-time, to be able to modify the variable values in real-time, we also need to add the inject, variables, and write panel nodes shown in the red box in the image.
The Write panel node will add an input box in the Dashboard, and since the Write panel node is connected to the myProbe_Out node, every value entered will be sent to ST-LINK through myProbe_Out.
The Variables node sets the addresses of the variables to be modified.
The Inject node can manually or automatically inject messages into the “flow” at set time intervals. Here, we use it to trigger a message to be sent when the program starts, sending the variable addresses set in the Variables node to ST-LINK.
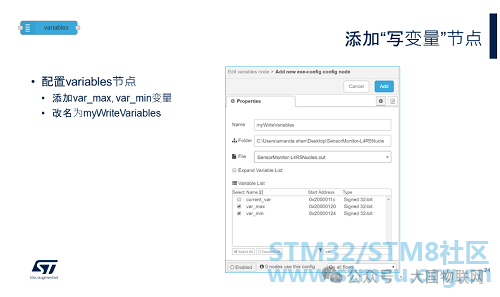
The configuration of the Variables node is the same as before. Here, we only need to add the two variables var_max and var_min that need to be modified.
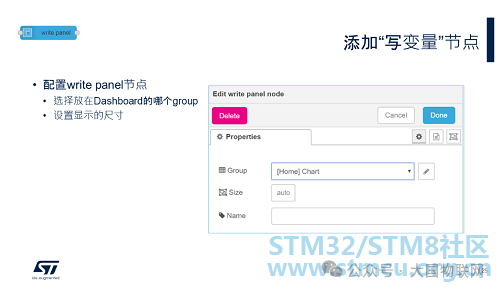
Configure the Write panel node, select to place it under the “Home” tab, and set its size.
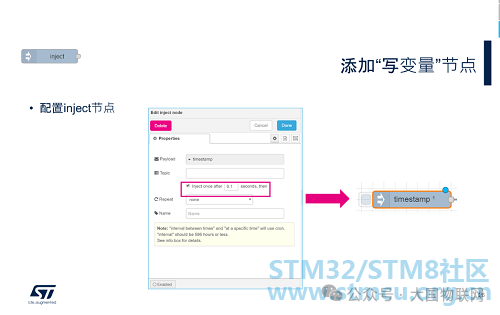
In the Inject node, you can configure the output message payload type (timestamp, number, string, etc.), set the message topic, and the method of sending the message (one-time or periodic). In this example, we mainly use the inject node to trigger a message to be sent when the program starts, so we select timestamp for the Payload, set the repeat option to none, and check the option marked in the red box in the image (trigger a message to be sent once after the program starts). After the settings are complete, the name displayed for the inject node will change to “timestamp”, and a number 1 will appear in the upper right corner, indicating it will only trigger once.

After redeploying and running, enter the Dashboard interface, and you will see the input boxes for the variable values var_max and var_min, along with a “WRITE” button. Enter new variable values in the input boxes, click the WRITE button, and you will see the corresponding variables change immediately in the line graph above.
At this point, we have completed all the flow programming content.
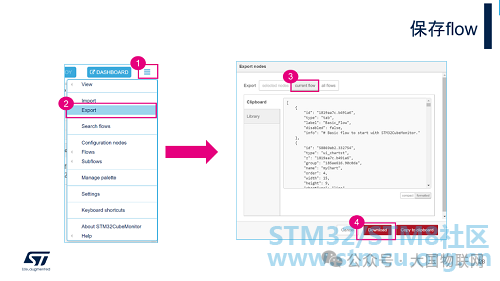
Through the Export menu, you can save the entire flow as a json file, as shown in the image above. When saving, you can choose to save only the selected nodes (selectednodes), the entire flow of the currently selected tab (current flow), or all flows under all opened tabs (all flows).

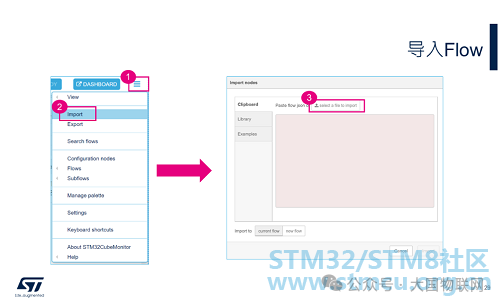
The saved json file can be imported again through the import menu. See the operation steps in the image above.
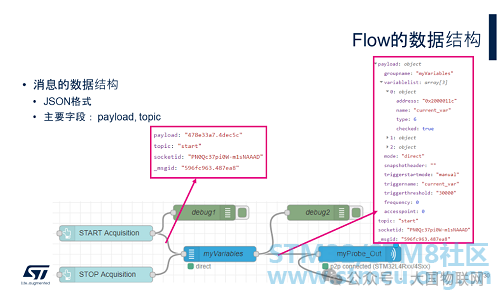
In the final part of this example, let’s understand the data structure of messages passed between nodes and the debug node.
When the output of one node is connected to the input of another node, these two nodes can pass messages. The messages between CubeMonitor nodes use json format, including fields such as payload, topic, and msgid. In the description of each node, you can see the field definitions for input and output messages. Besides the three fields mentioned earlier, different nodes may include different fields in the message based on their functionality. Most nodes will use one or both of the payload and topic fields. During debugging, we generally focus on the payload and topic fields.
The debug node is a very useful debugging tool that can connect to the output of any node to observe the actual message passing situation during runtime. In the debug window (click the small bug icon on the right), you can see the output of all Debug nodes, and system error messages will also be output here.
Now we will connect two debug nodes to the outputs of the START button and the myVariables node, respectively. Configure the Debug node to output the complete message content. Redeploy and run, and then you can see the output information of these two nodes in the debug window. When the START button is pressed, the START node outputs a message with the topic “start” to notify ST-LINK to begin sampling. The output message from the START node first passes through the myVariables node and then is sent to the myProbe_out node.
The message output from the myVariables node includes: the names, addresses, types, and set sampling parameters of all variables to be monitored, and sets the topic to the topic content received from the START node message. All this information can be clearly seen through the debug node. ST-LINK receives the message and knows which variables to start sampling.