What? These beautiful chord diagrams are all drawn with MATLAB???
That’s right, they are all implemented using the chord chart drawing toolkit developed by myself:
-
chord chart chord diagramhttps://www.mathworks.com/matlabcentral/fileexchange/116550-chord-chart -
Digraph chord chart directed chord diagramhttps://www.mathworks.com/matlabcentral/fileexchange/121043-digraph-chord-chart
These two toolkits can be downloaded from the links provided, or you can download them from the Gitee repository shown at the end of this article. This issue only demonstrates how to call functions to draw graphs. Due to space constraints, I will not display the toolkit functions; please download the toolkit yourself. Of course, you can also go directly to the Gitee repository shown at the end of this article to download the complete files.
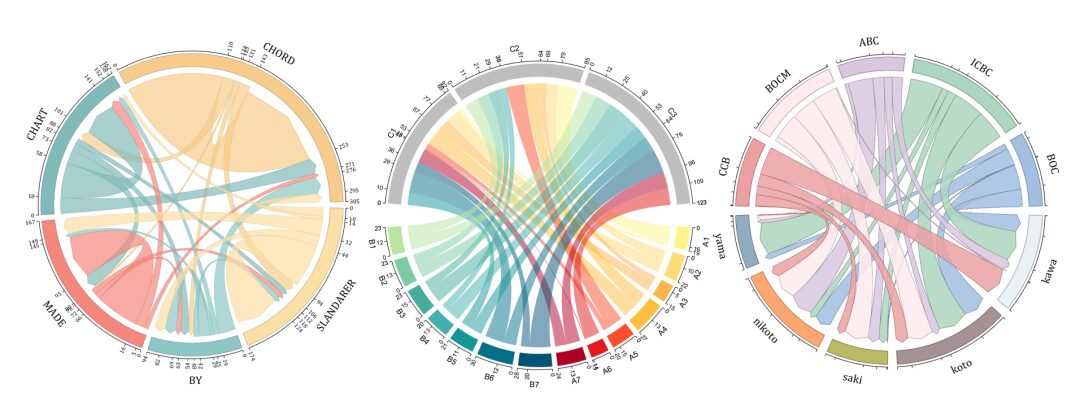
The reason for writing this article is that many people have started using the chord chart drawing tool I developed, but they are not very clear about whether some styles can be set. As a developer, I have a relatively good understanding of the implementation principles of the tool and can use it flexibly. Thus, I came up with the idea of challenging the drawing of various styles of chord diagrams. Currently, the existing code is not short, and in the future, I may integrate some of the code into the toolkit, allowing everyone to achieve the effect of many lines of code with just one or two lines. Without further ado, let’s take a look at what this MATLAB toolkit can currently achieve:
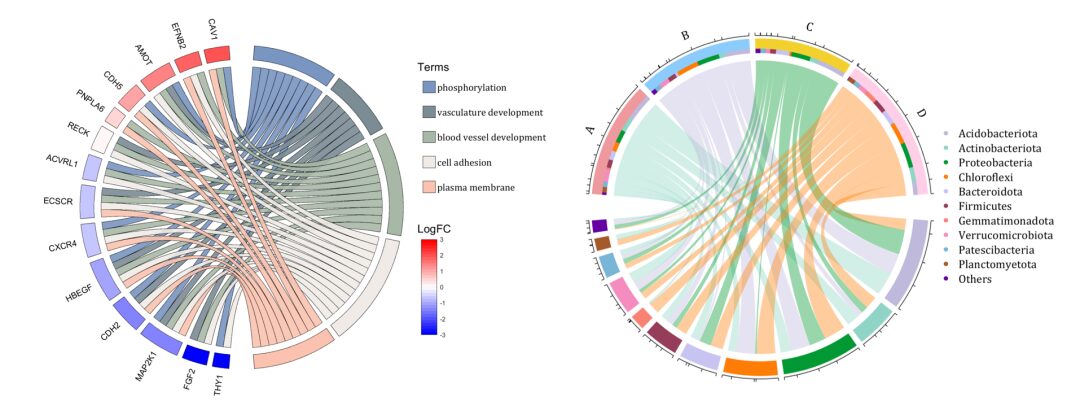
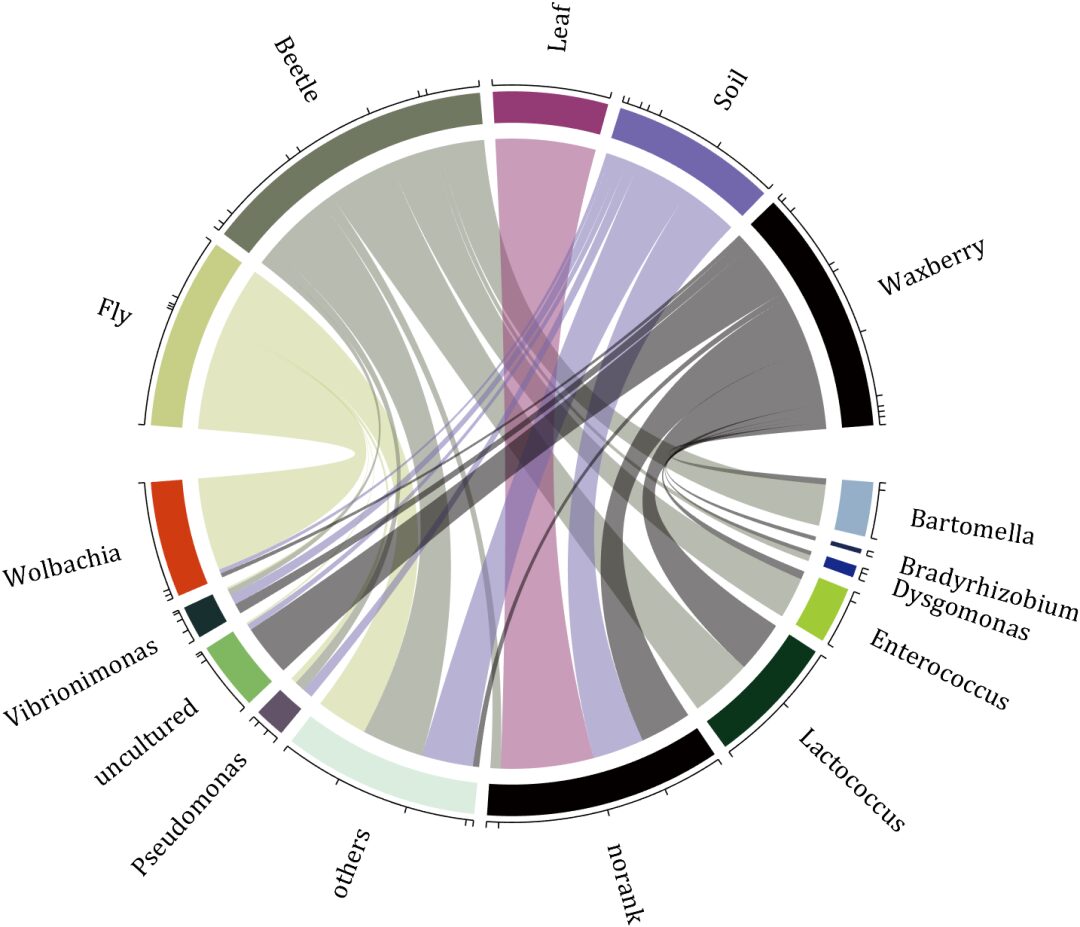
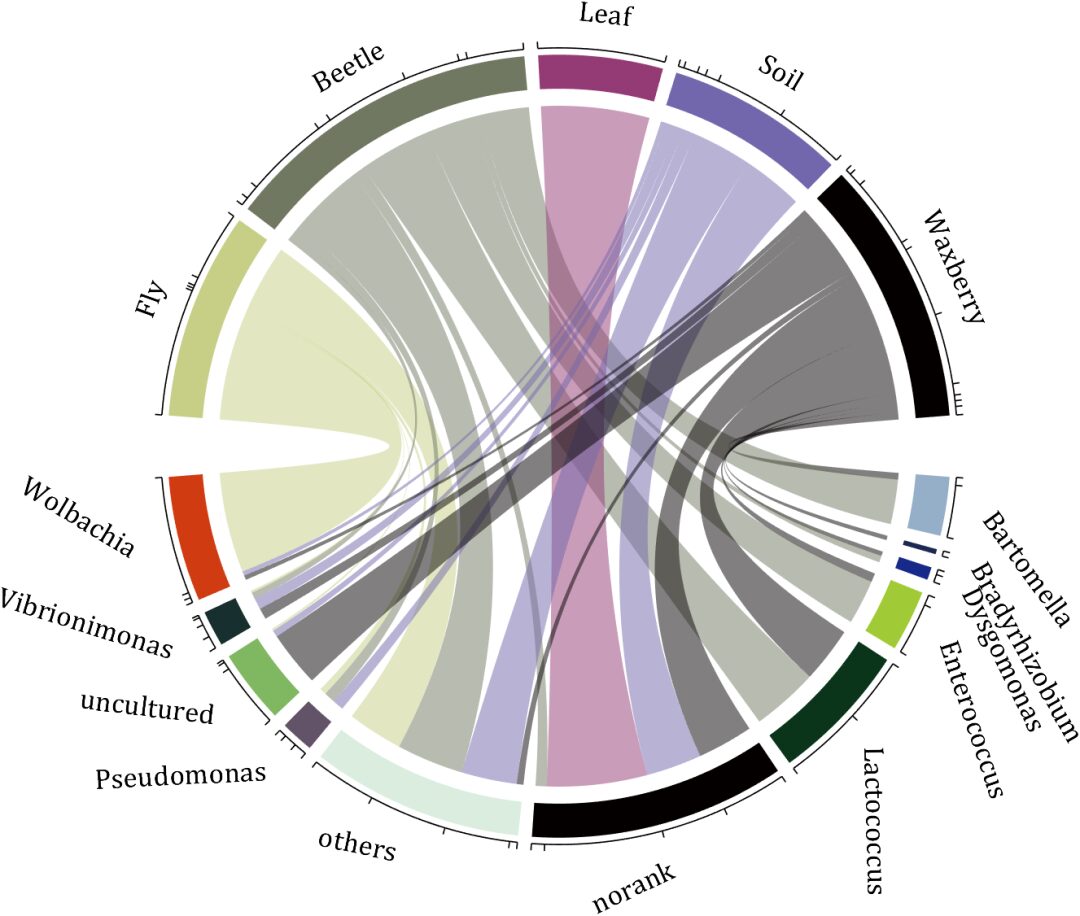
Chord Diagram 1
rng(2)

dataMat = randi([0,5], [11,5]);
dataMat(1:6,1) = 0;
dataMat([11,7],1) = [45,25];
dataMat([1,4,5,7],2) = [20,20,30,30];
dataMat(:,3) = 0;
dataMat(6,3) = 45;
dataMat(1:5,4) = 0;
dataMat([6,7],4) = [25,25];
dataMat([5,6,9],5) = [25,25,25];

colName = {'Fly', 'Beetle', 'Leaf', 'Soil', 'Waxberry'};
rowName = {'Bartomella', 'Bradyrhizobium', 'Dysgomonas', 'Enterococcus',...
           'Lactococcus', 'norank', 'others', 'Pseudomonas', 'uncultured',...
           'Vibrionimonas', 'Wolbachia'};

figure('Units','normalized', 'Position',[.02,.05,.6,.85])
CC = chordChart(dataMat, 'rowName',rowName, 'colName',colName, 'Sep',1/80);
CC = CC.draw();
% Modify the color of the blocks above
CListT = [0.7765 0.8118 0.5216; 0.4431 0.4706 0.3843; 0.5804 0.2275 0.4549;
          0.4471 0.4039 0.6745; 0.0157 0      0     ];
for i = 1:size(dataMat, 2)
    CC.setSquareT_N(i, 'FaceColor',CListT(i,:))
end
% Modify the color of the blocks below
CListF = [0.5843 0.6863 0.7843; 0.1098 0.1647 0.3255; 0.0902 0.1608 0.5373;
          0.6314 0.7961 0.2118; 0.0392 0.2078 0.1059; 0.0157 0      0     ;
          0.8549 0.9294 0.8745; 0.3882 0.3255 0.4078; 0.5020 0.7216 0.3843;
          0.0902 0.1843 0.1804; 0.8196 0.2314 0.0706];
for i = 1:size(dataMat, 1)
    CC.setSquareF_N(i, 'FaceColor',CListF(i,:))
end
% Modify chord color
for i = 1:size(dataMat, 1)
    for j = 1:size(dataMat, 2)
        CC.setChordMN(i,j, 'FaceColor',CListT(j,:), 'FaceAlpha',.5)
    end
end

CC.tickState('on')
CC.labelRotate('on')
CC.setFont('FontSize',17, 'FontName','Cambria')


% CC.labelRotate('off')
% textHdl = findobj(gca,'Tag','ChordLabel');
% for i = 1:length(textHdl)
%     if textHdl(i).Position(2) < 0
%         if abs(textHdl(i).Position(1)) > .7
%             textHdl(i).Rotation = textHdl(i).Rotation + 45;
%             textHdl(i).HorizontalAlignment = 'right';
%             if textHdl(i).Rotation > 90
%                 textHdl(i).Rotation = textHdl(i).Rotation + 180;
%                 textHdl(i).HorizontalAlignment = 'left';
%             end
%         else
%             textHdl(i).Rotation = textHdl(i).Rotation + 10;
%             textHdl(i).HorizontalAlignment = 'right';
%         end
%     end
% end
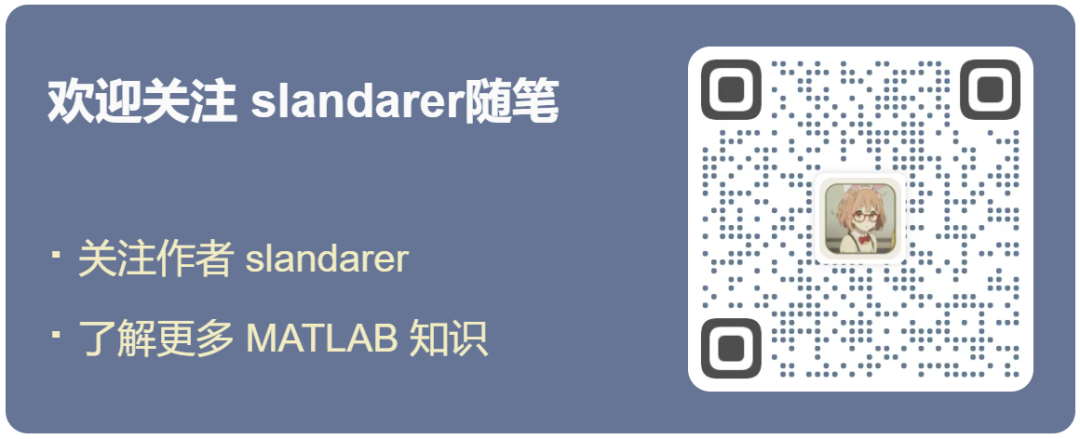
Chord Diagram 2
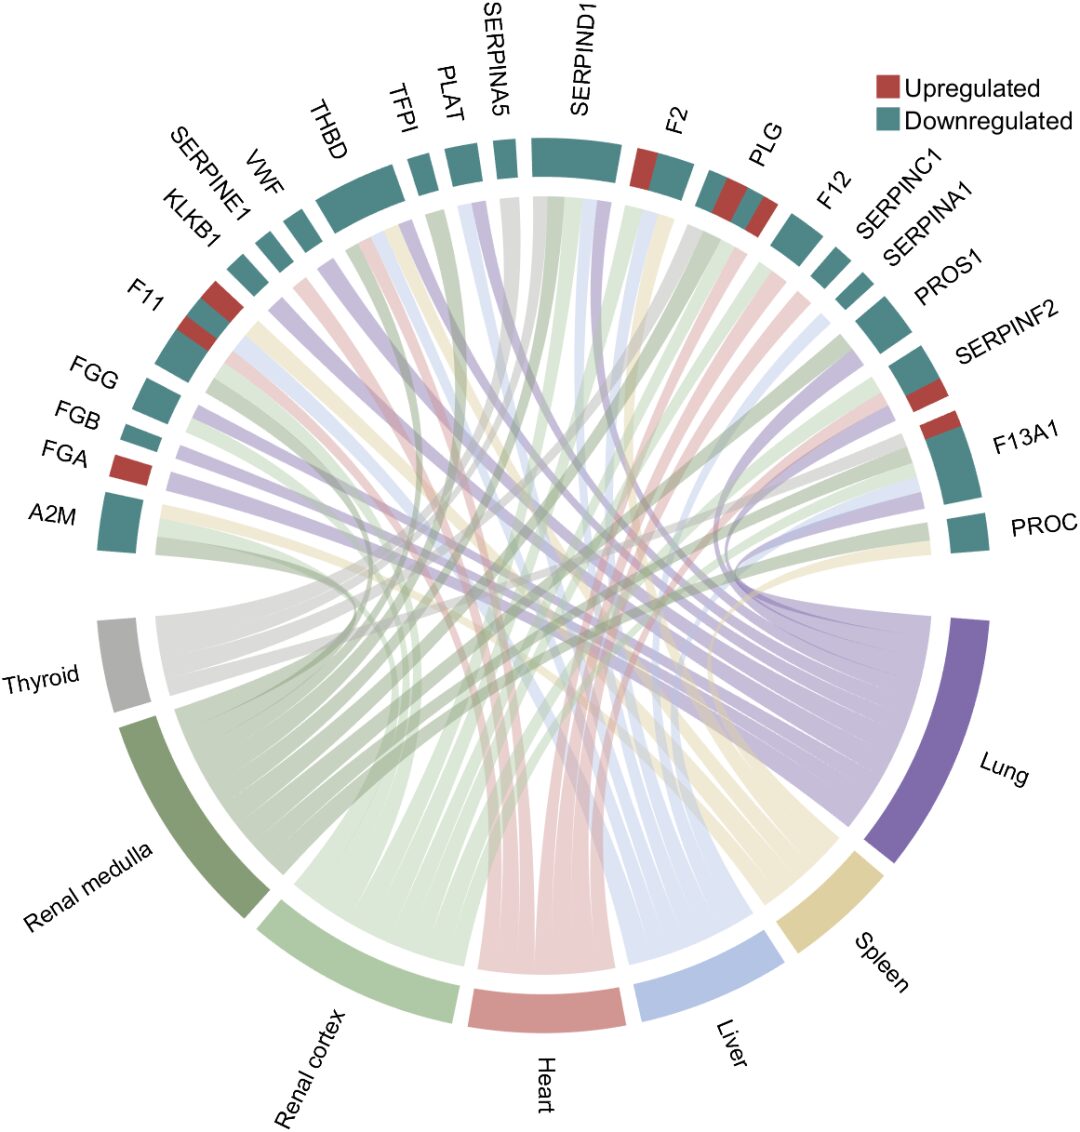
rng(3)
dataMat = randi([1,15], [7,22]);
dataMat(dataMat < 11) = 0;
dataMat(1, sum(dataMat, 1) == 0) = 15;
colName = {'A2M', 'FGA', 'FGB', 'FGG', 'F11', 'KLKB1', 'SERPINE1', 'VWF',...
           'THBD', 'TFPI', 'PLAT', 'SERPINA5', 'SERPIND1', 'F2', 'PLG', 'F12',...
           'SERPINC1', 'SERPINA1', 'PROS1', 'SERPINF2', 'F13A1', 'PROC'};
rowName = {'Lung', 'Spleen', 'Liver', 'Heart',...
           'Renal cortex', 'Renal medulla', 'Thyroid'};

figure('Units','normalized', 'Position',[.02,.05,.6,.85])
CC = chordChart(dataMat, 'rowName',rowName, 'colName',colName, 'Sep',1/80, 'LRadius',1.21);
CC = CC.draw();
CC.labelRotate('on')

% Set individual end blocks for each chord
% Use obj.setEachSquareF_Prop
% or  obj.setEachSquareT_Prop
% F means from (blocks below)
% T means to   (blocks above)
CListT = [173,70,65; 79,135,136]./255;
% Upregulated:1 | Downregulated:2
Regulated = rand([7, 22]);
Regulated = (Regulated < .8) + 1;
for i = 1:size(Regulated, 1)
    for j = 1:size(Regulated, 2)
        CC.setEachSquareT_Prop(i, j, 'FaceColor', CListT(Regulated(i,j),:))
    end
end
% Draw legend
H1 = fill([0,1,0] + 100, [1,0,1] + 100, CListT(1,:), 'EdgeColor','none');
H2 = fill([0,1,0] + 100, [1,0,1] + 100, CListT(2,:), 'EdgeColor','none');
lgdHdl = legend([H1,H2], {'Upregulated','Downregulated'}, 'AutoUpdate','off', 'Location','best');
lgdHdl.ItemTokenSize = [12,12];
lgdHdl.Box = 'off';
gldHdl.FontSize = 13;

% Modify the color of the blocks below
CListF = [128,108,171; 222,208,161; 180,196,229; 209,150,146; 175,201,166;
          134,156,118; 175,175,173]./255;
for i = 1:size(dataMat, 1)
    CC.setSquareF_N(i, 'FaceColor',CListF(i,:))
end
% Modify chord color
for i = 1:size(dataMat, 1)
    for j = 1:size(dataMat, 2)
        CC.setChordMN(i,j, 'FaceColor',CListF(i,:), 'FaceAlpha',.45)
    end
end
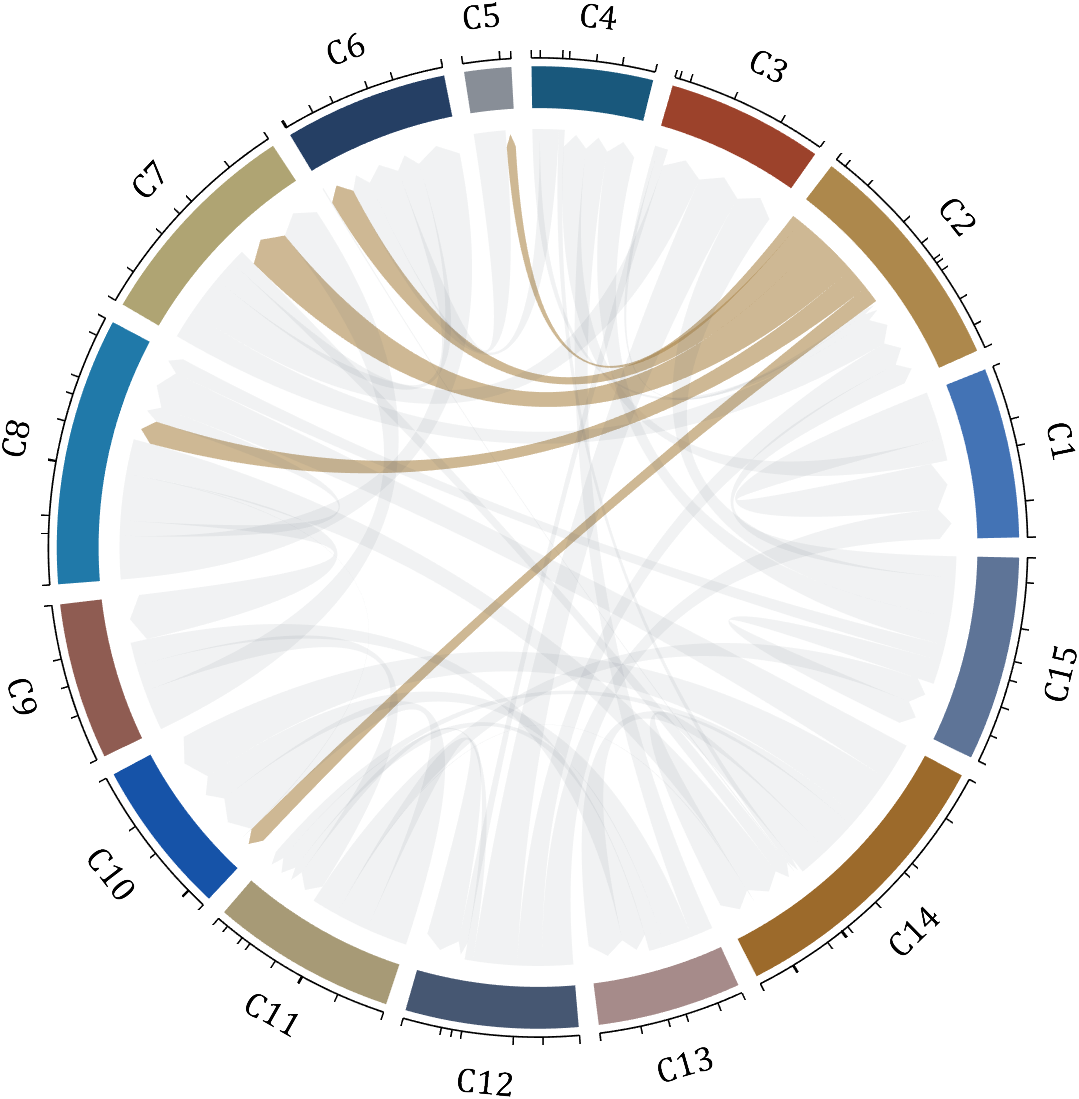
Chord Diagram 3
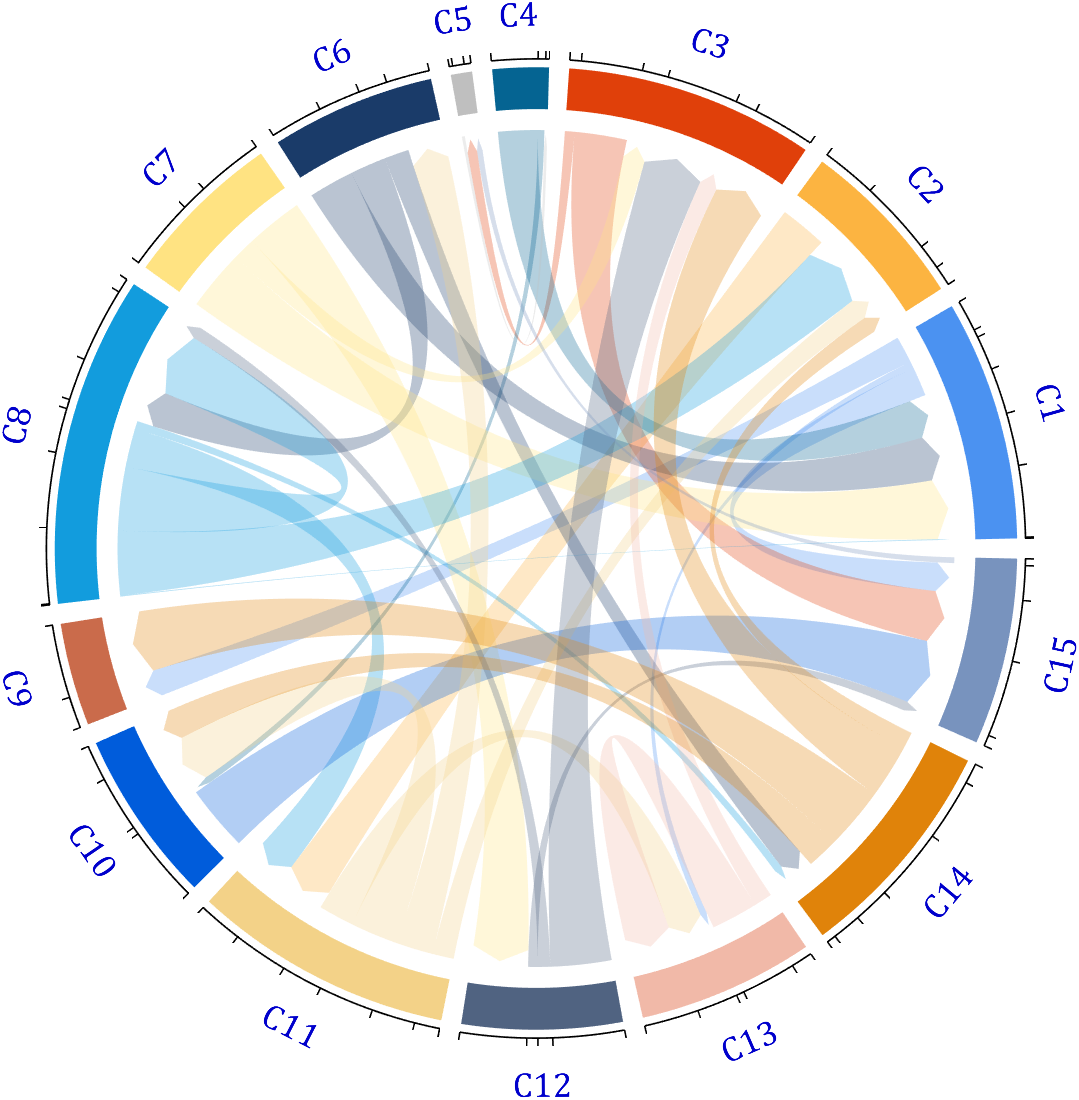
dataMat = rand([15,15]);
dataMat(dataMat > .15) = 0;

CList = [ 75,146,241; 252,180, 65; 224, 64, 10;   5,100,146; 191,191,191;
          26, 59,105; 255,227,130;  18,156,221; 202,107, 75;   0, 92,219;
         243,210,136;  80, 99,129; 241,185,168; 224,131, 10; 120,147,190]./255;

figure('Units','normalized', 'Position',[.02,.05,.6,.85])
BCC = biChordChart(dataMat, 'Arrow','on', 'CData',CList);
BCC = BCC.draw();

% Add ticks
BCC.tickState('on')

% Modify font, size, and color
BCC.setFont('FontName','Cambria', 'FontSize',17, 'Color',[0,0,.8])
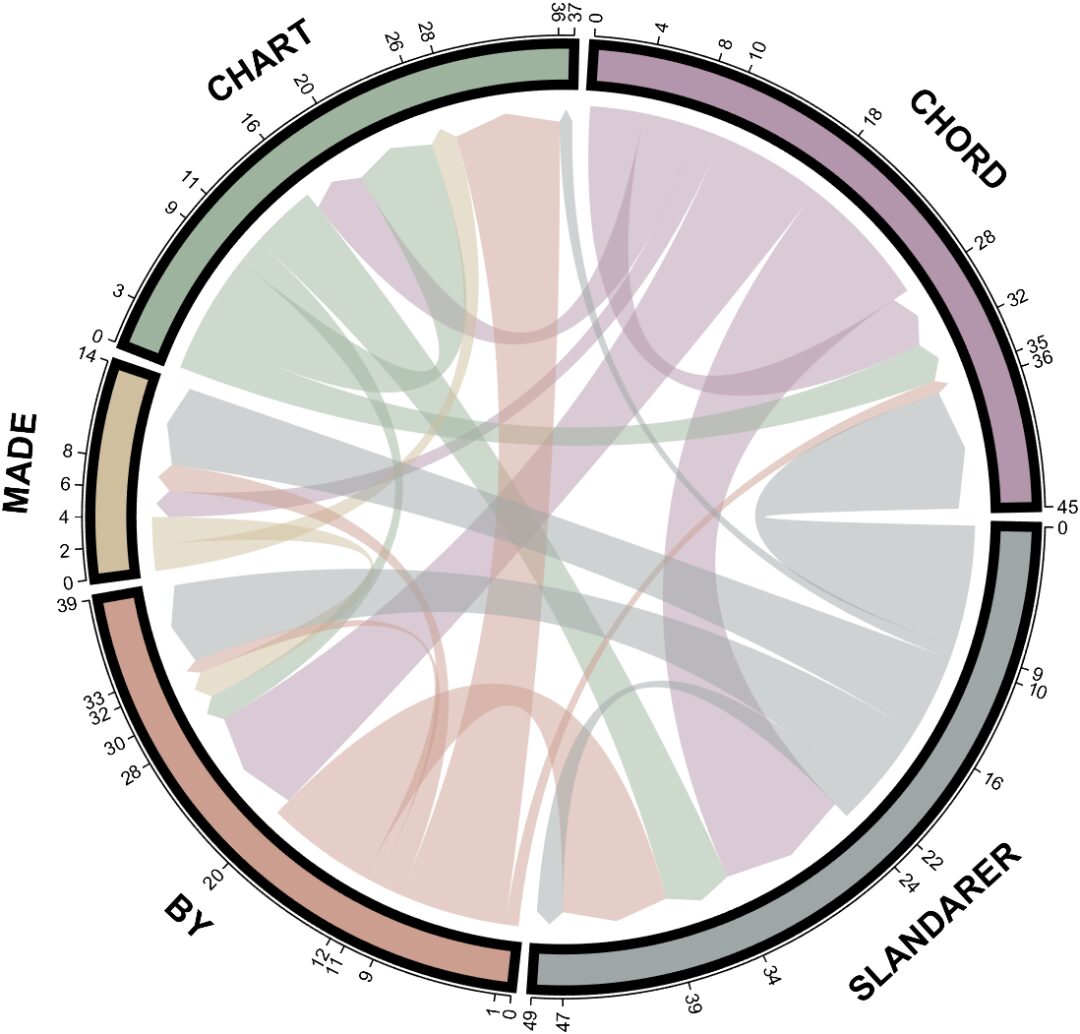
Chord Diagram 4
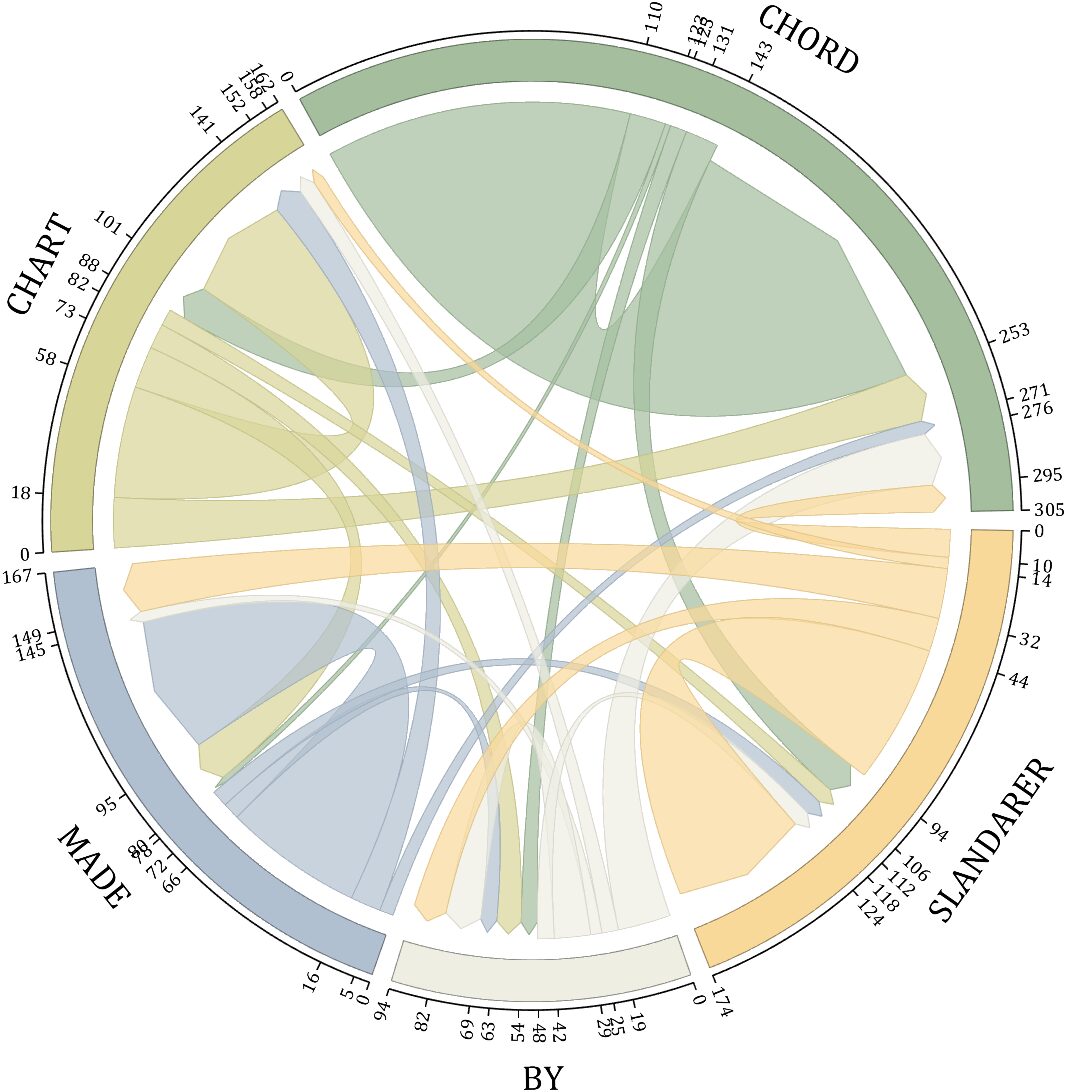
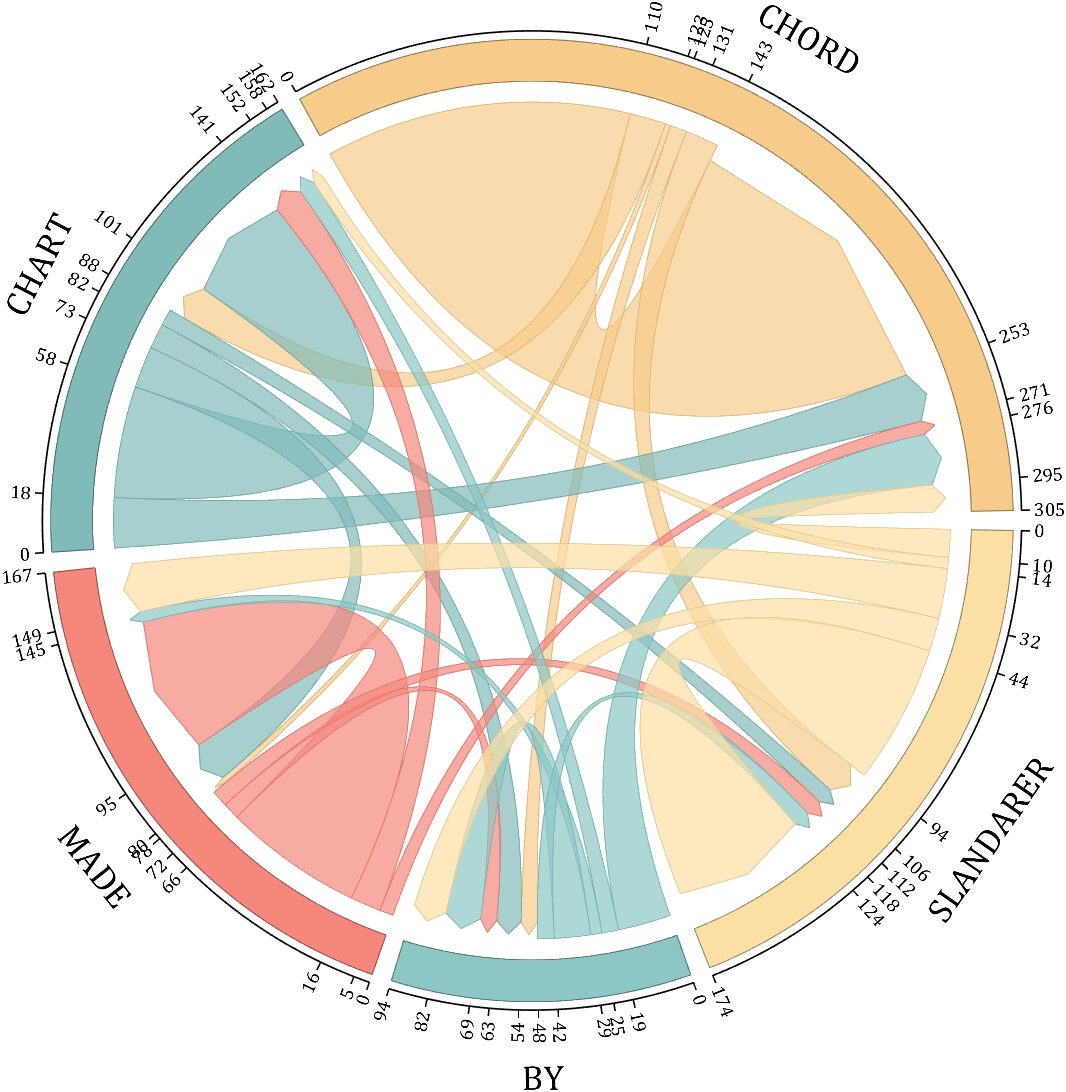
rng(5)
dataMat = randi([1,20], [5,5]);
dataMat(1,1) = 110;
dataMat(2,2) = 40;
dataMat(3,3) = 50;
dataMat(5,5) = 50;

CList1 = [164,190,158; 216,213,153; 177,192,208; 238,238,227; 249,217,153]./255;
CList2 = [247,204,138; 128,187,185; 245,135,124; 140,199,197; 252,223,164]./255;
CList = CList2;
NameList={'CHORD','CHART','MADE','BY','SLANDARER'};

figure('Units','normalized', 'Position',[.02,.05,.6,.85])
BCC = biChordChart(dataMat, 'Arrow','on', 'CData',CList, 'Sep',1/30, 'Label',NameList, 'LRadius',1.33);
BCC = BCC.draw();

% Add ticks
BCC.tickState('on')

% Modify chord color
for i = 1:size(dataMat, 1)
    for j = 1:size(dataMat, 2)
        if dataMat(i,j) > 0
            BCC.setChordMN(i,j, 'FaceAlpha',.7, 'EdgeColor',CList(i,:)./1.1)
        end
    end
end
% Modify block color
for i = 1:size(dataMat, 1)
    BCC.setSquareN(i, 'EdgeColor',CList(i,:)./1.7)
end

% Modify font, size, and color
BCC.setFont('FontName','Cambria', 'FontSize',17)
BCC.tickLabelState('on')
BCC.setTickFont('FontName','Cambria', 'FontSize',9)
Chord Diagram 5
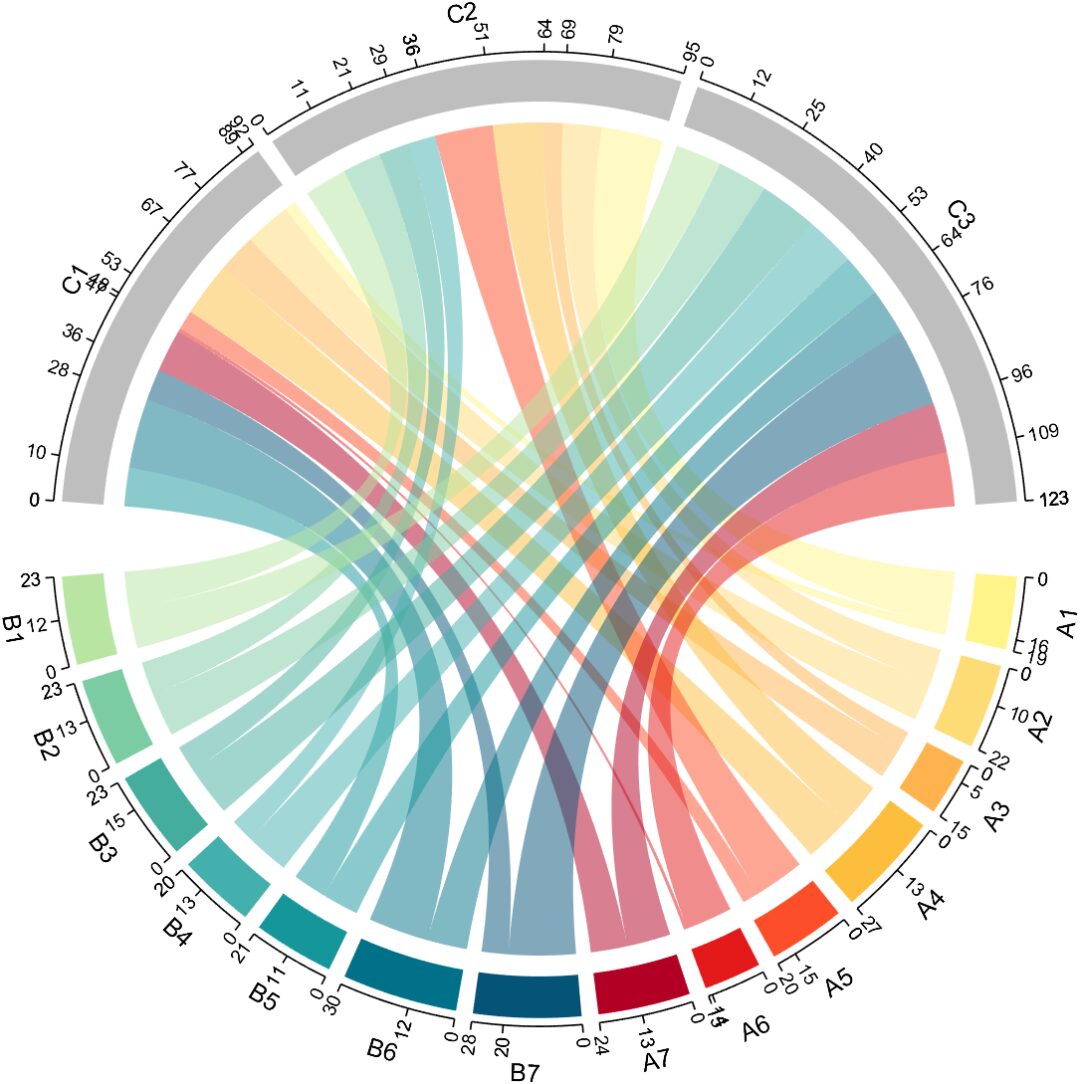
dataMat=randi([1,20], [14,3]);
dataMat(11:14,1) = 0;
dataMat(6:10,2) = 0;
dataMat(1:5,3) = 0;

colName =  compose('C%d', 1:3);
rowName = [compose('A%d', 1:7), compose('B%d', 7:-1:1)];

figure('Units','normalized', 'Position',[.02,.05,.6,.85])
CC = chordChart(dataMat, 'rowName',rowName, 'colName',colName, 'Sep',1/80);
CC = CC.draw();

% Modify the color of the blocks above
for i = 1:size(dataMat, 2)
    CC.setSquareT_N(i, 'FaceColor',[190,190,190]./255)
end
% Modify the color of the blocks below
CListF=[255,244,138; 253,220,117; 254,179, 78; 253,190, 61;
        252, 78, 41; 228, 26, 26; 178,  0, 36;   4, 84,119;
          1,113,137;  21,150,155;  67,176,173;  68,173,158;
        123,204,163; 184,229,162]./255;
for i = 1:size(dataMat, 1)
    CC.setSquareF_N(i, 'FaceColor',CListF(i,:))
end
% Modify chord color
for i = 1:size(dataMat, 1)
    for j = 1:size(dataMat, 2)
        CC.setChordMN(i,j, 'FaceColor',CListF(i,:), 'FaceAlpha',.5)
    end
end

CC.tickState('on')
CC.tickLabelState('on')
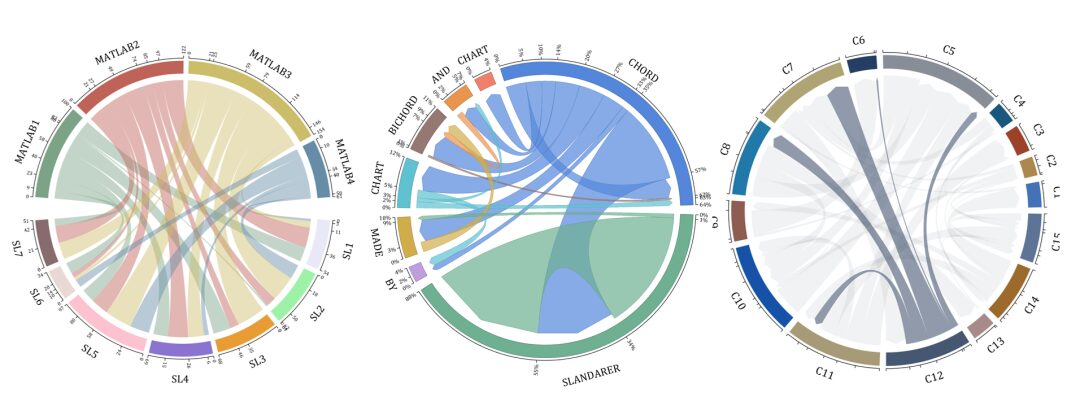
Chord Diagram 6
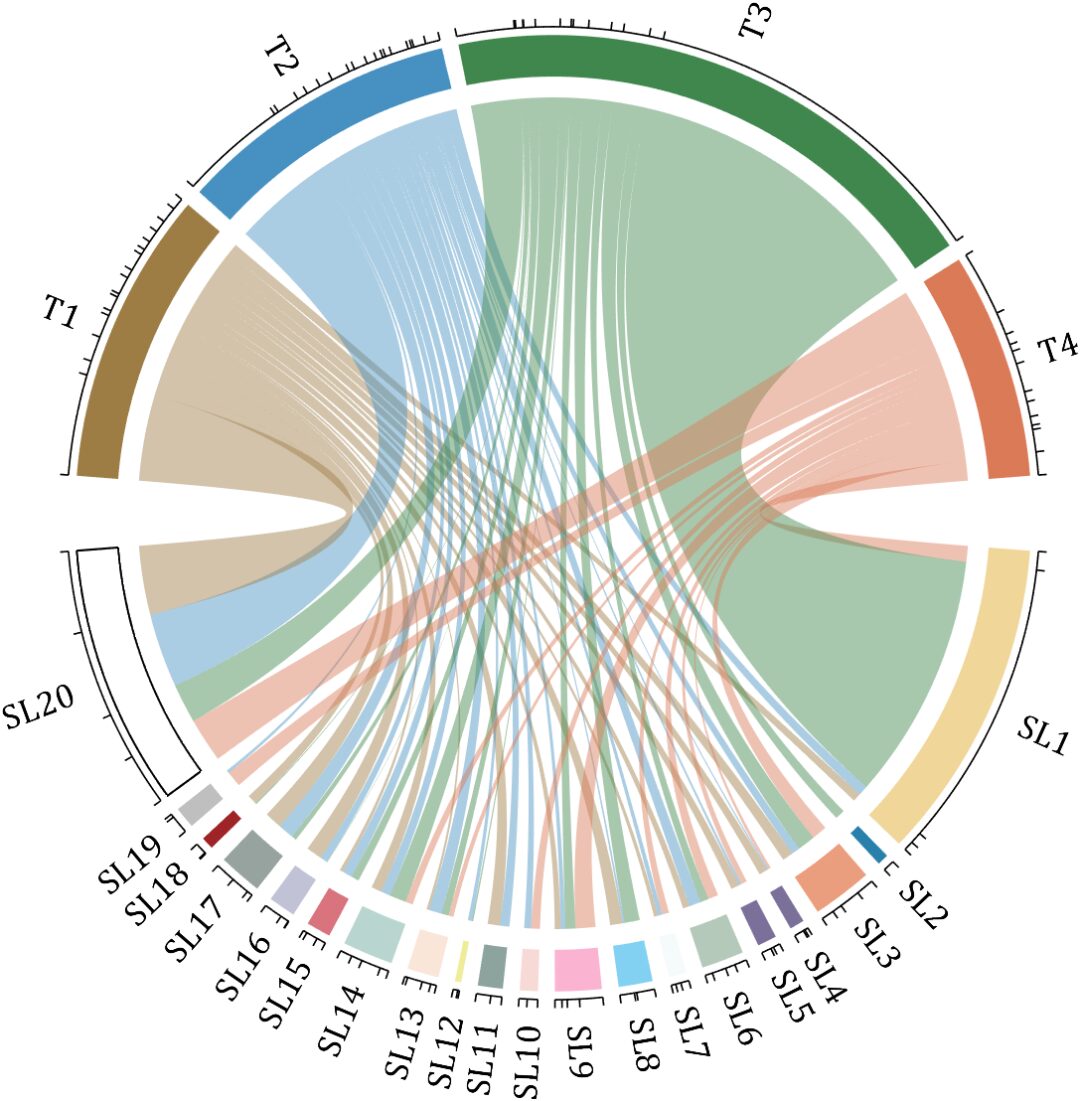
rng(2)

dataMat = randi([0,40], [20,4]);
dataMat(rand([20,4]) < .2) = 0;
dataMat(1,3) = 500;
dataMat(20,1:4) = [140; 150; 80; 90];

colName = compose('T%d', 1:4);
rowName = compose('SL%d', 1:20);

figure('Units','normalized', 'Position',[.02,.05,.6,.85])
CC = chordChart(dataMat, 'rowName',rowName, 'colName',colName, 'Sep',1/80, 'LRadius',1.23);
CC = CC.draw();
% Modify the color of the blocks above
CListT = [0.62,0.49,0.27; 0.28,0.57,0.76
          0.25,0.53,0.30; 0.86,0.48,0.34];
for i = 1:size(dataMat, 2)
    CC.setSquareT_N(i, 'FaceColor',CListT(i,:))
end
% Modify the color of the blocks below
CListF = [0.94,0.84,0.60; 0.16,0.50,0.67; 0.92,0.62,0.49;
    0.48,0.44,0.60; 0.48,0.44,0.60; 0.71,0.79,0.73;
    0.96,0.98,0.98; 0.51,0.82,0.95; 0.98,0.70,0.82;
    0.97,0.85,0.84; 0.55,0.64,0.62; 0.94,0.93,0.60;
    0.98,0.90,0.85; 0.72,0.84,0.81; 0.85,0.45,0.49;
    0.76,0.76,0.84; 0.59,0.64,0.62; 0.62,0.14,0.15;
    0.75,0.75,0.75; 1.00,1.00,1.00];
for i = 1:size(dataMat, 1)
    CC.setSquareF_N(i, 'FaceColor',CListF(i,:))
end
CC.setSquareF_N(size(dataMat, 1), 'EdgeColor','k', 'LineWidth',1)
% Modify chord color
for i = 1:size(dataMat, 1)
    for j = 1:size(dataMat, 2)
        CC.setChordMN(i,j, 'FaceColor',CListT(j,:), 'FaceAlpha',.46)
    end
end

CC.tickState('on')
CC.labelRotate('on')
CC.setFont('FontSize',17, 'FontName','Cambria')
Chord Diagram 7
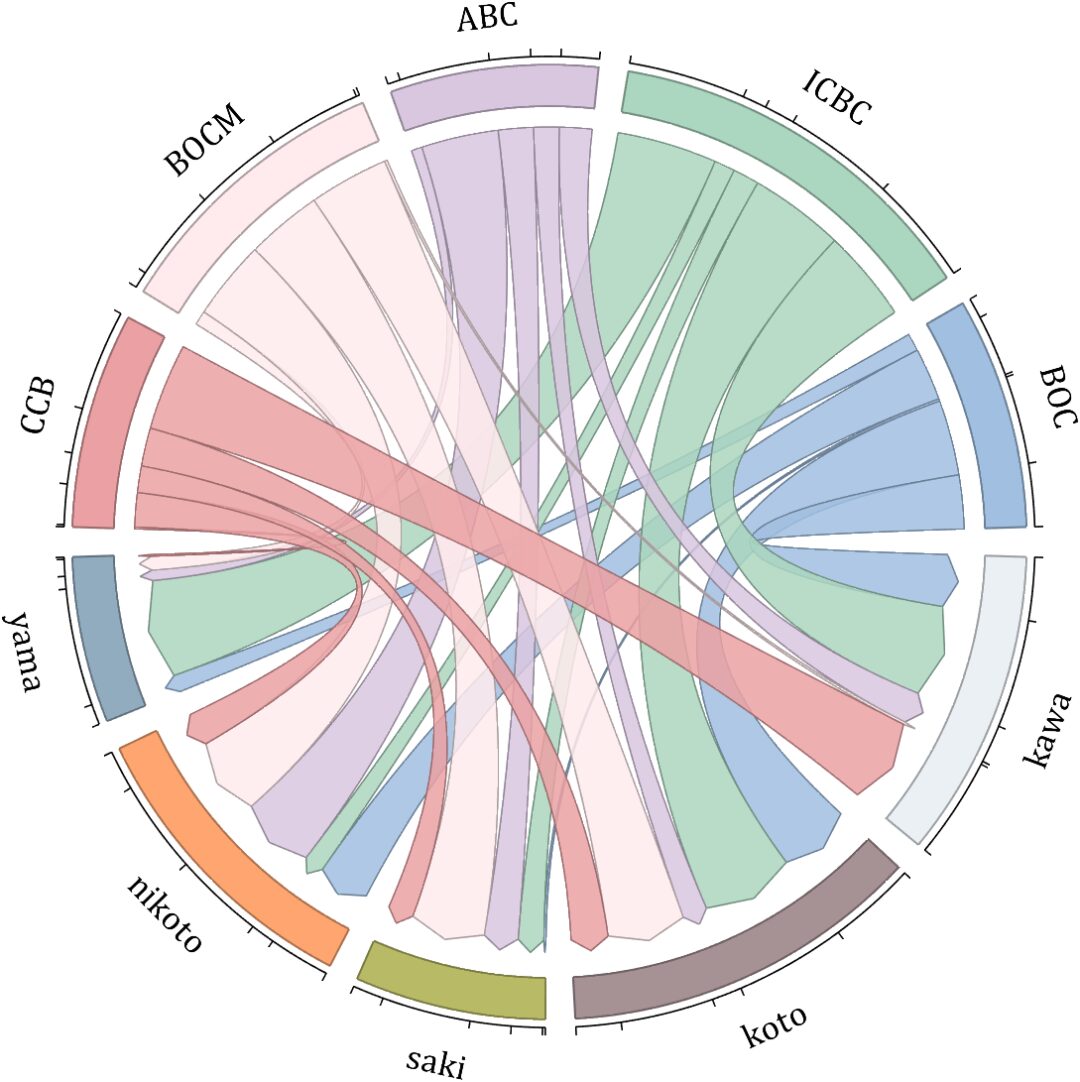
dataMat = randi([10,10000], [10,10]);
dataMat(6:10,:) = 0;
dataMat(:,1:5) = 0;

NameList = {'BOC', 'ICBC', 'ABC', 'BOCM', 'CCB', ...
            'yama', 'nikoto', 'saki', 'koto', 'kawa'};
CList = [0.63,0.75,0.88
    0.67,0.84,0.75
    0.85,0.78,0.88
    1.00,0.92,0.93
    0.92,0.63,0.64
    0.57,0.67,0.75
    1.00,0.65,0.44
    0.72,0.73,0.40
    0.65,0.57,0.58
    0.92,0.94,0.96];

figure('Units','normalized', 'Position',[.02,.05,.6,.85])
BCC = biChordChart(dataMat, 'Arrow','on', 'CData',CList, 'Label',NameList);
BCC = BCC.draw();

% Modify chord color
for i = 1:size(dataMat, 1)
    for j = 1:size(dataMat, 2)
        if dataMat(i,j) > 0
            BCC.setChordMN(i,j, 'FaceAlpha',.85, 'EdgeColor',CList(i,:)./1.5, 'LineWidth',.8)
        end
    end
end
for i = 1:size(dataMat, 1)
    BCC.setSquareN(i, 'EdgeColor',CList(i,:)./1.5, 'LineWidth',1)
end

% Add ticks, modify font
BCC.tickState('on')
BCC.setFont('FontName','Cambria', 'FontSize',17)
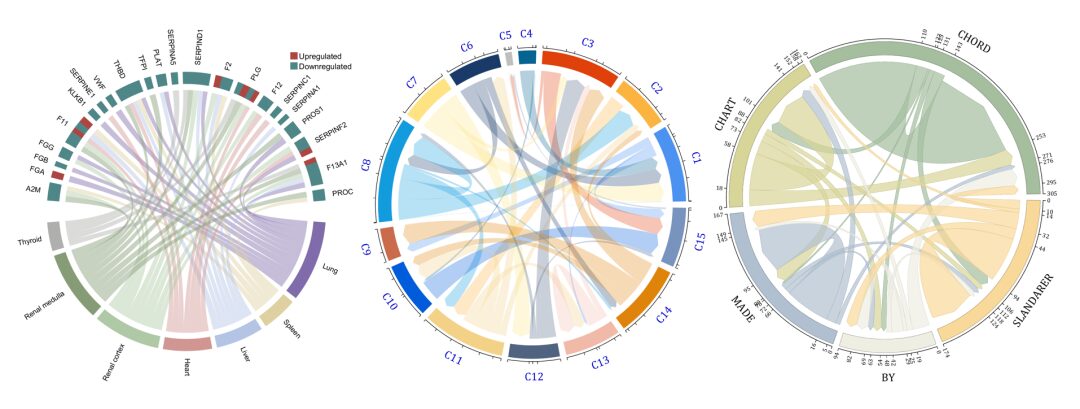
Chord Diagram 8
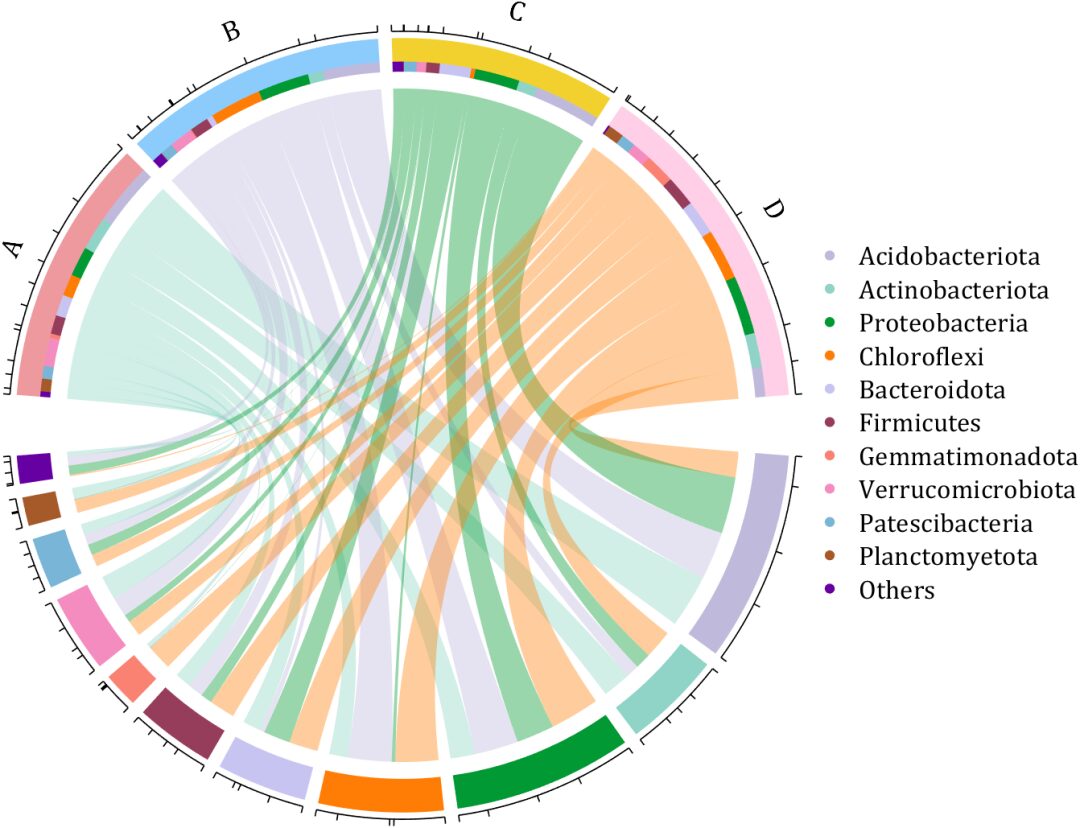
dataMat = rand([11,4]);
dataMat = round(10.*dataMat.*((11:-1:1).'+1))./10;

colName = {'A','B','C','D'};
rowName = {'Acidobacteriota', 'Actinobacteriota', 'Proteobacteria', ...
           'Chloroflexi', 'Bacteroidota', 'Firmicutes', 'Gemmatimonadota', ...
           'Verrucomicrobiota', 'Patescibacteria', 'Planctomyetota', 'Others'};

figure('Units','normalized', 'Position',[.02,.05,.8,.85])
CC = chordChart(dataMat, 'colName',colName, 'Sep',1/80, 'SSqRatio',30/100);% -30/100
CC = CC.draw();

% Modify the color of the blocks above
CListT = [0.93,0.60,0.62
    0.55,0.80,0.99
    0.95,0.82,0.18
    1.00,0.81,0.91];
for i = 1:size(dataMat, 2)
    CC.setSquareT_N(i, 'FaceColor',CListT(i,:))
end

% Modify the color of the blocks below
CListF = [0.75,0.73,0.86
    0.56,0.83,0.78
    0.00,0.60,0.20
    1.00,0.49,0.02
    0.78,0.77,0.95
    0.59,0.24,0.36
    0.98,0.51,0.45
    0.96,0.55,0.75
    0.47,0.71,0.84
    0.65,0.35,0.16
    0.40,0.00,0.64];
for i = 1:size(dataMat, 1)
    CC.setSquareF_N(i, 'FaceColor',CListF(i,:))
end

% Modify chord color
CListC = [0.55,0.83,0.76
    0.75,0.73,0.86
    0.00,0.60,0.19
    1.00,0.51,0.04];
for i = 1:size(dataMat, 1)
    for j = 1:size(dataMat, 2)
        CC.setChordMN(i,j, 'FaceColor',CListC(j,:), 'FaceAlpha',.4)
    end
end

% Set individual end blocks for each chord
% Use obj.setEachSquareF_Prop
% or  obj.setEachSquareT_Prop
for i = 1:size(dataMat, 1)
    for j = 1:size(dataMat, 2)
        CC.setEachSquareT_Prop(i,j, 'FaceColor', CListF(i,:))
    end
end

% Add ticks
CC.tickState('on')

% Modify font, size, and color
CC.setFont('FontName','Cambria', 'FontSize',17)

% Hide lower labels
textHdl = findobj(gca, 'Tag','ChordLabel');
for i = 1:length(textHdl)
    if textHdl(i).Position(2) < 0
        set(textHdl(i), 'Visible','off')
    end
end

% Draw legend
scatterHdl = scatter(10.*ones(size(dataMat,1)),10.*ones(size(dataMat,1)), ...
                     55, 'filled');
for i = 1:length(scatterHdl)
    scatterHdl(i).CData = CListF(i,:);
end
lgdHdl = legend(scatterHdl, rowName, 'Location','best', 'FontSize',16, 'FontName','Cambria', 'Box','off');
set(lgdHdl, 'Position',[.7482,.3577,.1658,.3254])
Chord Diagram 9
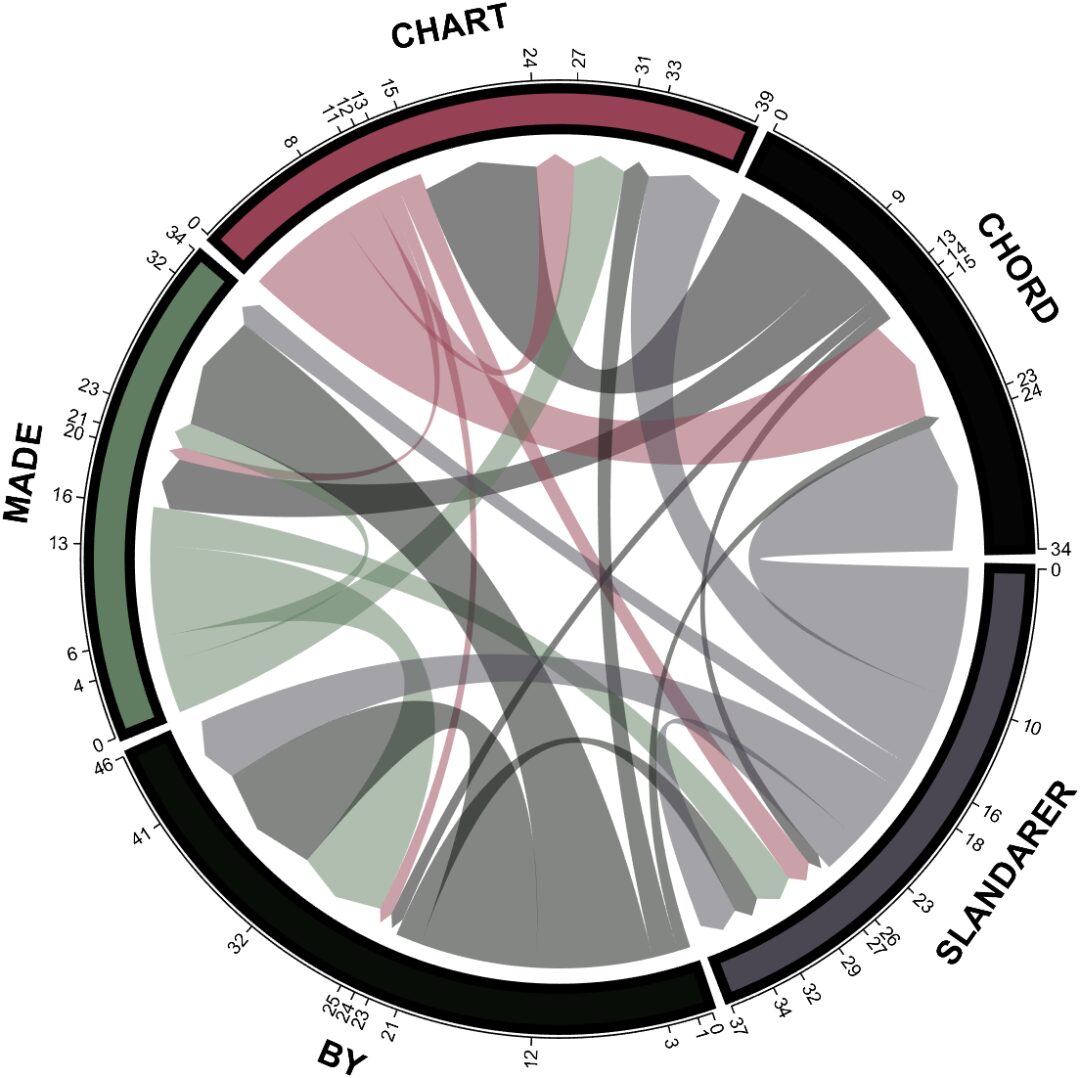
dataMat = randi([0,10], [5,5]);

CList1 = [0.70,0.59,0.67
    0.62,0.70,0.62
    0.81,0.75,0.62
    0.80,0.62,0.56
    0.62,0.65,0.65];
CList2 = [0.02,0.02,0.02
    0.59,0.26,0.33
    0.38,0.49,0.38
    0.03,0.05,0.03
    0.29,0.28,0.32];
CList = CList2;

NameList={'CHORD','CHART','MADE','BY','SLANDARER'};

figure('Units','normalized', 'Position',[.02,.05,.6,.85])
BCC = biChordChart(dataMat, 'Arrow','on', 'CData',CList, 'Sep',1/30, 'Label',NameList, 'LRadius',1.33);
BCC = BCC.draw();

% Modify chord color
for i = 1:size(dataMat, 1)
    for j = 1:size(dataMat, 2)
        BCC.setChordMN(i,j, 'FaceAlpha',.5)
    end
end
% Modify block color
for i = 1:size(dataMat, 1)
    BCC.setSquareN(i, 'EdgeColor',[0,0,0], 'LineWidth',5)
end

% Add ticks
BCC.tickState('on')
% Modify font, size, and color
BCC.setFont('FontSize',17, 'FontWeight','bold')
BCC.tickLabelState('on')
BCC.setTickFont('FontSize',9)
Chord Diagram 10
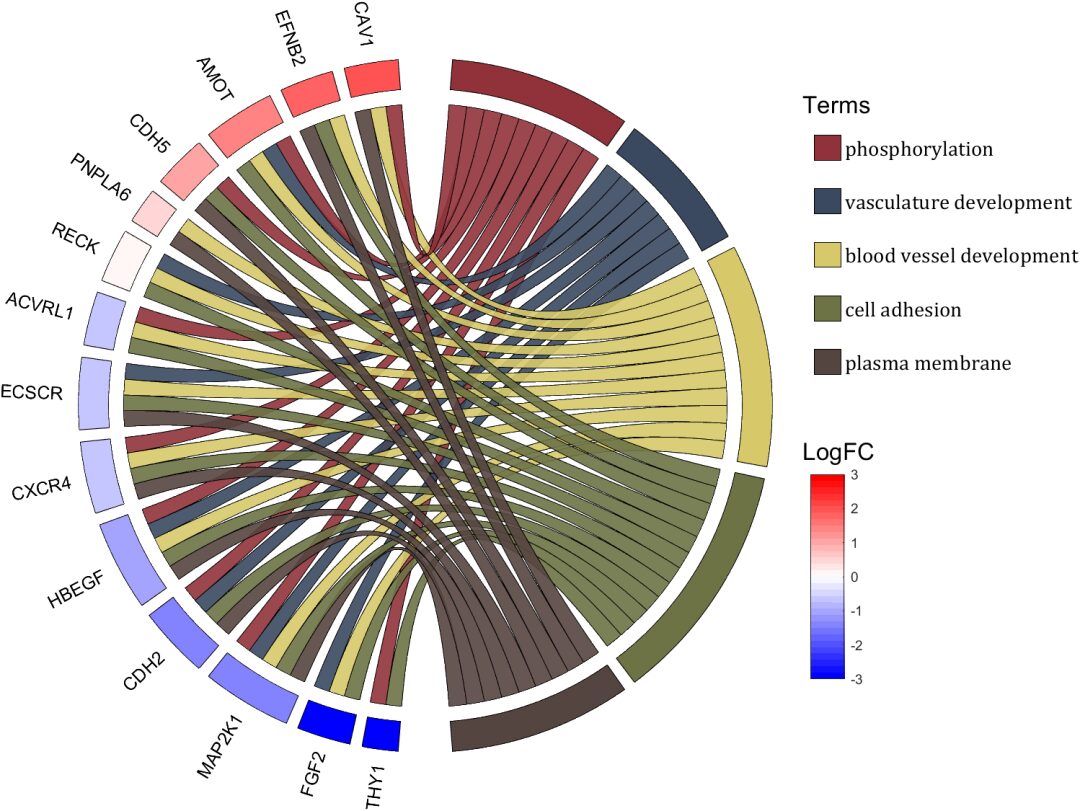
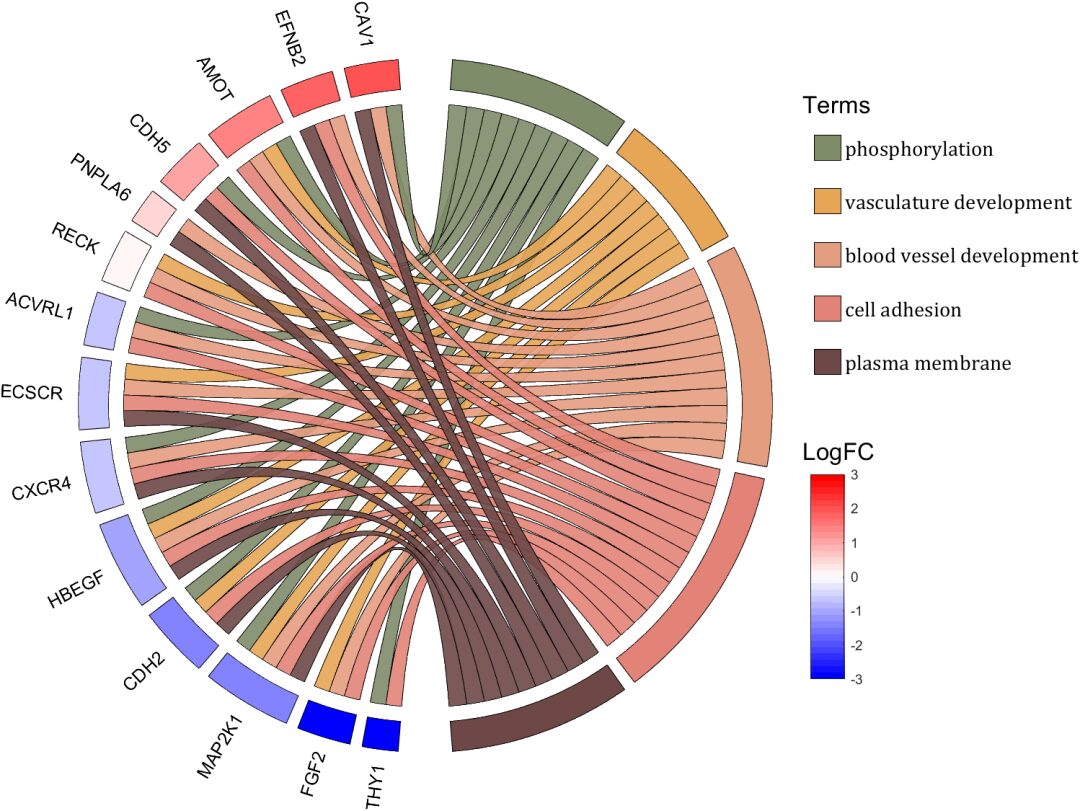
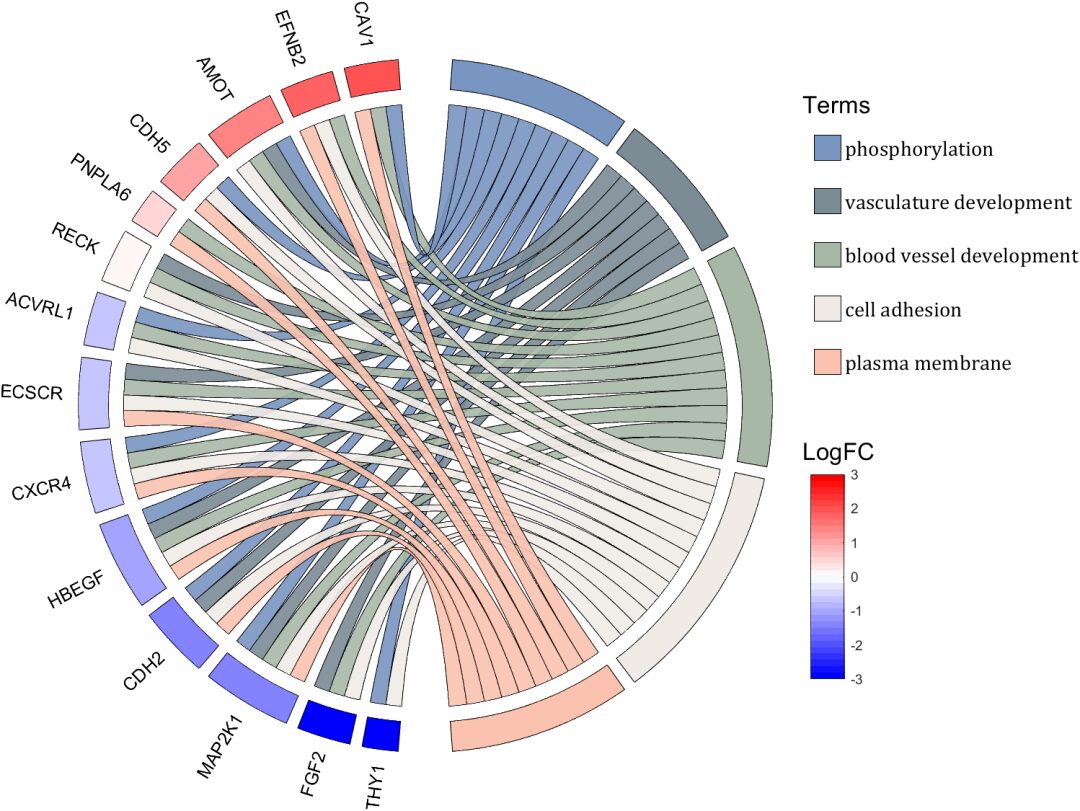
rng(2)
dataMat = rand([14,5]) > .3;

colName = {'phosphorylation', 'vasculature development', 'blood vessel development', ...
           'cell adhesion', 'plasma membrane'};
rowName = {'THY1', 'FGF2', 'MAP2K1', 'CDH2', 'HBEGF', 'CXCR4', 'ECSCR',...
           'ACVRL1', 'RECK', 'PNPLA6', 'CDH5', 'AMOT', 'EFNB2', 'CAV1'};

figure('Units','normalized', 'Position',[.02,.05,.9,.85])
CC = chordChart(dataMat, 'colName',colName, 'rowName',rowName, 'Sep',1/80, 'LRadius',1.2);
CC = CC.draw();

% Modify the color of the blocks above
CListT1 = [0.5686    0.1961    0.2275
    0.2275    0.2863    0.3765
    0.8431    0.7882    0.4118
    0.4275    0.4510    0.2706
    0.3333    0.2706    0.2510];
CListT2 = [0.4941    0.5490    0.4118
    0.9059    0.6510    0.3333
    0.8980    0.6157    0.4980
    0.8902    0.5137    0.4667
    0.4275    0.2824    0.2784];
CListT3 = [0.4745    0.5843    0.7569
    0.4824    0.5490    0.5843
    0.6549    0.7216    0.6510
    0.9412    0.9216    0.9059
    0.9804    0.7608    0.6863];
CListT = CListT3;
for i = 1:size(dataMat, 2)
    CC.setSquareT_N(i, 'FaceColor',CListT(i,:), 'EdgeColor',[0,0,0])
end
% Modify chord color
for i = 1:size(dataMat, 1)
    for j = 1:size(dataMat, 2)
        CC.setChordMN(i,j, 'FaceColor',CListT(j,:), 'FaceAlpha',.9, 'EdgeColor',[0,0,0])
    end
end

% Modify the color of the blocks below
logFC = sort(rand(1,14))*6 - 3;
for i = 1:size(dataMat, 1)
    CC.setSquareF_N(i, 'CData',logFC(i), 'FaceColor','flat', 'EdgeColor',[0,0,0])
end
CMap = [     0         0    1.0000; 0.0645    0.0645    1.0000; 0.1290    0.1290    1.0000; 0.1935    0.1935    1.0000
        0.2581    0.2581    1.0000; 0.3226    0.3226    1.0000; 0.3871    0.3871    1.0000; 0.4516    0.4516    1.0000
        0.5161    0.5161    1.0000; 0.5806    0.5806    1.0000; 0.6452    0.6452    1.0000; 0.7097    0.7097    1.0000
        0.7742    0.7742    1.0000; 0.8387    0.8387    1.0000; 0.9032    0.9032    1.0000; 0.9677    0.9677    1.0000
        1.0000    0.9677    0.9677; 1.0000    0.9032    0.9032; 1.0000    0.8387    0.8387; 1.0000    0.7742    0.7742
        1.0000    0.7097    0.7097; 1.0000    0.6452    0.6452; 1.0000    0.5806    0.5806; 1.0000    0.5161    0.5161
        1.0000    0.4516    0.4516; 1.0000    0.3871    0.3871; 1.0000    0.3226    0.3226; 1.0000    0.2581    0.2581
        1.0000    0.1935    0.1935; 1.0000    0.1290    0.1290; 1.0000    0.0645    0.0645; 1.0000         0         0];
colormap(CMap);
try clim([-3,3]),catch,end
try caxis([-3,3]),catch,end

CBHdl = colorbar();
CBHdl.Position = [0.74,0.25,0.02,0.2];

% =========================================================================
% Swap XY axis
patchHdl = findobj(gca, 'Type','patch');
for i = 1:length(patchHdl)
    tX = patchHdl(i).XData;
    tY = patchHdl(i).YData;
    patchHdl(i).XData = tY;
    patchHdl(i).YData = - tX;
end
txtHdl = findobj(gca, 'Type','text');
for i = 1:length(txtHdl)
    txtHdl(i).Position([1,2]) = [1,-1].*txtHdl(i).Position([2,1]);
    if txtHdl(i).Position(1) < 0
        txtHdl(i).HorizontalAlignment = 'right';
    else
        txtHdl(i).HorizontalAlignment = 'left';
    end
end
lineHdl = findobj(gca, 'Type','line');
for i = 1:length(lineHdl)
    tX = lineHdl(i).XData;
    tY = lineHdl(i).YData;
    lineHdl(i).XData = tY;
    lineHdl(i).YData = - tX;
end
% =========================================================================

txtHdl = findobj(gca, 'Type','text');
for i = 1:length(txtHdl)
    if txtHdl(i).Position(1) > 0
        txtHdl(i).Visible = 'off';
    end
end

text(1.25,-.15, 'LogFC', 'FontSize',16)
text(1.25,1, 'Terms', 'FontSize',16)

patchHdl = [];
for i = 1:size(dataMat, 2)
    patchHdl(i) = fill([10,11,12],[10,13,13], CListT(i,:), 'EdgeColor',[0,0,0]);
end
lgdHdl = legend(patchHdl, colName, 'Location','best', 'FontSize',14, 'FontName','Cambria', 'Box','off');
lgdHdl.Position = [.735,.53,.167,.27];
lgdHdl.ItemTokenSize = [18,8];
Chord Diagram 11
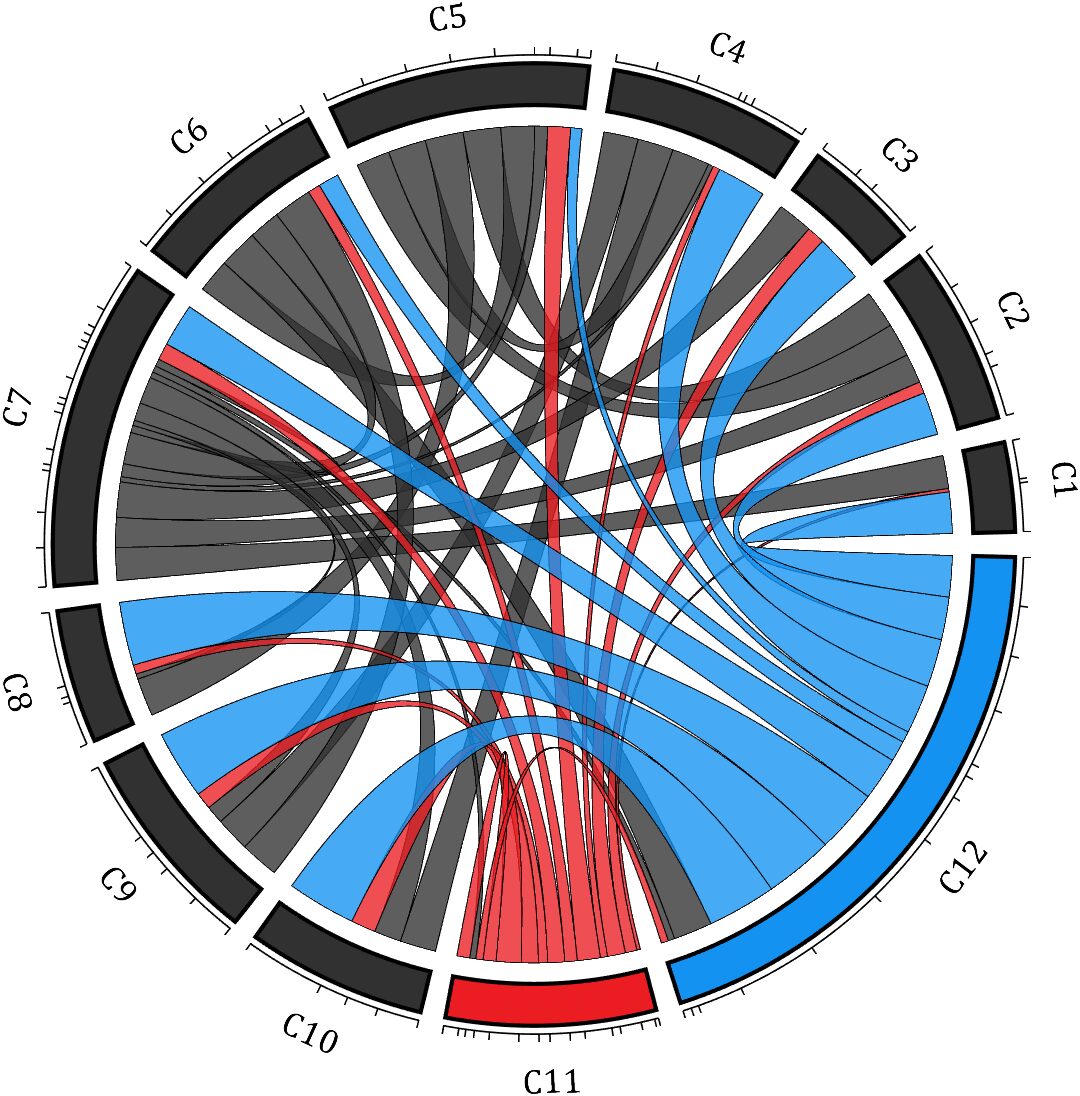
rng(2)
dataMat = rand([12,12]);
dataMat(dataMat < .85) = 0;
dataMat(7,:) = 1.*(rand(1,12)+.1);
dataMat(11,:) = .6.*(rand(1,12)+.1);
dataMat(12,:) = [2.*(rand(1,10)+.1), 0, 0];

CList = [repmat([49,49,49],[10,1]); 235,28,34; 19,146,241]./255;

figure('Units','normalized', 'Position',[.02,.05,.6,.85])
BCC = biChordChart(dataMat, 'Arrow','off', 'CData',CList);
BCC = BCC.draw();

% Add ticks
BCC.tickState('on')

% Modify font, size, and color
BCC.setFont('FontName','Cambria', 'FontSize',17)

% Modify chord color
for i = 1:size(dataMat, 1)
    for j = 1:size(dataMat, 2)
        if dataMat(i,j) > 0
            BCC.setChordMN(i,j, 'FaceAlpha',.78, 'EdgeColor',[0,0,0])
        end
    end
end

% Modify block color
for i = 1:size(dataMat, 1)
    BCC.setSquareN(i, 'EdgeColor',[0,0,0], 'LineWidth',2)
end
Chord Diagram 12
dataMat = rand([9,9]);
dataMat(dataMat > .7) = 0;
dataMat(eye(9) == 1) = (rand([1,9])+.2).*3;

CList = [0.85,0.23,0.24
0.96,0.39,0.18
0.98,0.63,0.22
0.99,0.80,0.26
0.70,0.76,0.21
0.24,0.74,0.71
0.27,0.65,0.84
0.09,0.37,0.80
0.64,0.40,0.84];

figure('Units','normalized', 'Position',[.02,.05,.6,.85])
BCC = biChordChart(dataMat, 'Arrow','on', 'CData',CList);
BCC = BCC.draw();

% Add ticks, tick labels
BCC.tickState('on')

% Modify font, size, and color
BCC.setFont('FontName','Cambria', 'FontSize',17)

% Modify chord color
for i = 1:size(dataMat, 1)
    for j = 1:size(dataMat, 2)
        if dataMat(i,j) > 0
            BCC.setChordMN(i,j, 'FaceAlpha',.7)
        end
    end
end
Chord Diagram 13
rng(2)

dataMat = randi([1,40], [7,4]);
dataMat(rand([7,4]) < .1) = 0;

colName = compose('MATLAB%d', 1:4);
rowName = compose('SL%d', 1:7);

figure('Units','normalized', 'Position',[.02,.05,.7,.85])
CC = chordChart(dataMat, 'rowName',rowName, 'colName',colName, 'Sep',1/80, 'LRadius',1.32);
CC = CC.draw();
% Modify the color of the blocks above
CListT = [0.49,0.64,0.53
    0.75,0.39,0.35
    0.80,0.74,0.42
    0.40,0.55,0.66];
for i = 1:size(dataMat, 2)
    CC.setSquareT_N(i, 'FaceColor',CListT(i,:))
end
% Modify the color of the blocks below
CListF = [0.91,0.91,0.97
    0.62,0.95,0.66
    0.91,0.61,0.20
    0.54,0.45,0.82
    0.99,0.76,0.81
    0.91,0.85,0.83
    0.53,0.42,0.43];
for i = 1:size(dataMat, 1)
    CC.setSquareF_N(i, 'FaceColor',CListF(i,:))
end
% Modify chord color
for i = 1:size(dataMat, 1)
    for j = 1:size(dataMat, 2)
        CC.setChordMN(i,j, 'FaceColor',CListT(j,:), 'FaceAlpha',.46)
    end
end

CC.tickState('on')
CC.tickLabelState('on')
CC.setFont('FontSize',17, 'FontName','Cambria')
CC.setTickFont('FontSize',8, 'FontName','Cambria')
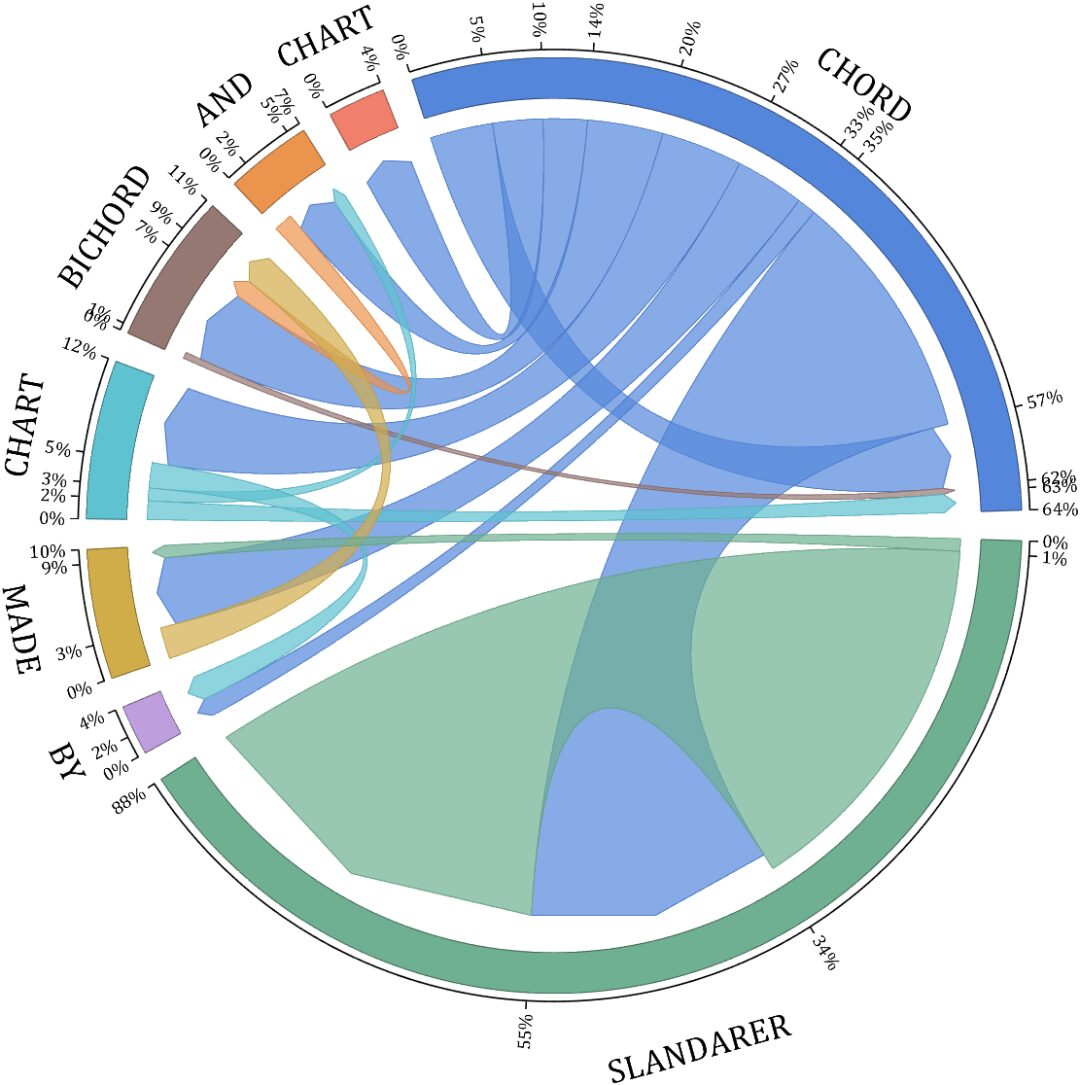
Chord Diagram 14

rng(6)
dataMat = randi([1,20], [8,8]);
dataMat(dataMat > 5) = 0;
dataMat(1,:) = randi([1,15], [1,8]);
dataMat(1,8) = 40;
dataMat(8,8) = 60;

dataMat = dataMat./sum(sum(dataMat));

CList = [0.33,0.53,0.86
    0.94,0.50,0.42
    0.92,0.58,0.30
    0.59,0.47,0.45
    0.37,0.76,0.82
    0.82,0.68,0.29
    0.75,0.62,0.87
    0.43,0.69,0.57];
NameList={'CHORD', 'CHART', 'AND', 'BICHORD',...
    'CHART', 'MADE', 'BY', 'SLANDARER'};

figure('Units','normalized', 'Position',[.02,.05,.6,.85])
BCC = biChordChart(dataMat, 'Arrow','on', 'CData',CList, 'Sep',1/12, 'Label',NameList, 'LRadius',1.33);
BCC = BCC.draw();

% Add ticks
BCC.tickState('on')

% Modify chord color
for i = 1:size(dataMat, 1)
    for j = 1:size(dataMat, 2)
        if dataMat(i,j) > 0
            BCC.setChordMN(i,j, 'FaceAlpha',.7, 'EdgeColor',CList(i,:)./1.1)
        end
    end
end
% Modify block color
for i = 1:size(dataMat, 1)
    BCC.setSquareN(i, 'EdgeColor',CList(i,:)./1.7)
end

% Modify font, size, and color
BCC.setFont('FontName','Cambria', 'FontSize',17)
BCC.tickLabelState('on')
BCC.setTickFont('FontName','Cambria', 'FontSize',9)

% Adjust numeric string format
BCC.setTickLabelFormat(@(x)[num2str(round(x*100)),'%'])
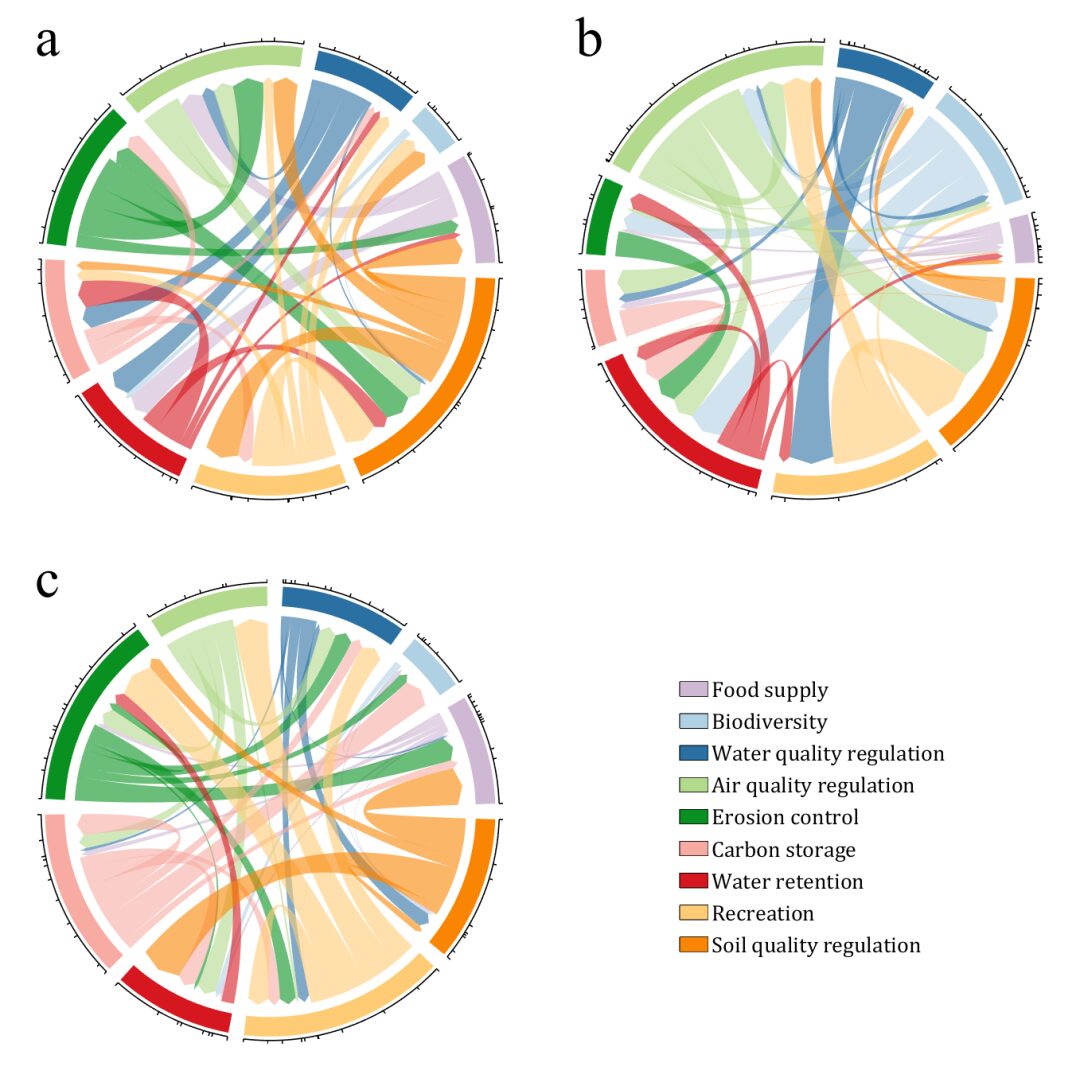
Chord Diagram 15

CList = [0.81,0.72,0.83
0.69,0.82,0.89
0.17,0.44,0.64
0.70,0.85,0.55
0.03,0.57,0.13
0.97,0.67,0.64
0.84,0.09,0.12
1.00,0.80,0.46
0.98,0.52,0.01
    ];

figure('Units','normalized', 'Position',[.02,.05,.53,.85], 'Color',[1,1,1])

% =========================================================================
ax1 = axes('Parent',gcf, 'Position',[0,1/2,1/2,1/2]);
dataMat = rand([9,9]);
dataMat(dataMat > .4) = 0;
BCC = biChordChart(dataMat, 'Arrow','on', 'CData',CList);
BCC = BCC.draw();
BCC.tickState('on')
BCC.setFont('Visible','off')
% Modify chord color
for i = 1:size(dataMat, 1)
    for j = 1:size(dataMat, 2)
        if dataMat(i,j) > 0
            BCC.setChordMN(i,j, 'FaceAlpha',.6)
        end
    end
end
text(-1.2,1.2, 'a', 'FontName','Times New Roman', 'FontSize',35)

% =========================================================================
ax2 = axes('Parent',gcf, 'Position',[1/2,1/2,1/2,1/2]);
dataMat = rand([9,9]);
dataMat(dataMat > .4) = 0;
dataMat = dataMat.*(1:9);
BCC = biChordChart(dataMat, 'Arrow','on', 'CData',CList);
BCC = BCC.draw();
BCC.tickState('on')
BCC.setFont('Visible','off')
% Modify chord color
for i = 1:size(dataMat, 1)
    for j = 1:size(dataMat, 2)
        if dataMat(i,j) > 0
            BCC.setChordMN(i,j, 'FaceAlpha',.6)
        end
    end
end
text(-1.2,1.2, 'b', 'FontName','Times New Roman', 'FontSize',35)

% =========================================================================
ax3 = axes('Parent',gcf, 'Position',[0,0,1/2,1/2]);
dataMat = rand([9,9]);
dataMat(dataMat > .4) = 0;
dataMat = dataMat.*(1:9).';
BCC = biChordChart(dataMat, 'Arrow','on', 'CData',CList);
BCC = BCC.draw();
BCC.tickState('on')
BCC.setFont('Visible','off')
% Modify chord color
for i = 1:size(dataMat, 1)
    for j = 1:size(dataMat, 2)
        if dataMat(i,j) > 0
            BCC.setChordMN(i,j, 'FaceAlpha',.6)
        end
    end
end
text(-1.2,1.2, 'c', 'FontName','Times New Roman', 'FontSize',35)

% =========================================================================
ax4 = axes('Parent',gcf, 'Position',[1/2,0,1/2,1/2]);
ax4.XColor = 'none'; ax4.YColor = 'none';
ax4.XLim = [-1,1]; ax4.YLim = [-1,1];
hold on

NameList = {'Food supply', 'Biodiversity', 'Water quality regulation', ...
            'Air quality regulation', 'Erosion control', 'Carbon storage', ...
            'Water retention', 'Recreation', 'Soil quality regulation'};
patchHdl = [];
for i = 1:size(dataMat, 2)
    patchHdl(i) = fill([10,11,12],[10,13,13], CList(i,:), 'EdgeColor',[0,0,0]);
end
lgdHdl = legend(patchHdl, NameList, 'Location','best', 'FontSize',14, 'FontName','Cambria', 'Box','off');
lgdHdl.Position = [.625,.11,.255,.27];
lgdHdl.ItemTokenSize = [18,8];
Chord Diagram 16
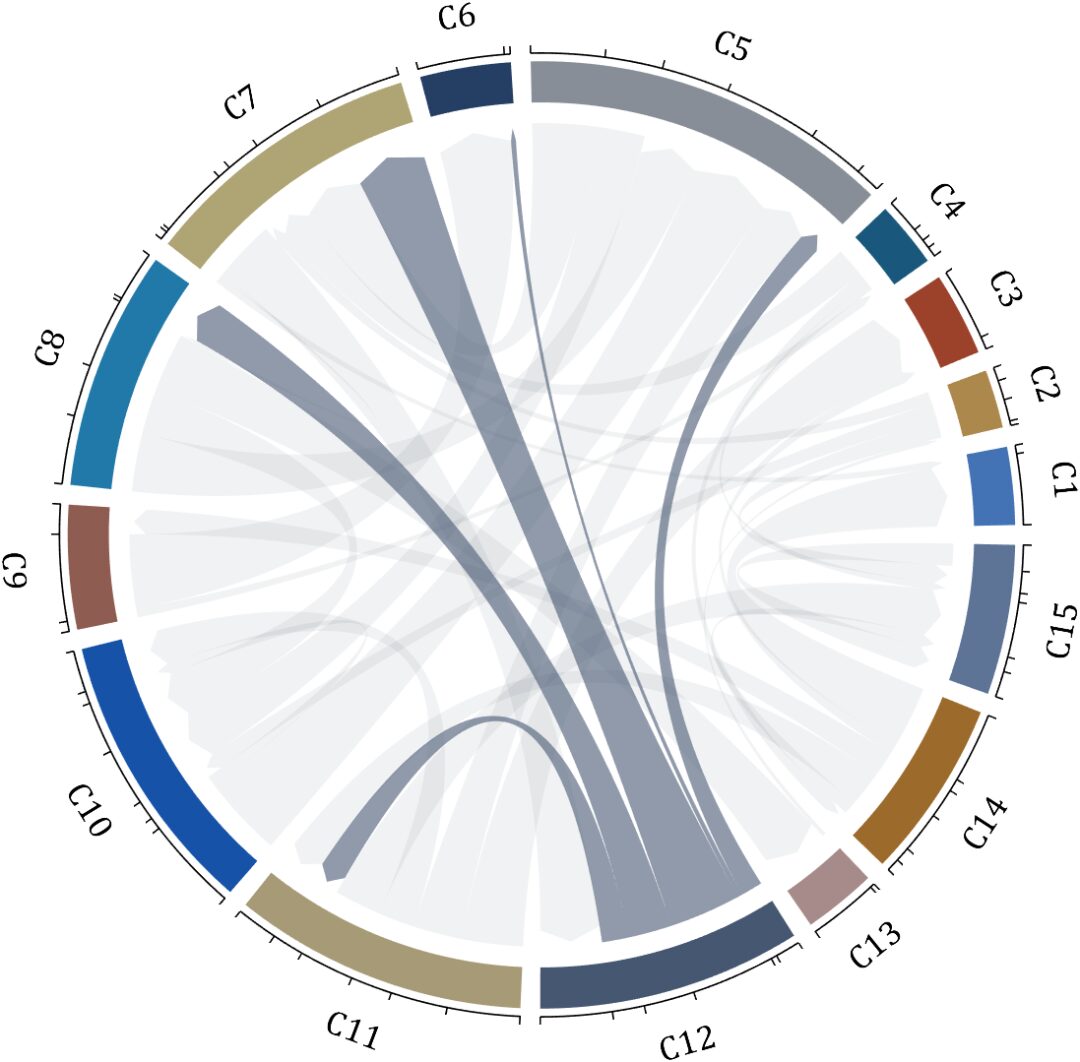
dataMat = rand([15,15]);
dataMat(dataMat > .2) = 0;

CList = [ 75,146,241; 252,180, 65; 224, 64, 10;   5,100,146; 191,191,191;
          26, 59,105; 255,227,130;  18,156,221; 202,107, 75;   0, 92,219;
         243,210,136;  80, 99,129; 241,185,168; 224,131, 10; 120,147,190]./255;
CListC = [54,69,92]./255;
CList = CList.*.6 + CListC.*.4;

figure('Units','normalized', 'Position',[.02,.05,.6,.85])
BCC = biChordChart(dataMat, 'Arrow','on', 'CData',CList);
BCC = BCC.draw();

% Add ticks
BCC.tickState('on')

% Modify font, size, and color
BCC.setFont('FontName','Cambria', 'FontSize',17, 'Color',[0,0,0])

% Modify chord color
for i = 1:size(dataMat, 1)
    for j = 1:size(dataMat, 2)
        if dataMat(i,j) > 0
            BCC.setChordMN(i,j, 'FaceColor',CListC ,'FaceAlpha',.07)
        end
    end
end
[~, N] = max(sum(dataMat > 0, 2));
for j = 1:size(dataMat, 2)
    BCC.setChordMN(N,j, 'FaceColor',CList(N,:) ,'FaceAlpha',.6)
end
Gitee Repository
You can get the code integration package from the Gitee repository:
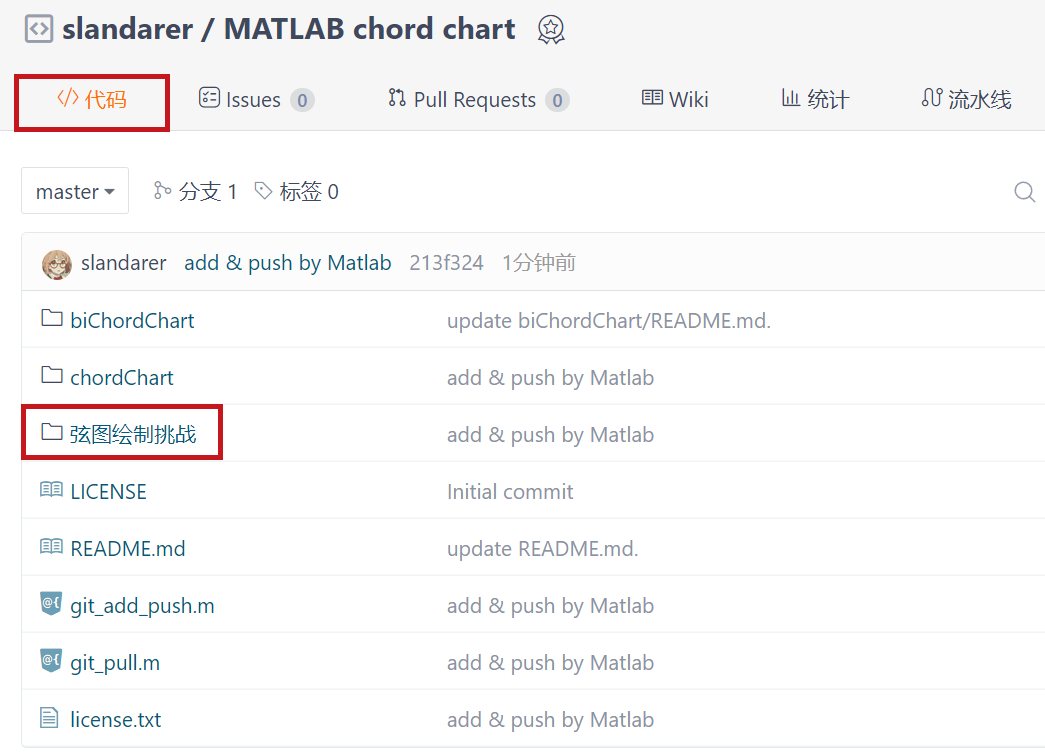
-
https://gitee.com/slandarer/matlab-chord-chart
chordChart Chord Diagram File Exchange
Zhaoxu Liu / slandarer (2023). chord chart chord diagram (https://www.mathworks.com/matlabcentral/fileexchange/116550-chord-chart), MATLAB Central File Exchange. Retrieval source 2023/4/1.
biChordChart Directed Chord Diagram File Exchange
Zhaoxu Liu / slandarer (2023). Digraph chord chart directed chord diagram (https://www.mathworks.com/matlabcentral/fileexchange/121043-digraph-chord-chart), MATLAB Central File Exchange. Retrieval source 2023/4/1.
Without permission, the code cannot be used for any commercial purposes. You can reference the above File Exchange links, and you can change the reference text format when citing, but at least the link should be included.