(Warm reminder: The article is quite long, totaling 3300 words; it is recommended to bookmark it for later reading.)
During automobile maintenance, oscilloscopes are extremely useful, especially when performing non-disassembly diagnostics, troubleshooting analysis, and bus diagnostics, making them indispensable. When combined with other diagnostic tools (such as diagnostic computers, test lamps, multimeters, etc.), they can achieve a twice the result with half the effort.
In the previous two articles, we explained the relevant concepts of oscilloscopes, their connections, and waveform adjustments. I believe everyone has learned to use oscilloscopes by now.
This issue will explain what the waveforms of commonly used sensors in automobiles look like and how we should analyze and judge them.
Before we start, let’s review a previous knowledge point:
In the first article about waveform introduction, we mentioned that the criteria for judging electronic signals are: amplitude, frequency, shape, pulse width, and array as five criteria for judgment.
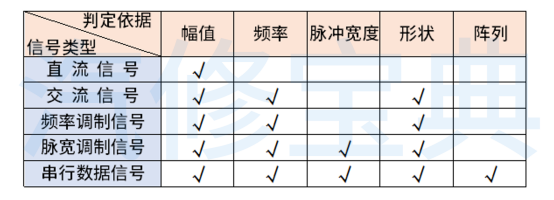
PS:
1. The shape of the signal waveform should not have interruptions, noise, spikes, or other abnormal phenomena.
2. We can also compare multiple sensors/actuators to see if the waveform shapes are consistent (such as fuel injection, ignition, etc.) to determine if a certain sensor/actuator is aging or malfunctioning.
Alright, now let’s return to today’s main content:
There are many types of speed sensors in automobiles, such as crankshaft position sensors, camshaft position sensors, vehicle speed sensors, wheel speed sensors, etc.
However, they mainly fall into two types: electromagnetic and Hall effect. (Photoelectric types are basically no longer used, so they will not be discussed here.)
When analyzing a waveform, to know what it should look like, we must first have a certain understanding of their working principles.
(Here, we will briefly introduce the working principles; if unclear, you may refer to previous articles for more information.)
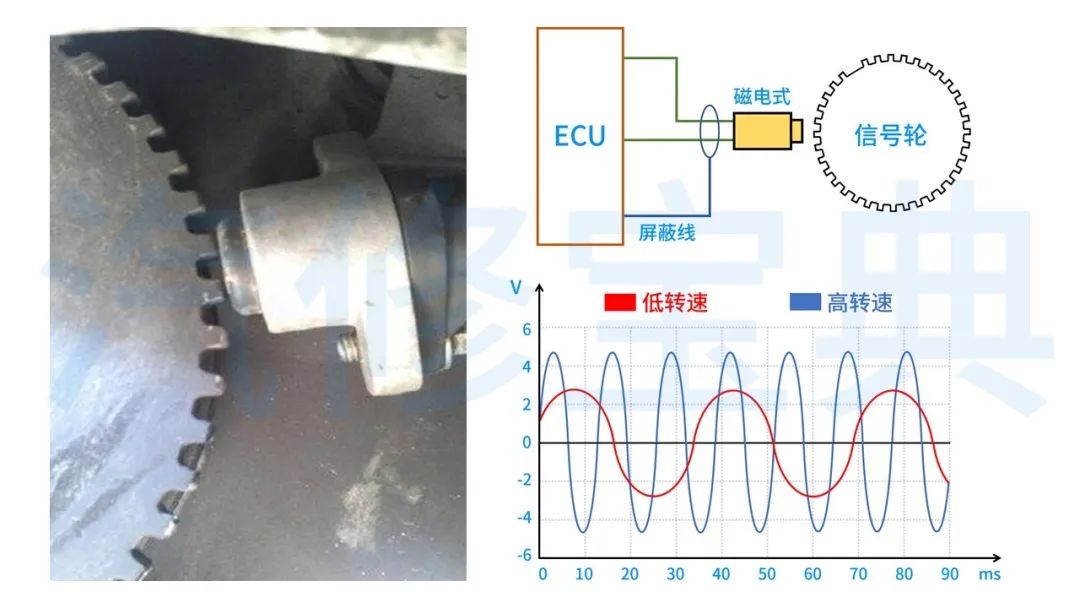
Working Principle:
It can be of two-wire/three-wire types (the three-wire type includes a shielded wire), producing a sine waveform, which is an AC signal. Its waveform frequency and amplitude are related to the speed.
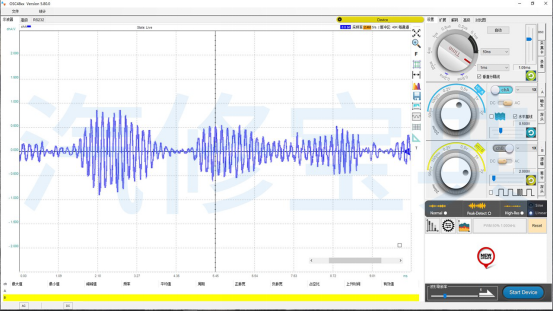
Real Vehicle Waveform:
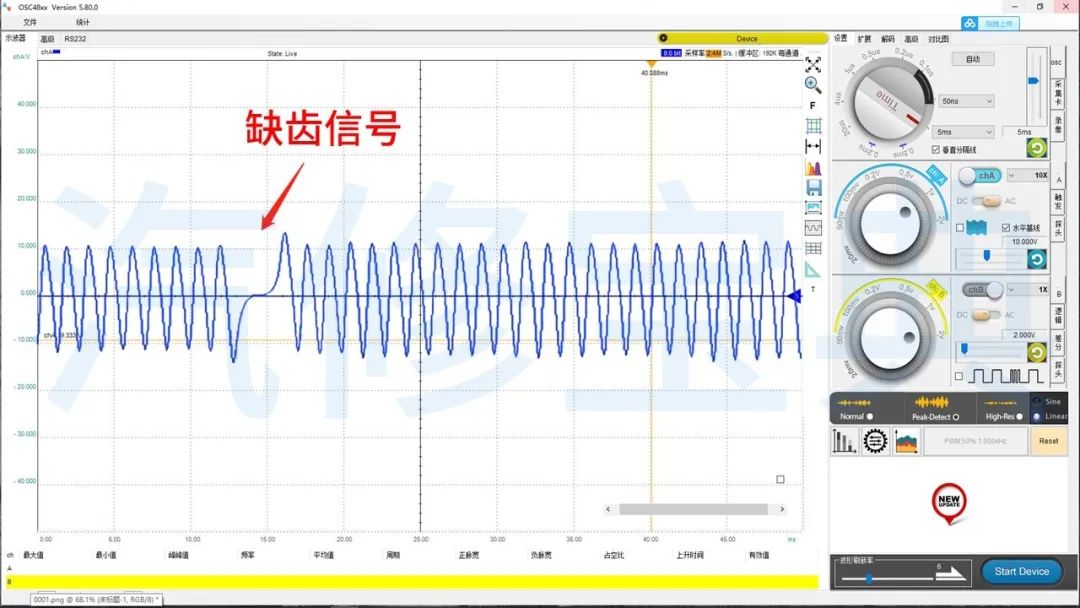
The signal in the above image is from an electromagnetic crankshaft position sensor. We know that to determine the top dead center position of a cylinder, there is a missing tooth on the signal plate, so there is also a missing tooth signal on the waveform.
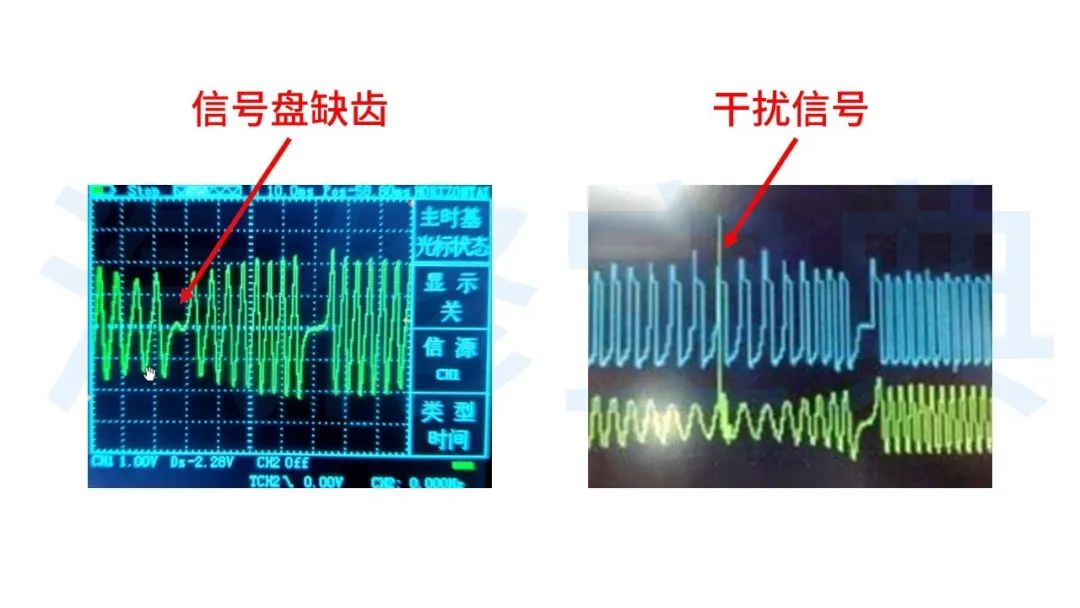
Waveform Analysis:
When analyzing this type of waveform, because it is an AC signal, we need to check whether its frequency, amplitude, and shape are consistent. As shown in the figure below, there are two faulty waveforms.
Working Principle:
It has three wires: one for power (5V or 12V), one for ground, and one for the signal line. The signal it produces is a square wave signal. Its waveform frequency is related to the speed, while the duty cycle and amplitude remain unchanged.
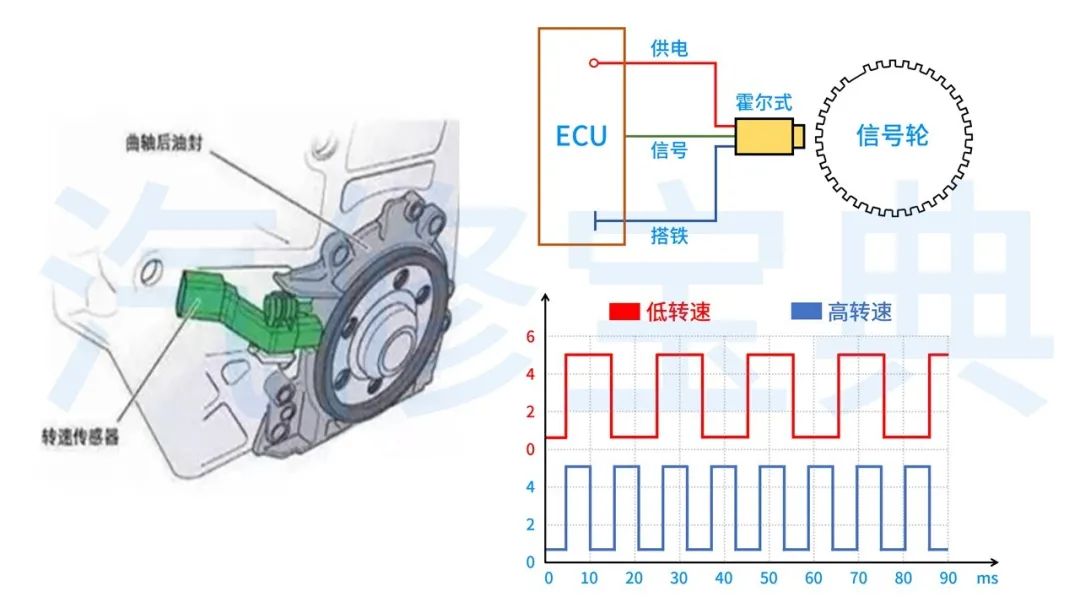
Real Vehicle Waveform:
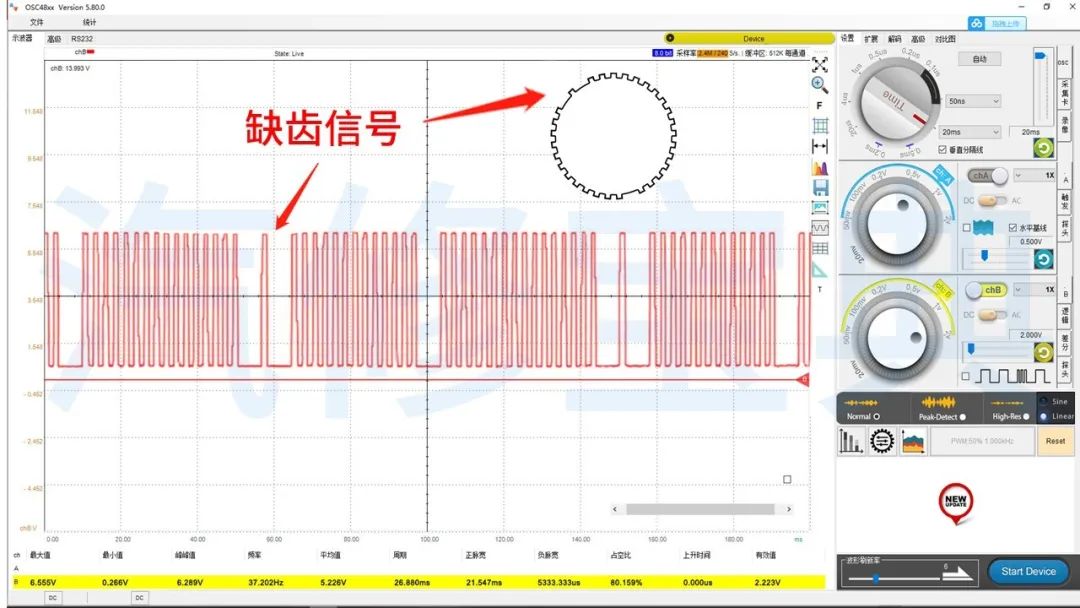
The image above shows the signal from a Hall effect crankshaft position sensor. Similarly, it has a missing tooth signal to determine the exact position of the crankshaft.
Waveform Analysis:
When analyzing it, do not assume that having multiple missing tooth signals means that its signal plate is missing teeth; in some vehicle models, the signal plate itself may have multiple missing teeth. Therefore, do not jump to conclusions without a thorough understanding.
This waveform, being a frequency-modulated signal, should also be analyzed based on its amplitude, shape, and frequency.
If there are inconsistencies in amplitude, different duty cycles, varying frequencies, noise, or missing tooth signals, it indicates that the current sensor or signal wheel has issues.
Common position sensors in automobiles include throttle position sensors, accelerator pedal position sensors, fuel level sensors, and EGR position sensors, etc.
Here, we will take the throttle position sensor as an example for explanation:
Working Principle:
Depending on the vehicle model, the number of wires for the throttle position sensor varies, mainly divided into one internal position sensor and two position sensors. Most recent models generally have two. The image below shows a three-wire throttle position sensor:
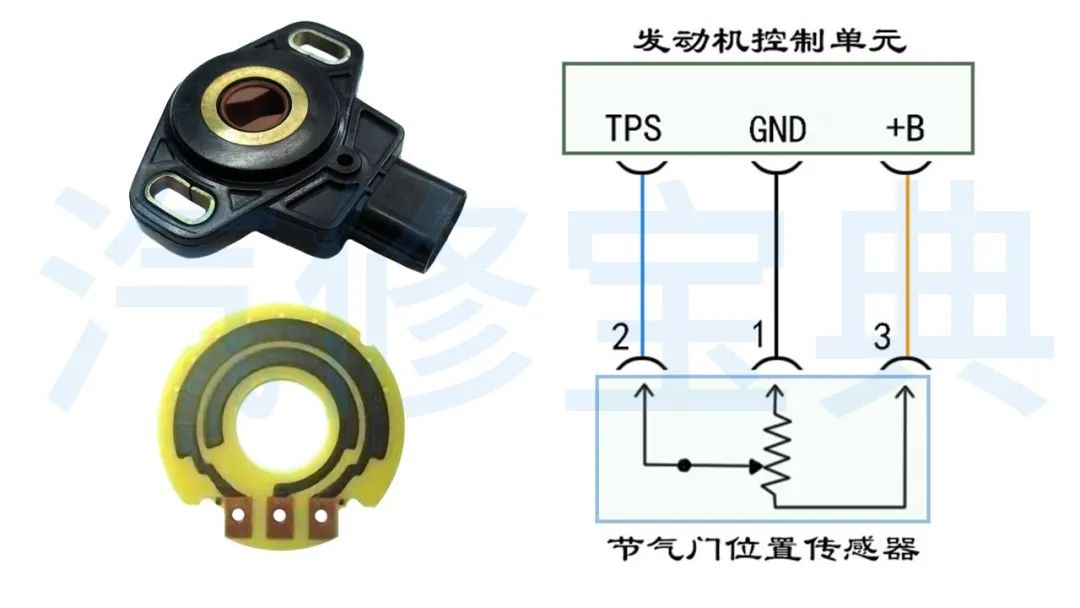
Its three wires are power, ground, and signal line. The size of the signal voltage depends on the position of the sliding arm (i.e., the opening of the throttle).
When the throttle rotates, it drives the sliding arm of the throttle position sensor (a variable resistor) to rotate, and its signal voltage changes with the throttle’s rotation.
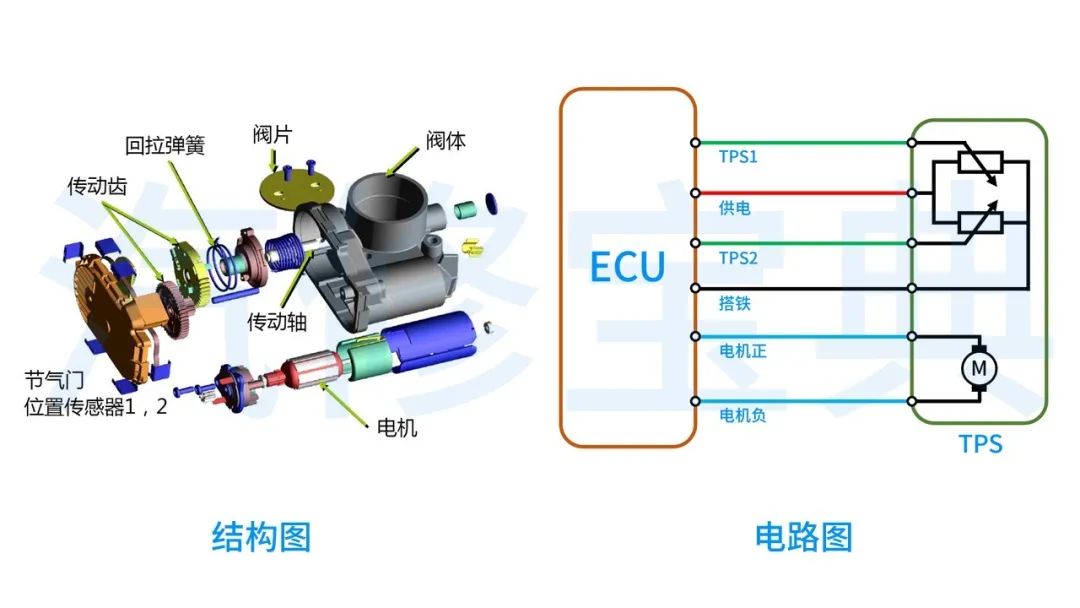
From the image above, we can see that the two throttle position sensors share power and ground, then two throttle position sensor signals are sent to the ECU.
Real Vehicle Waveform:
When measuring the waveform, we can gradually press the accelerator to full throttle, hold it for 1-2 seconds, and then release the accelerator.
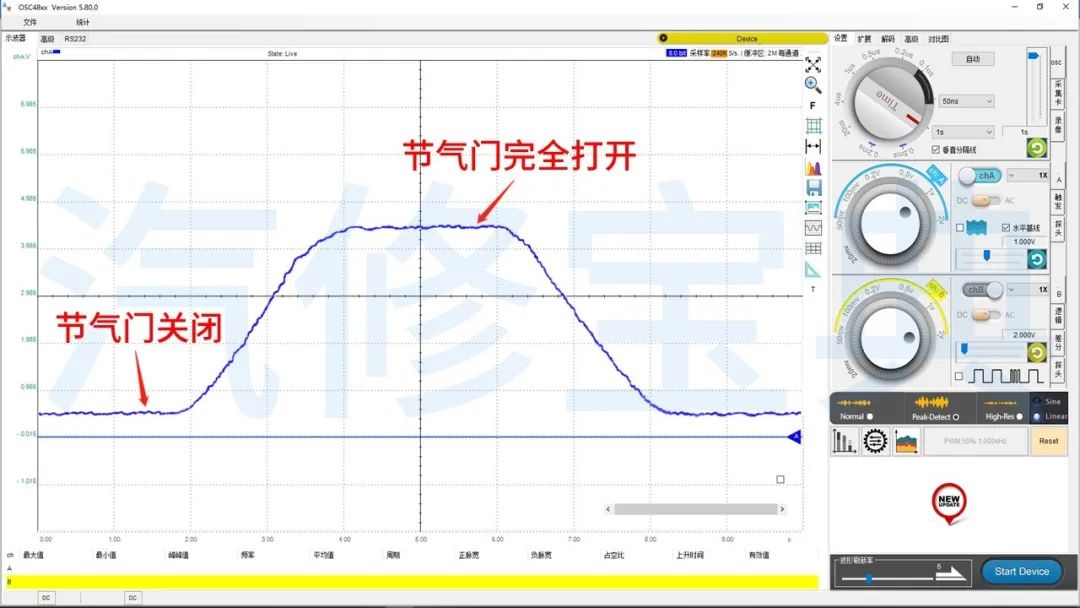
Waveform Analysis:
This voltage signal is a DC signal, and its signal voltage varies according to the throttle opening (it is recommended to press the accelerator while the engine is running; pushing the throttle plate manually is not recommended). When analyzing, we mainly focus on its amplitude.
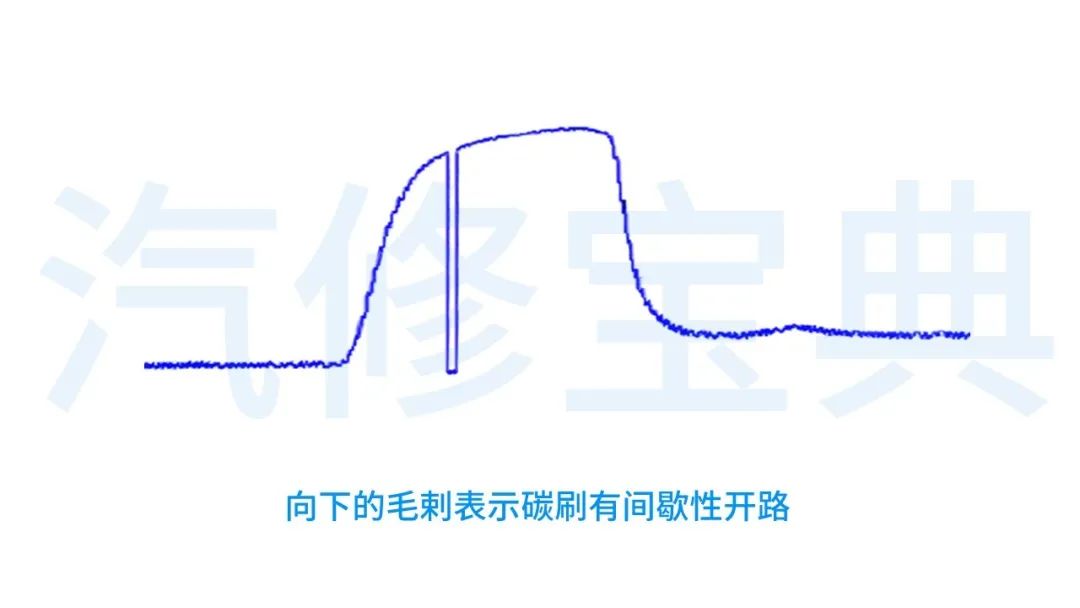
The signal waveform should not have interruptions, sudden changes, or other abnormal phenomena when gradually pressing the accelerator pedal.
Additionally, we can analyze by comparing the characteristics of other sensors at the same location on the vehicle, as shown in the image below:
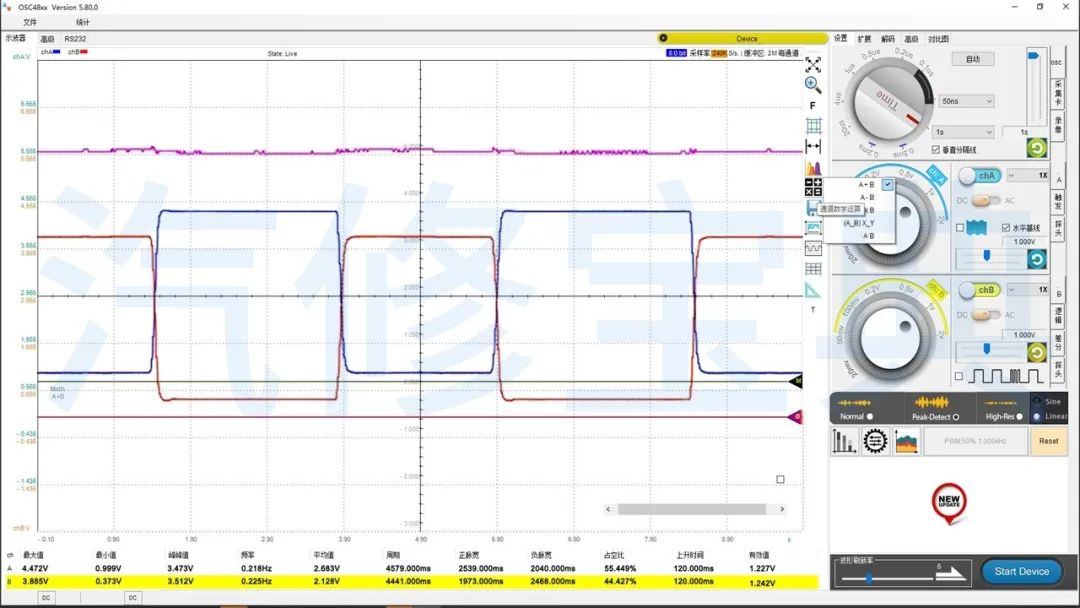
We can see that the signal voltage increase between throttle position sensor TPS1 and TPS2 is opposite; through the logical operation function of the oscilloscope, we can see that the sum of the voltages from the two position sensors is around 5V (pink line). This is one of their characteristics, so when analyzing, we can also refer to their characteristics.
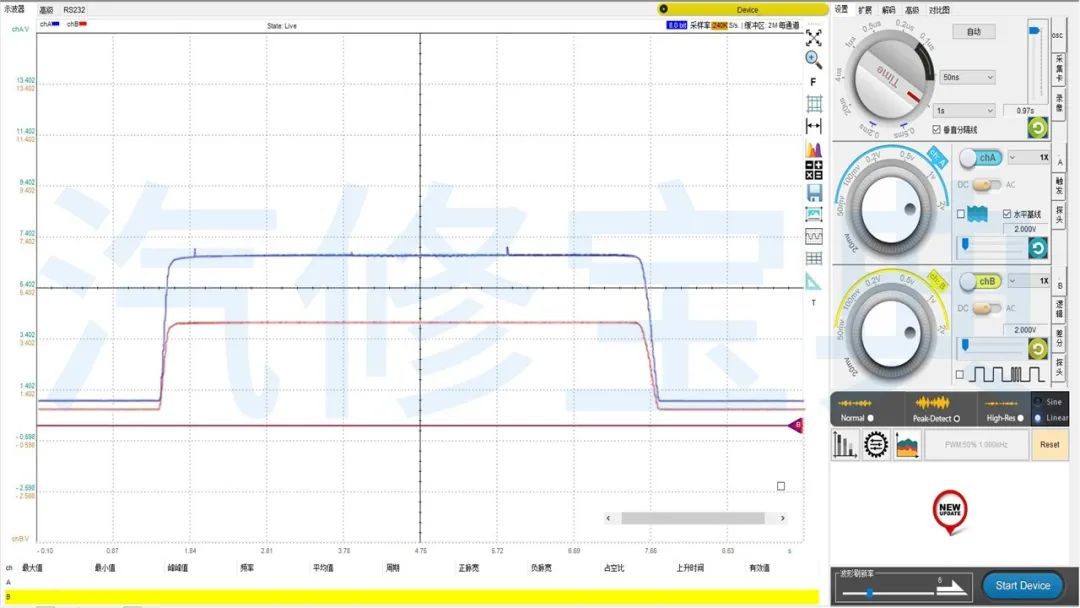
For those with two or more sensors, we should understand their relationship, as shown in the image below, where the voltage between accelerator pedal position sensor 1 and accelerator pedal position sensor 2 is basically in a two-to-one relationship. (This characteristic may vary by model.)
Common temperature sensors in automobiles include water temperature sensors, intake temperature sensors, oil temperature sensors, etc.
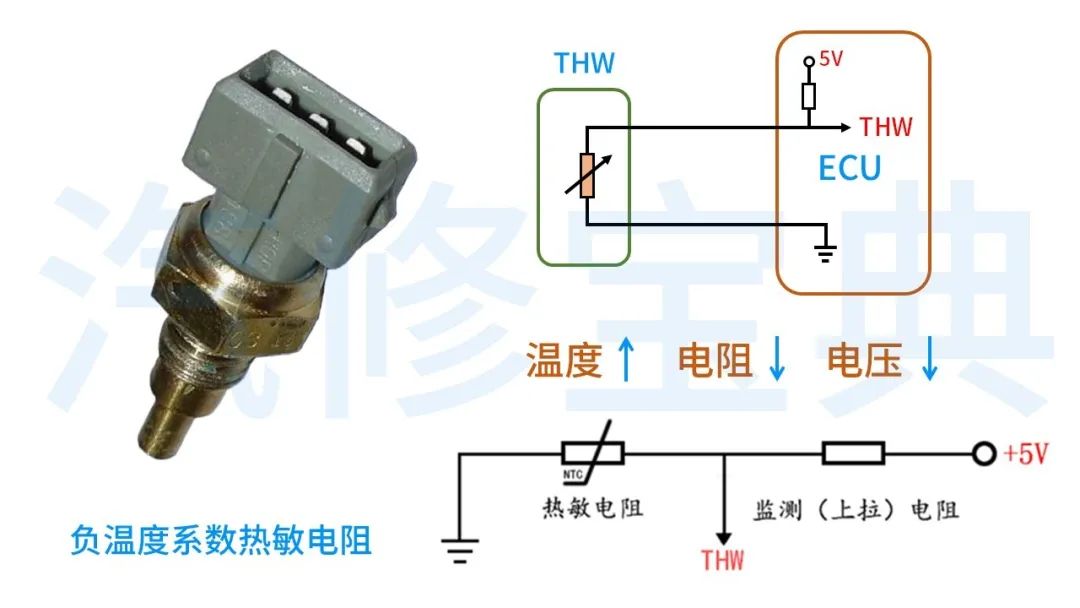
Working Principle:
We all know that the water temperature sensor is a negative temperature coefficient thermistor (i.e., the higher the temperature, the lower its resistance), and its power line is also the signal line (the power internally has a monitoring resistor, which is equivalent to monitoring the voltage between two resistors). The three-wire water temperature sensor consists of two temperature sensors combined.
Real Vehicle Waveform:
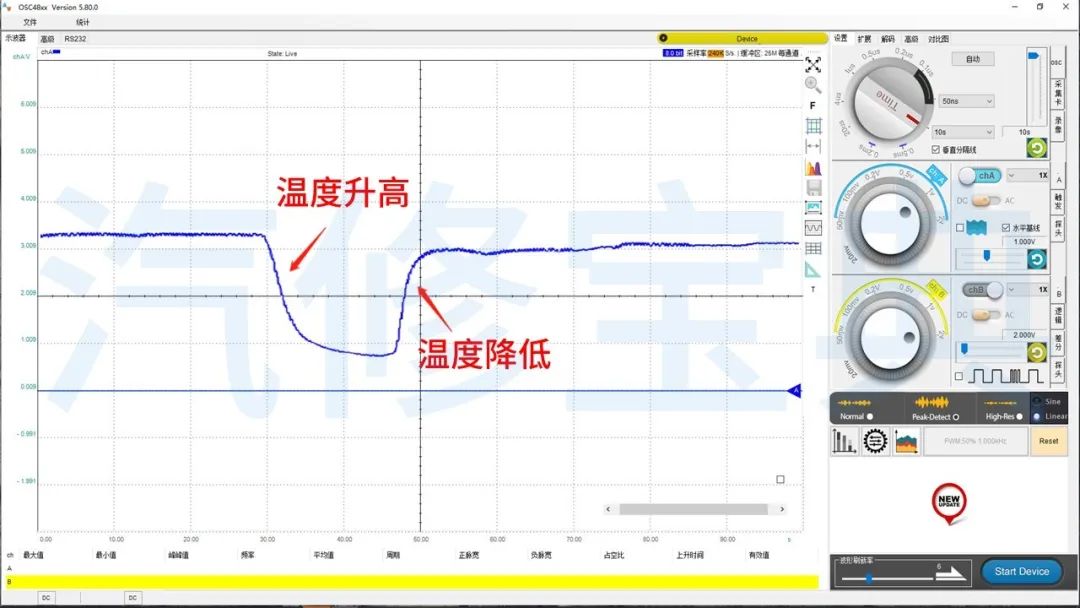
The above image shows the signal waveform of the water temperature sensor.
Waveform Analysis:
Its signal voltage is also a DC voltage. Besides analyzing their amplitude, we should more often rely on the characteristics of the sensor, heating and cooling it to see if the signal waveform changes accordingly.
Common pressure sensors in automobiles include intake pressure sensors, fuel pressure sensors, oil pressure sensors, etc.
Working Principle:
Intake pressure sensors mainly include pressure-sensitive resistor type and capacitive type, here we will take the pressure-sensitive resistor type as an example.
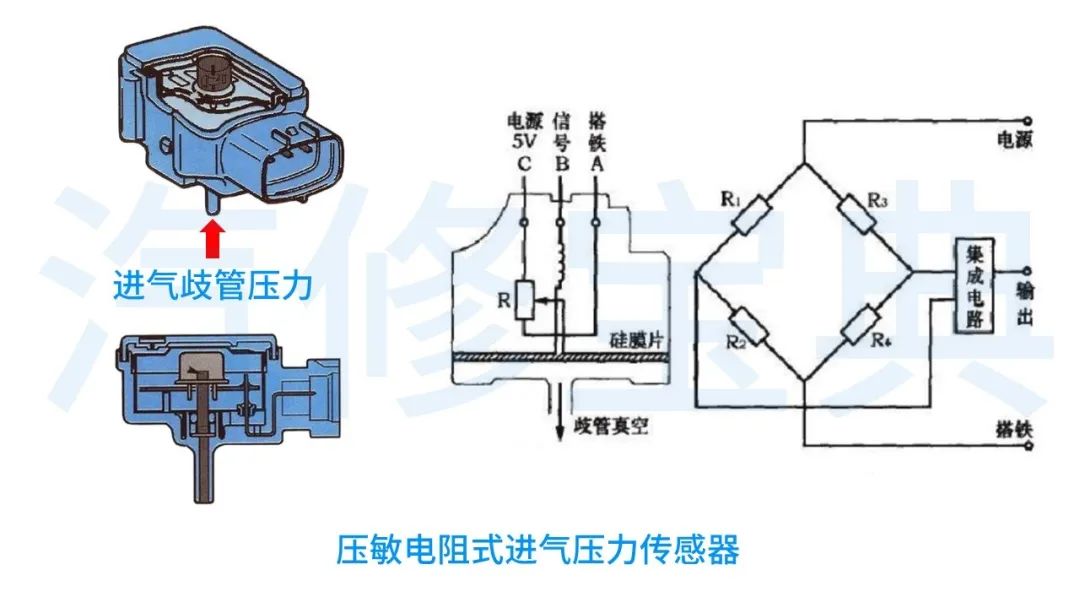
As shown, the Wheatstone bridge formed by strain resistors R1-R4 is connected to the silicon diaphragm. When the intake manifold pressure changes, the silicon diaphragm deforms; the higher the absolute pressure, the greater the deformation of the silicon diaphragm, and the resistance value of R changes more, thus converting the mechanical change of the silicon diaphragm into an electrical signal, which is then amplified by the integrated circuit and sent to the ECU, which determines the current pressure in the intake manifold based on the output signal voltage.
Real Vehicle Waveform:
Similarly, when measuring this waveform, acceleration and deceleration operations are required.
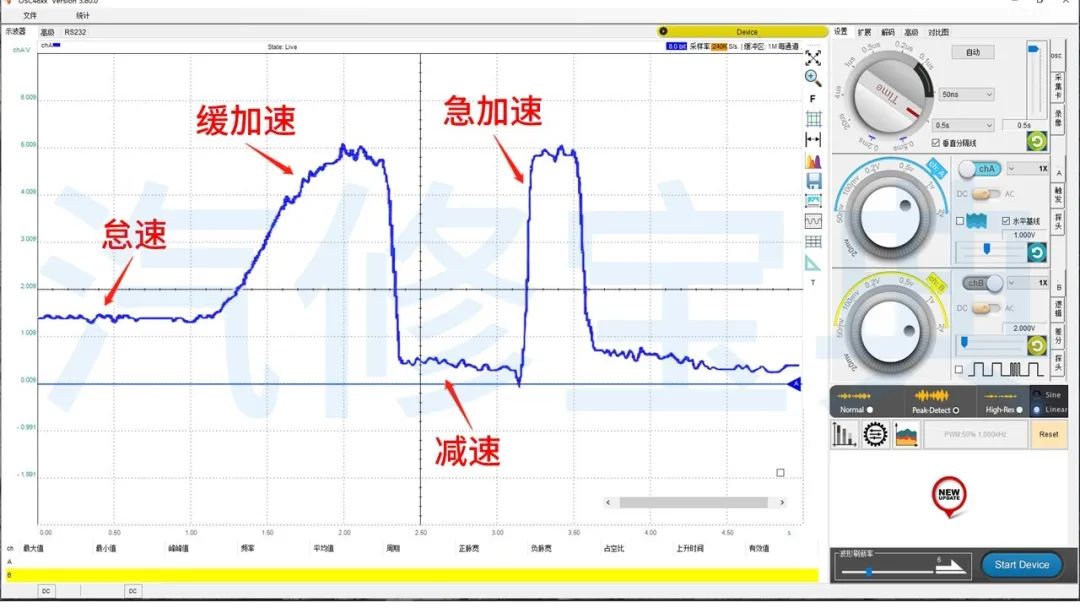
Waveform Analysis:
Its signal voltage is also a DC voltage signal. When analyzing, we can see:
1. At idle, it is around 1.3V;
2. During rapid acceleration, the waveform rises vertically, indicating good sensor sensitivity;
3. During rapid acceleration, if the waveform drops below 1V, the closer it gets to 0V, the better the engine’s vacuum.
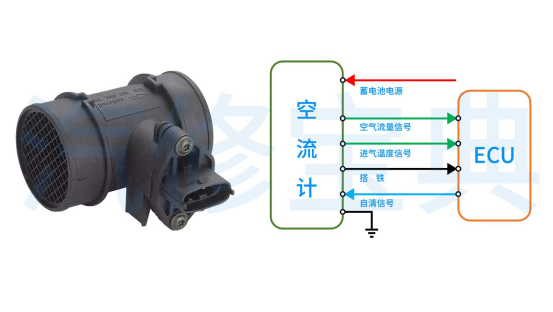
The main flow sensor in automobiles is the air flow sensor.
Working Principle:
In previous articles, we have discussed that air flow meters mainly include vane type, hot wire/hot film type, and Karman vortex type, etc. They output a voltage signal (air flow) to the ECU based on the amount of intake air.
Real Vehicle Waveform:
Similarly, we need to measure the idle, rapid acceleration, and gradual acceleration waveforms; it is a DC voltage signal.
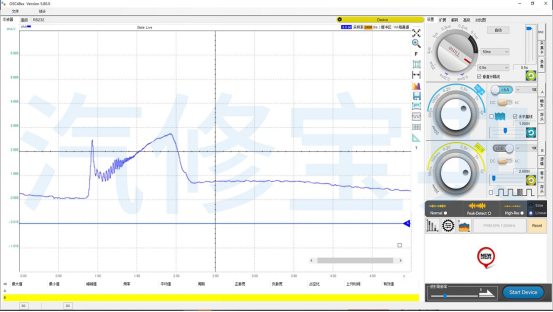
Waveform Analysis:
When testing, the signal should not have interruptions, sudden changes, or other abnormal phenomena.
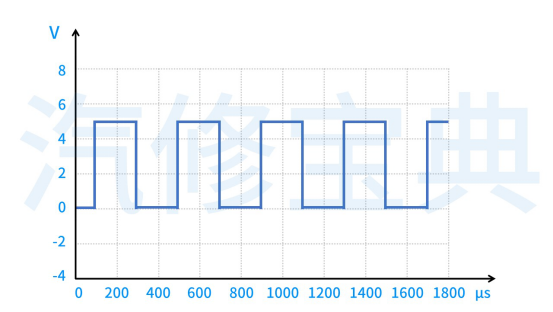
If it is a digital signal air flow meter, the output signal waveform is as follows, which is a frequency-modulated signal. The frequency is related to the model and vehicle status (for example, for the Buick Excelle, at idle it is 1000Hz, and when the accelerator is fully pressed, it is around 4000Hz).
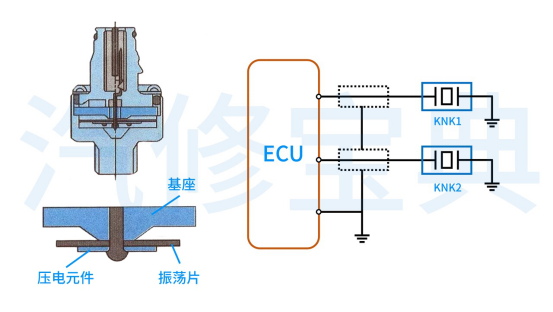
Working Principle:
When the engine vibrates, the oscillating plate inside the knock sensor vibrates, and the force generated by the vibration acts on the piezoelectric element, which converts the pressure signal into a voltage signal sent to the ECU.
Real Vehicle Waveform:
Waveform Analysis:
We can see that its signal is an AC voltage signal; the greater the vibration, the higher the voltage peak and frequency. Since this sensor is very difficult to damage, we generally only need to check whether there is a signal output.
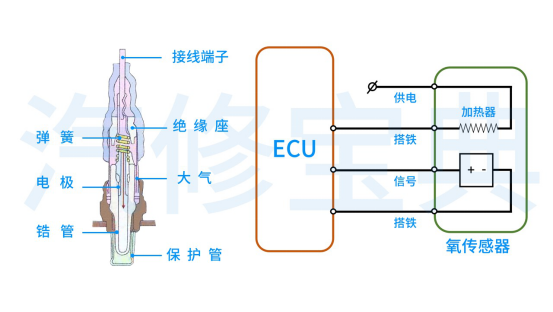
Working Principle:
There are many types of oxygen sensors; here we will take the four-wire zirconia oxygen sensor as an example. Since the oxygen sensor does not provide accurate signals until it reaches a specific temperature (above 300℃), it has a heating wire inside to achieve rapid heating of the oxygen sensor.
Additionally, the oxygen sensor generates a voltage by monitoring the oxygen content inside and outside.
Real Vehicle Waveform:
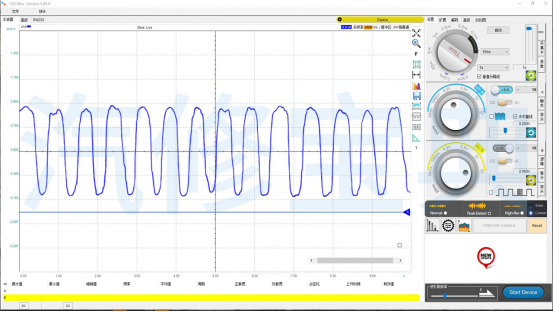
Waveform Analysis:
1. The normal range for oxygen sensors is about 0.1~0.9V (after prolonged use, the sensitivity of the oxygen sensor decreases, and the voltage tends to stabilize, such as between 0.2~0.8V).
2. The lower the oxygen content in the exhaust, the higher the voltage; the higher the oxygen content, the lower the voltage (high indicates a rich mixture; low indicates a lean mixture).
3. The number of changes should not be less than 8 times within 10 seconds.
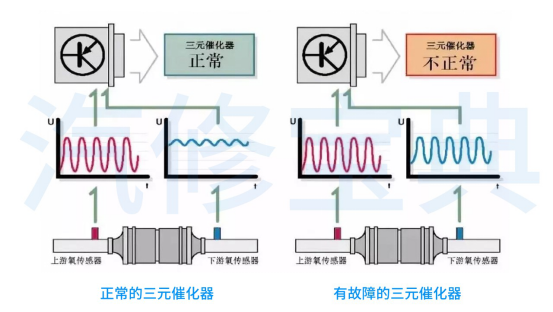
Additionally, we can compare the waveforms of the front and rear oxygen sensors to determine if the catalytic converter is functioning properly.
In conclusion, to quickly determine faults through waveforms, in addition to analyzing amplitude, frequency, pulse width, shape, and array, it is essential to be familiar with the working principles of sensors, signal types, and to observe waveform changes by simulating or operating corresponding components as needed.
I believe everyone wants to have standard waveforms for reference when analyzing waveform faults.
Here, I would like to share an experience from my repair process: during daily repairs, frequently read and record the correct waveforms of sensors for various vehicle models, and then analyze and understand them.
Besides providing a basis for future comparisons, this will also lay a solid foundation for subsequent analyses.
That concludes today’s content. In the next article, I will bring you knowledge related to actuators and buses.
If you find this article helpful, don’t forget to give a “like” and “see more” to let me know you’re reading. If you have any questions, feel free to leave a message for discussion.
