Hello everyone, in this video we will introduce the most commonly used Lissajous measurement method in X-Y mode.
First, we will connect two sine wave signals with the same frequency but different phases to Channel 1 and Channel 2. After capturing the waveform, you can see that the phase difference between the two signals is 0 degrees.
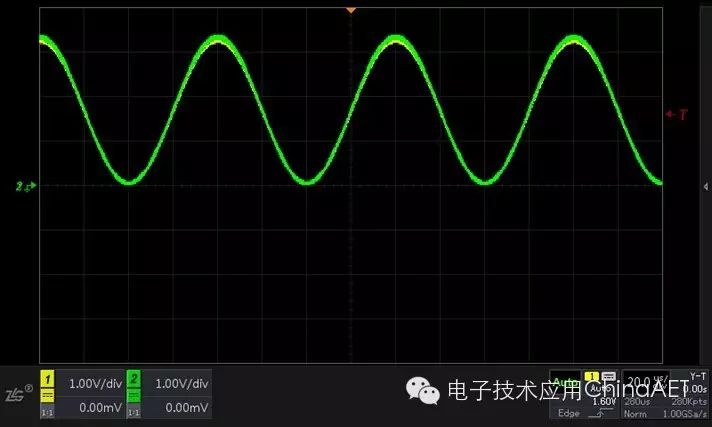
Figure 1 Phase Difference of 0 Degrees (Y-T)
We set the time base mode to X-Y mode, and observe that the composite waveform in X-Y mode forms a line at a 45-degree angle.
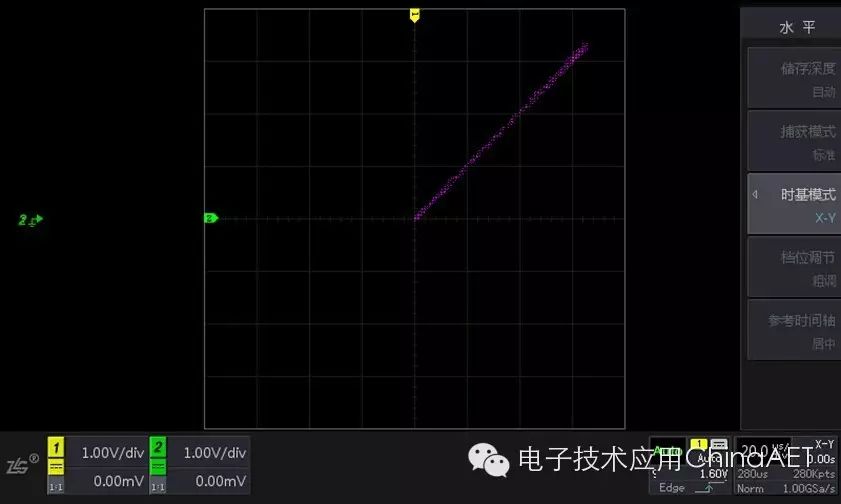
Figure 2 X-Y Mode
Next, when we adjust the phase difference between the two signals to 45 degrees, we can see that the waveform in X-Y mode becomes an ellipse.
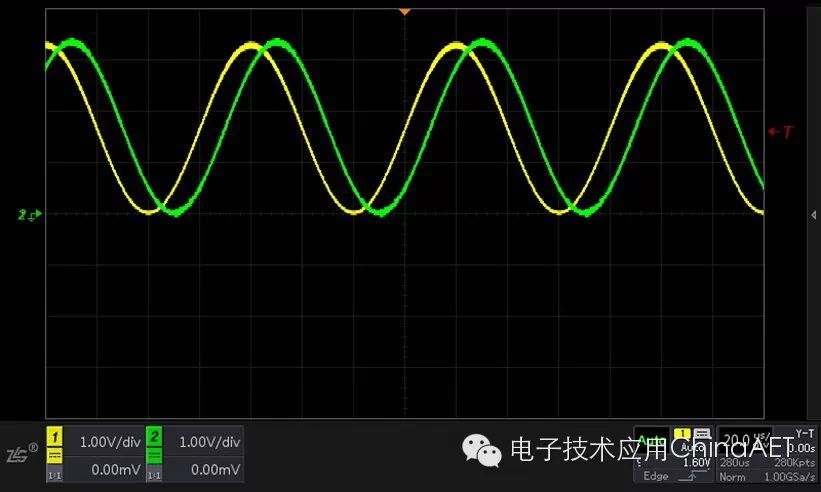
Figure 3 Phase Difference of 45 Degrees (Y-T)
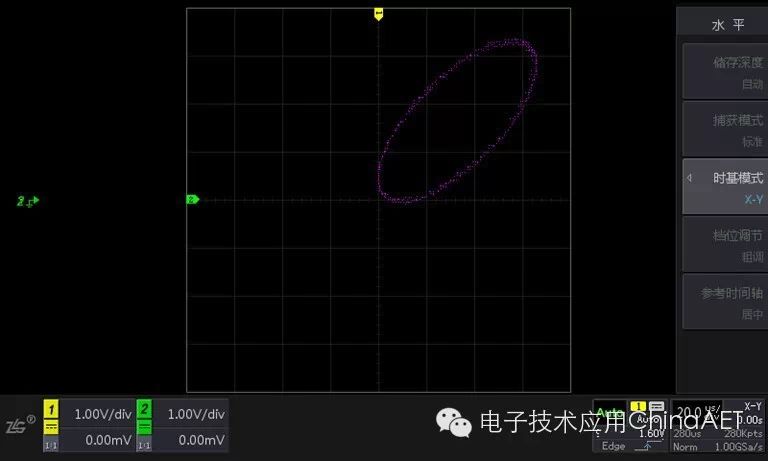
Figure 4 X-Y Mode
When the phase difference is 90 degrees, the waveform in X-Y mode becomes a circle.
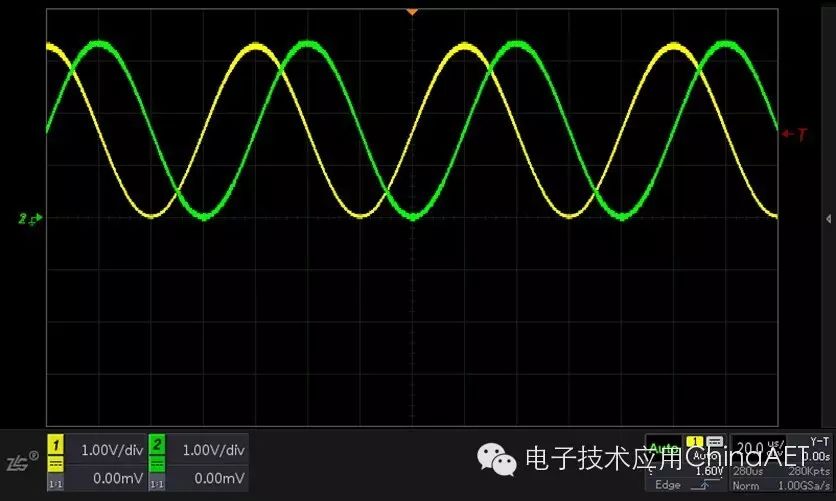
Figure 5 Phase Difference of 90 Degrees (Y-T)
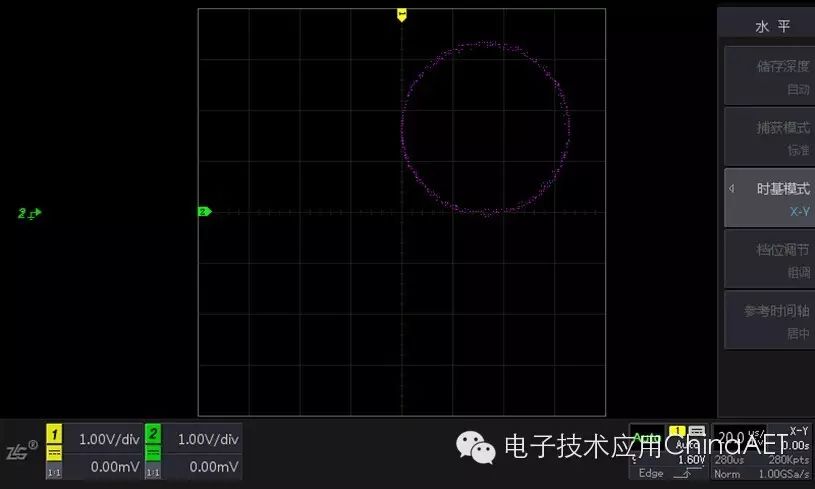
Figure 6 X-Y Mode
When the phase difference is 180 degrees, the waveform in X-Y mode is a line at -45 degrees.
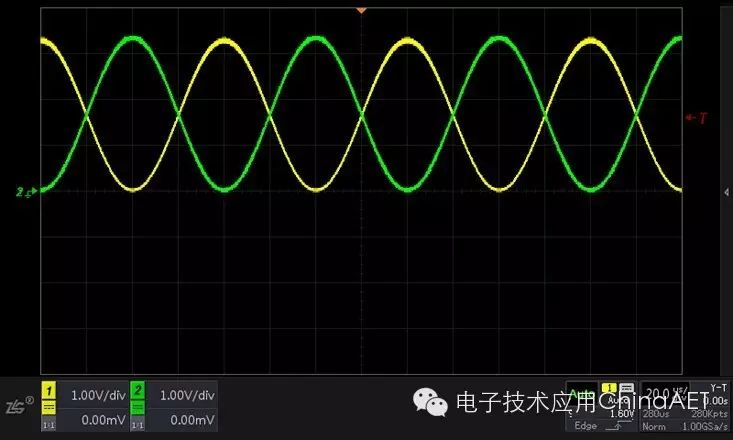
Figure 7 Phase Difference of 180 Degrees (X-Y)
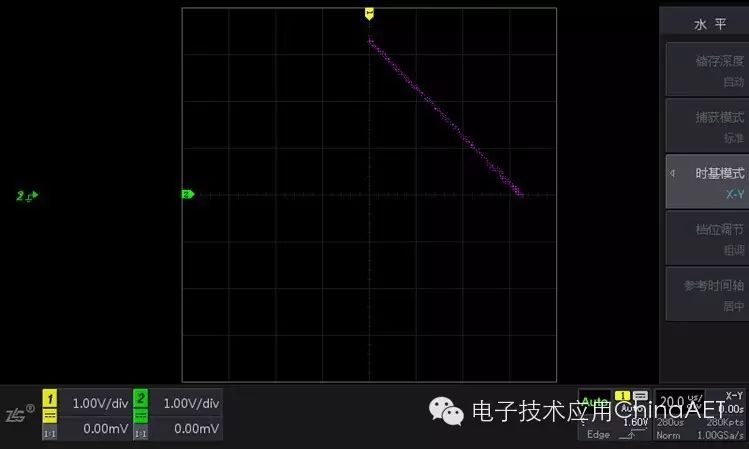
Figure 8 X-Y Mode
This means that as the phase difference between the two signals changes, the composite waveform in X-Y mode continuously varies. By observing the shape of the waveform in X-Y mode, we can determine the phase difference of the input signals in the two channels. For non-special shapes, we can use formulas to calculate the phase difference, such as sinθ=a/b or c/d.
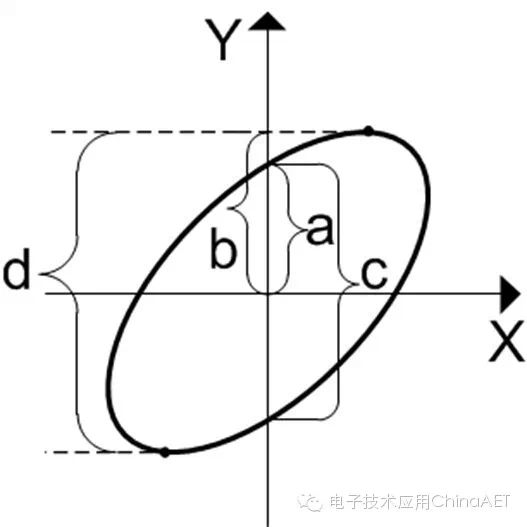
Figure 9 Schematic of X-Y Mode
This is the commonly used Lissajous method, mainly used to measure the phase difference between signals of the same frequency.
In addition, X-Y mode is also used for component testing, such as plotting the current-voltage characteristic curve of a diode. It can also directly measure the voltage transfer characteristics of integrated operational amplifiers, effectively replacing transistor graphic testers. In fact, X-Y mode can be conveniently used for measurement in any situation involving two interrelated physical quantities, such as using various sensors to display relationships like flow-pressure and voltage-frequency curves on the oscilloscope screen. If the two input signals do not have a linear frequency relationship, a stable graphical display will not be obtained.