1. Vitamin K Effectively Inhibits Ferroptosis in Cells
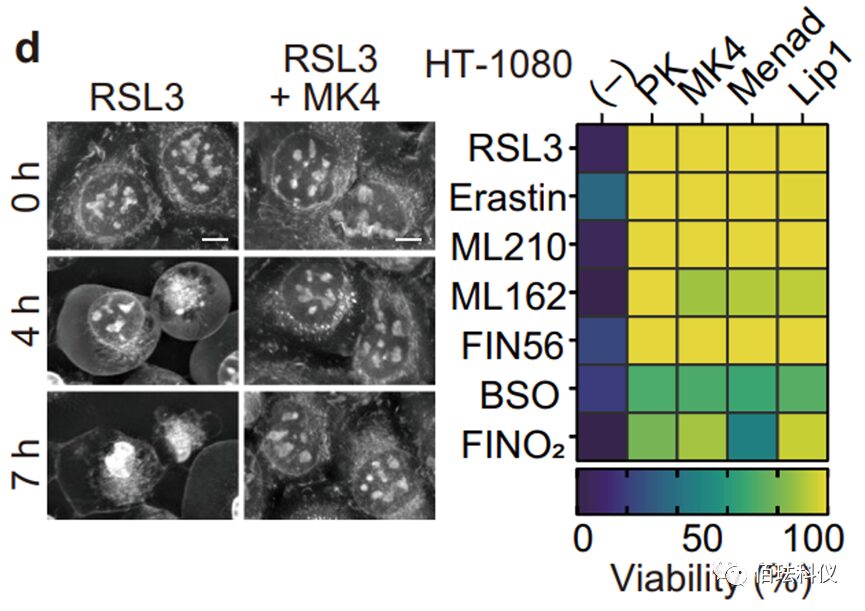
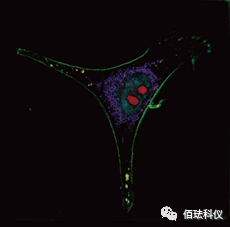
Fig.1: Images of HT-1080 cells treated with RSL3 (ferroptosis activator) without MK4 (methyl-naphthoquinone) and with MK4 (0.5 µM). Refer to Video 1 and Video 2. Scale bar = 10 μm. The right image shows the survival ability of HT-1080 cells treated with the indicated compounds and ferroptosis inducers. Phylloquinone (3 µM), MK4 (3 µM), Menadione (3 µM), or Lip1 (0.5 µM) were added 1 hour before the inducers.
Video 1 and Video 2: HT-1080 cells (80,000 cells) were seeded in a 35mm µ-plate and incubated overnight. The next day, after adding 0.5 µM RSL3 for 1 hour, 3 µM MK4 was added to the experimental group (Video 2), while the control group (Video 1) did not receive MK4. Live cell imaging was then performed using the 3D Cell Explorer and Eve software v1.8.2 (Nanolive).
Article link:
https://doi.org/10.1038/s41586-022-05022-3
2. FSP1 Phase Separation Promotes Ferroptosis Mechanism

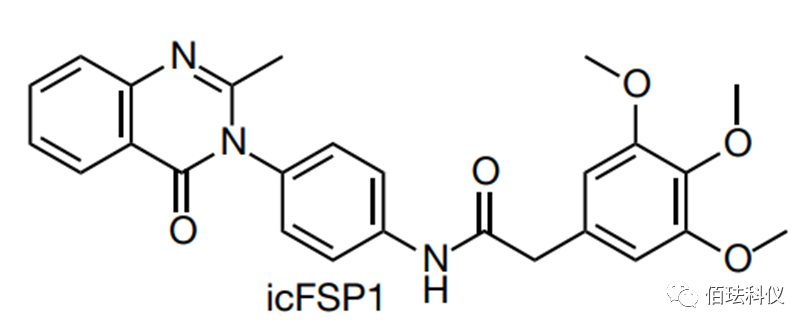
Fig.1: Chemical structure of icFSP1.
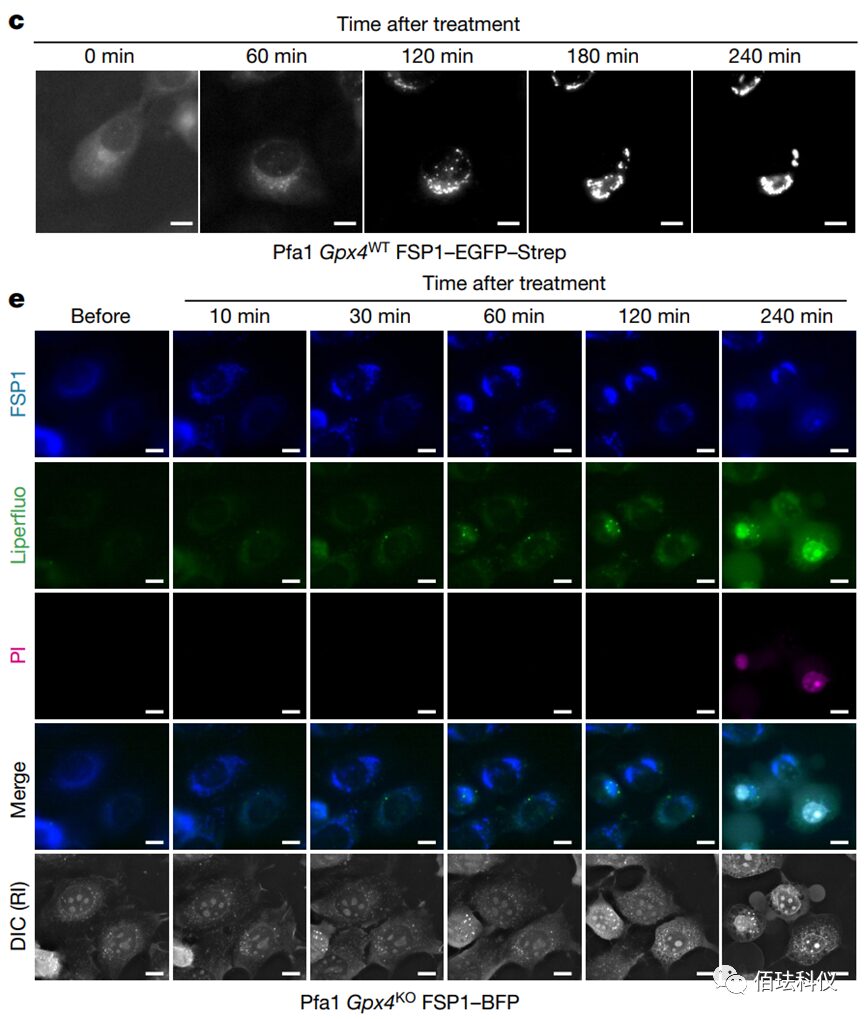
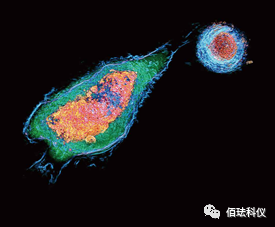
Fig. 2: Representative delayed fluorescence images obtained after treating wild-type Gpx4 Pfa1 cells stably overexpressing hFSP1-EGFP-Strep with 2.5 µM icFSP1. Scale bar = 10 µm. Refer to Video 3.
Video 3: Representative delayed fluorescence images obtained after treating wild-type Gpx4 Pfa1 cells stably overexpressing hFSP1-EGFP-Strep with 2.5 µM icFSP1. The images show that before treatment with icFSP1, FSP1 was diffusely distributed in the cells; after treatment, FSP1 began to cluster, and the longer the treatment time, the more pronounced the clustering of FSP1. This indicates that icFSP1 affects the distribution of FSP1.
Video 4: Representative delayed fluorescence images before and after treating Gpx4 knockout Pfa1 cells stably overexpressing hFSP1-mTagBFP with 10 µM icFSP1. To test whether the change in hFSP1 subcellular localization would lead to ferroptosis, the authors established Gpx4 gene knockout Pfa1 cells that stably overexpressed hFSP1-BFP signal fused with blue fluorescent protein (BFP), using Liperfluo (a lipid peroxide sensor) and propidium iodide co-staining for live cell imaging to monitor, which can only stain the nucleus when the plasma membrane ruptures (i.e., marking ferroptotic cells). After treating the cells expressing hFSP1-BFP with icFSP1, punctate formation of FSP1 (blue fluorescence) was directly induced, followed by a gradual increase in lipid peroxide signals labeled by Liperfluo (green fluorescence) until the cells were marked by propidium iodide (PI, 0.2 µg/ml) (purple). This indicates that the change in FSP1 subcellular localization precedes lipid peroxidation and ferroptosis.
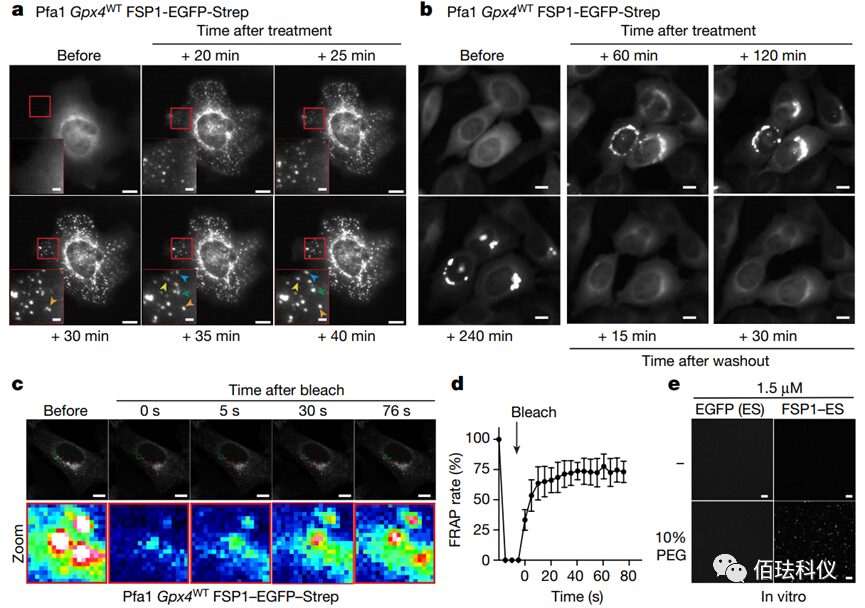
Fig. 3: Representative delayed fluorescence images before and after treating wild-type Gpx4-Pfa1 cells overexpressing hFSP1-EGFP-Strep with 2.5 μM icFSP1. Scale bar = 10 μm (2 μm for magnified images). Arrows indicate the fusion of individual condensates. Refer to Video 5.b. The reversibility of hFSP1 condensates. Representative delayed fluorescence images before and after treating wild-type Gpx4 Pfa1 cells overexpressing hFSP1-EGFP-Strep with 2.5 μM icFSP1. After treating the cells with icFSP1 for 240 minutes, the medium was replaced with fresh medium without icFSP1, and recording was resumed. Scale bar = 10 μm. Refer to Video 6.
Video 5: Representative delayed fluorescence images before and after treating wild-type Gpx4-Pfa1 cells overexpressing hFSP1-EGFP-Strep with 2.5 μM icFSP1. The images show that after treating the cells with icFSP1, the punctate FSP1 clusters can merge over time. This indicates that these puncta have fluid characteristics.
Video 6: The plasticity of FSP1 condensates. Aggregated condensates disappear and revert to a diffuse state after washing away icFSP1, further indicating their fluidity.
Video 7: FRAP detection after treating Gpx4WT Pfa1 cells overexpressing hFSP1-EGFP-Strep with 2.5 μM icFSP1 for 120 minutes. Fluorescence recovery is observed after bleaching, indicating that molecules inside FSP1 droplets can freely exchange with externally diffused FSP1, indicating a fluid state.
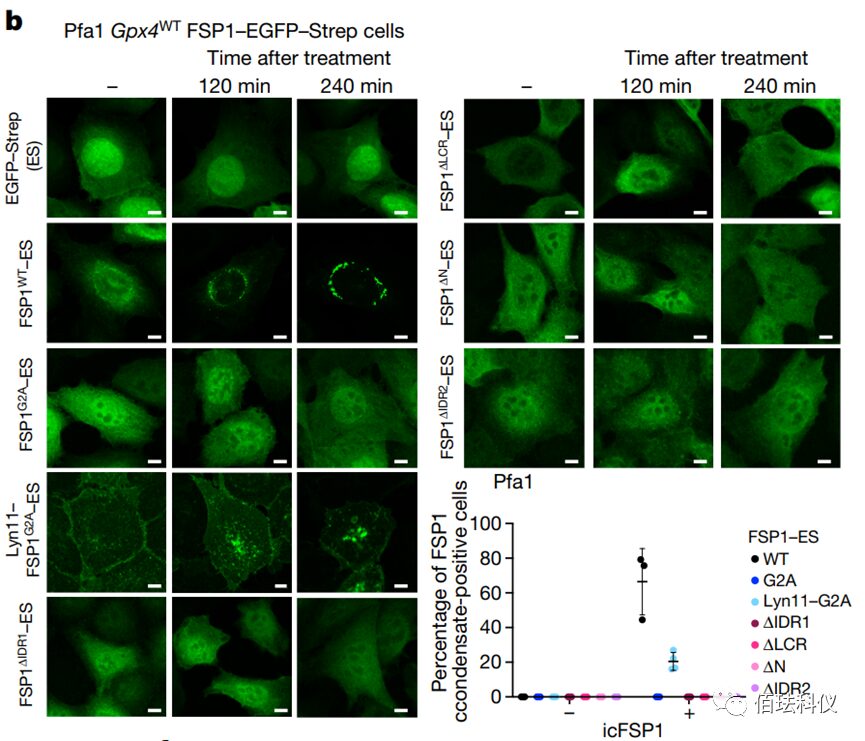
Fig. 4: Representative images of Pfa1 cells expressing hFSP1-EGFP-Strep mutant treated with 2.5 μM icFSP1. (After icFSP1 treatment, only wild-type hFSP1 and Lyn11-hFSP1G2A changed their subcellular localization to form hFSP1 condensates; no other mutants formed hFSP1 condensates after icFSP1 treatment, indicating that only FSP1 with a membrane localization sequence can undergo phase separation.) Scale bar = 10 μm.
Article link:
https://doi.org/10.1038/s41586-023-06255-6
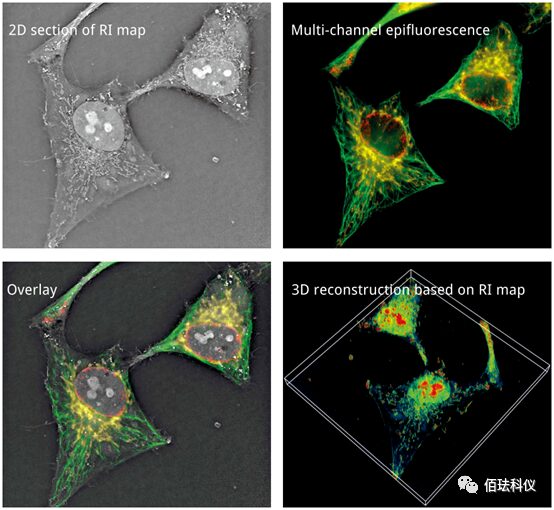
Nanolive has the following features:
1. Label-free live cell imaging solutions

2. Software—3D image acquisition, construction, and digital staining software
3. Software—cell function analysis software
(Label-free dynamic analysis of subcellular structures—mitochondria + lipid bodies)
(Label-free dynamic analysis of the cytoskeleton)
1. Observation and analysis of microbial infection in cells
2. Observation and analysis of the cell cycle
3. Analysis of drug mechanisms
4. Research on yeast cell division
5. 3D cell culture
6. Study of autophagy
7. Research on nanomaterials development
8. Observation of subcellular localization
9. Analysis of GFP or RFP transfection
10. H&E and HF detection without staining
11. Botanical research
12. Analysis of cell interactions
13. Research on apoptosis and mechanisms of cell death
14. Molecular co-localization analysis
15. Non-invasive identification of CTC cells
16. Tracking of microvesicles
17. Environmental biology