
Big Data Digest authorized reprint from CaiJ Learning Python
Author: J Brother
Recently, the “explosion” incident of Eggshell Apartments has continued to ferment. During this period, due to rent arrears to landlords and refunds to tenants, Eggshell Apartments has fallen into a debt collection storm. In many places across the country, there have been mass contract termination events related to Eggshell Apartments, and as the headquarters of Eggshell Apartments, Beijing is naturally at the forefront.
In response to the large-scale contract terminations, Beijing has set up over 100 reception points for disputes related to Eggshell Apartments throughout the city, covering 12 districts involved with Eggshell Apartments. These reception points have been established at the street and even community levels to facilitate landlords and tenants involved in Eggshell Apartments events to consult and resolve disputes.
The collapse of long-term rental apartments has forced many young people to become homeless, representing another economic reflection under the pandemic. The direction of the situation is worth paying attention to. This article approaches the issue from a data perspective, scraping a total of 6025 apartment data from the Beijing area of Eggshell Apartments, cleaning the data, and conducting visual analysis to provide a new perspective for understanding Eggshell Apartments.
Data Acquisition
The structure of the Eggshell Apartments webpage is relatively simple, and the data structure is uniform, allowing for simple URL pagination construction. It is important to note that a very small number of pages may return 404 errors, which need to be filtered out. This article uses requests to obtain data, parses the returned data using XPath, and finally stores the data in CSV files in append mode. The core code for the crawler is as follows:
def get_danke(href): time.sleep(random.uniform(0, 1)) # Set delay to avoid putting pressure on the server response = requests.get(url=href, headers=headers) if response.status_code == 200: # Some pages may redirect to 404, need to check res = response.content.decode('utf-8') div = etree.HTML(res) items = div.xpath("/html/body/div[3]/div[1]/div[2]/div[2]") for item in items: house_price=item.xpath("./div[3]/div[2]/div/span/div/text()")[0] house_area=item.xpath("./div[4]/div[1]/div[1]/label/text()")[0].replace('建筑面积:约','').replace('㎡(以现场勘察为准)','') house_id=item.xpath("./div[4]/div[1]/div[2]/label/text()")[0].replace('编号:','') house_type=item.xpath("./div[4]/div[1]/div[3]/label/text()")[0].replace('\n','').replace(' ','').replace('户型:','') house_floor=item.xpath("./div[4]/div[2]/div[3]/label/text()")[0].replace('楼层:','') house_postion_1=item.xpath("./div[4]/div[2]/div[4]/label/div/a[1]/text()")[0] house_postion_2=item.xpath("./div[4]/div[2]/div[4]/label/div/a[2]/text()")[0] house_postion_3=item.xpath("./div[4]/div[2]/div[4]/label/div/a[3]/text()")[0] house_subway=item.xpath("./div[4]/div[2]/div[5]/label/text()")[0] else: house_price = None house_area = None house_id = None house_type = None house_floor = None house_postion_1 = None house_postion_2 = None house_postion_3 = None house_subway = None.....Due to interruptions during the code execution, the data was ultimately saved in the following several CSV files:
Data Processing
Import Data Analysis Packages
import pandas as pdimport numpy as npfrom pathlib import Pathimport reImport and Merge Data
Find all CSV files in the folder, iterate to read the data, and finally merge all data using the concat method.
files = Path(r"D:\菜J学Python\数据分析\蛋壳公寓").glob("*.csv")dfs = [pd.read_csv(f) for f in files]df = pd.concat(dfs)df.head()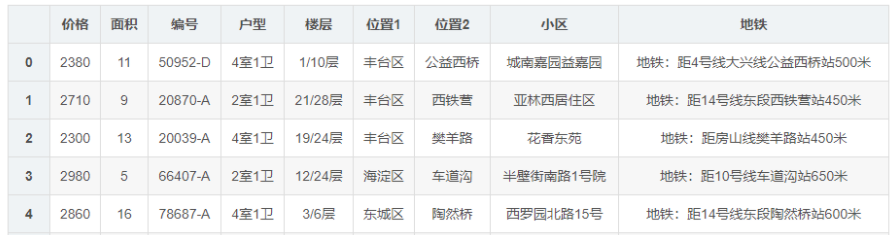
Data Deduplication
During the data scraping process, there may be interruptions, so there may be duplicate entries that need to be handled.
df = df.drop_duplicates()Use the df.info() method to check the overall data information. Combined with the preview of the data, we can easily find that the price and area fields are not numeric types and need to be converted. The floor field can extract the current floor and total floors.
df.info() <class 'pandas.core.frame.DataFrame'> Int64Index: 6026 entries, 0 to 710 Data columns (total 9 columns): # Column Non-Null Count Dtype --- ------ -------------- ----- 0 价格 6025 non-null object 1 面积 6025 non-null object 2 编号 6025 non-null object 3 户型 6025 non-null object 4 楼层 6025 non-null object 5 位置1 6025 non-null object 6 位置2 6025 non-null object 7 小区 6025 non-null object 8 地铁 6025 non-null object dtypes: object(9) memory usage: 470.8+ KB# Data Type ConversionDuring the field type conversion, an error occurred. Upon checking, it was found that there was a row of dirty data, so it is necessary to delete the dirty data before conversion. The data type conversion uses the astype() method, and to extract the current floor and total floors, we can split based on the character “/” using the split() method.
# Delete rows containing dirty datajg = df['价格'] != "价格" df = df.loc[jg,:]# Convert price field to numeric typedf["价格"] = df["价格"].astype("float64")# Convert area field to numeric typedf["面积"] = df["面积"].astype("float64")# Extract current floordf = df[df['楼层'].notnull()]df['所在楼层']=df['楼层'].apply(lambda x:x.split('/')[0])df['所在楼层'] = df['所在楼层'].astype("int32")# Extract total floorsdf['总楼层']=df['楼层'].apply(lambda x:x.split('/')[1])df['总楼层'] = df['总楼层'].str.replace("层"," ").astype("int32")# Subway Field CleaningThe subway field can extract the number of subway lines and the distance to the subway. The number of subway lines is calculated by counting the occurrences of the character “line”, while the distance to the subway is matched using a regular expression to find the number before the character “meters”. For ease of understanding, a function is constructed for cleaning.
def get_subway_num(row): subway_num=row.count('号线') return subway_numdef get_subway_distance(row): distance=re.search(r'\d+(?=米)',row) if distance==None: return-1 else: return distance.group()df['地铁数']=df['地铁'].apply(get_subway_num)df['距离地铁距离']=df['地铁'].apply(get_subway_distance)df['距离地铁距离']=df['距离地铁距离'].astype("int32")# Save DataAfter the data cleaning is complete, use df.to_excel() to save the data as an Excel file.
df.to_excel(r"\菜J学Python\数据分析\蛋壳公寓.xlsx")df.head()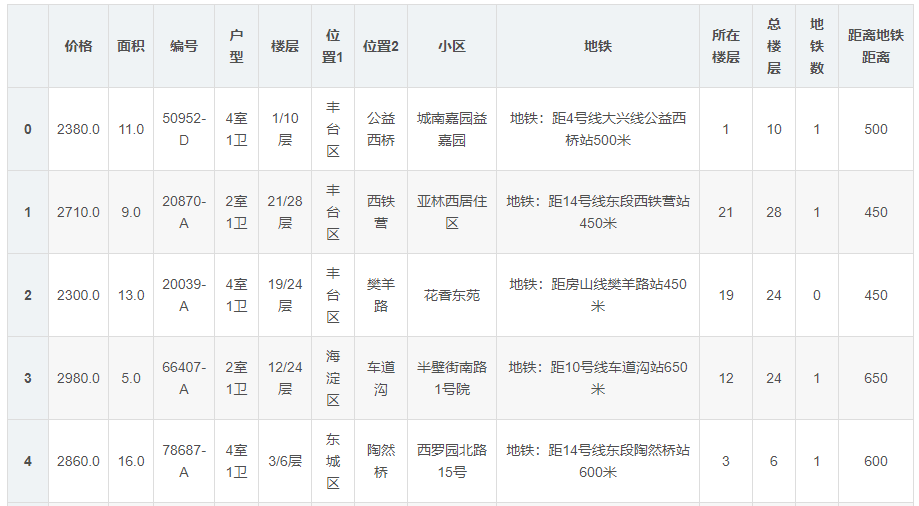
Data Visualization
Import Visualization Related Packages
import matplotlib.pyplot as pltimport seaborn as sns%matplotlib inlineplt.rcParams['font.sans-serif'] = ['SimHei'] # Set the font name to loadplt.rcParams['axes.unicode_minus'] = False# Solve the problem of saving images where the negative sign '-' is displayed as a square import jiebafrom pyecharts.charts import *from pyecharts import options as opts from pyecharts.globals import ThemeType import stylecloudfrom IPython.display import ImageNumber of Apartments in Each Administrative District
# Code to visualize the distribution of Eggshell Apartments in BeijingBased on the cleaned data, we can clearly see the layout of Eggshell Apartments, with Chaoyang District and Tongzhou District being the main distribution areas, while there are very few Eggshell Apartments in Yanqing, Miyun, Huairou, Pinggu, and Mentougou.
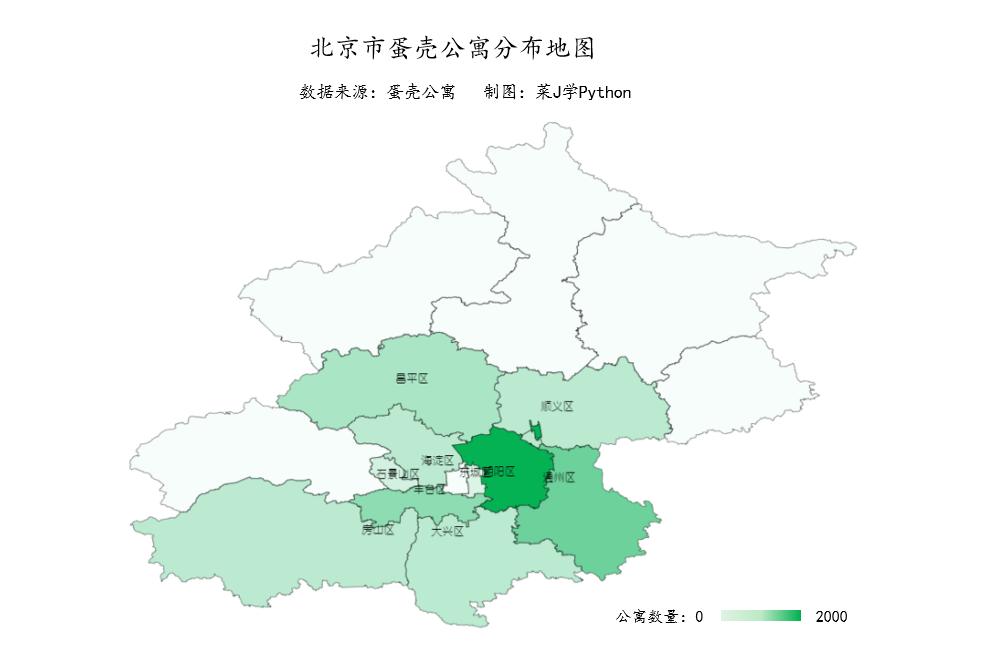
From the number of apartments in each administrative district, both Chaoyang District and Tongzhou District have more than 1000 apartments, with Chaoyang District leading with a total of 1877, followed closely by Tongzhou District with 1027.
df7 = df["位置1"].value_counts()[:10]df7 = df7.sort_values(ascending=True)df7 = df7.tail(10)print(df7.index.to_list())print(df7.to_list())c = ( Bar(init_opts=opts.InitOpts(theme=ThemeType.DARK)) .add_xaxis(df7.index.to_list()) .add_yaxis("",df7.to_list()).reversal_axis() # Swap X and Y axes .set_global_opts(title_opts=opts.TitleOpts(title="Number of Apartments in Each Administrative District",subtitle="Data Source: Eggshell Apartments \t Charting: CaiJ Learning Python",pos_left = 'left'), xaxis_opts=opts.AxisOpts(axislabel_opts=opts.LabelOpts(font_size=13)), # Change horizontal coordinate font size yaxis_opts=opts.AxisOpts(axislabel_opts=opts.LabelOpts(font_size=13)), # Change vertical coordinate font size ) .set_series_opts(label_opts=opts.LabelOpts(font_size=16,position='right')) )c.render_notebook()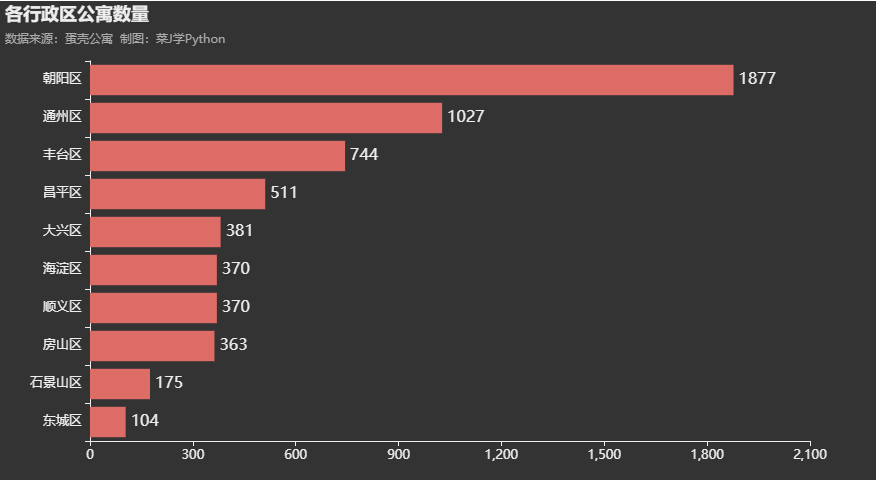
Top 10 Apartment Numbers in Communities
From the number of apartments in communities, Xinjian Village Community, Huaxiang East Garden, and Lianxin Garden West District have the most Eggshell Apartments, each exceeding 50. This also means that the tenants in these communities are more affected by the Eggshell incident compared to other communities.
df7 = df["小区"].value_counts()[:10]df7 = df7.sort_values(ascending=True)df7 = df7.tail(10)print(df7.index.to_list())print(df7.to_list())c = ( Bar(init_opts=opts.InitOpts(theme=ThemeType.DARK,width="1100px",height="600px")) .add_xaxis(df7.index.to_list()) .add_yaxis("",df7.to_list()).reversal_axis() # Swap X and Y axes .set_global_opts(title_opts=opts.TitleOpts(title="Top 10 Apartment Numbers in Communities",subtitle="Data Source: Eggshell Apartments \t Charting: CaiJ Learning Python",pos_left = 'left'), xaxis_opts=opts.AxisOpts(axislabel_opts=opts.LabelOpts(font_size=11)), # Change horizontal coordinate font size yaxis_opts=opts.AxisOpts(axislabel_opts={"rotate":30}), # Change vertical coordinate font size ) .set_series_opts(label_opts=opts.LabelOpts(font_size=16,position='right')) )c.render_notebook()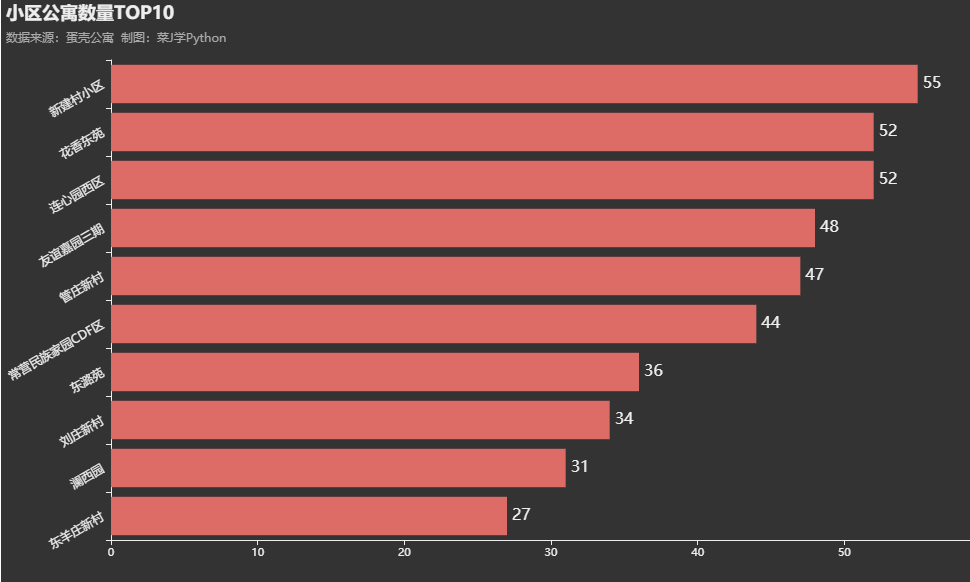
Rental Distribution of Eggshell Apartments
By segmenting the rental prices, we find that the rental prices of Eggshell Apartments in Beijing are quite attractive, with over half of the apartments renting for 2000-3000 yuan/month. The proportion of apartments renting for less than 2000 yuan/month is as high as 26.13%.
# Rental Segmentationdf['租金分段'] = pd.cut(df['价格'],[0,1000,2000,3000,4000,1000000],labels=['1000元以下','1000-2000元','2000-3000元','3000-4000元','4000元以上'],right=False)df11 = df["租金分段"].value_counts()df11 = df11.sort_values(ascending=False)df11 = df11.round(2)print(df11)c = ( Pie(init_opts=opts.InitOpts(theme=ThemeType.DARK)) .add( "", [list(z) for z in zip(df11.index.to_list(),df11.to_list())], radius=["20%", "80%"], # Thickness and size of the ring rosetype='area' ) .set_global_opts(legend_opts = opts.LegendOpts(is_show = False),title_opts=opts.TitleOpts(title="Rental Distribution of Eggshell Apartments",subtitle="Data Source: Eggshell Apartments\n Charting: CaiJ Learning Python",pos_top="0.5%",pos_left = 'left')) .set_series_opts(label_opts=opts.LabelOpts(formatter="{b}:{d}%,font_size=16")) )c.render_notebook()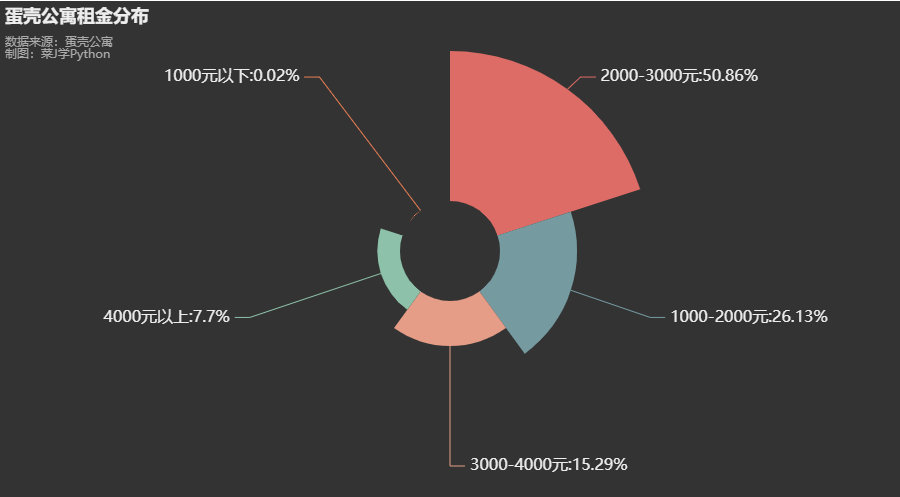
Rental Distribution by Administrative District
We continue to incorporate regional factors into the rental analysis and find that there are significant differences in rental distribution within different administrative districts. Taking Chaoyang District as an example, apartments renting for 2000-3000 yuan/month account for the most, while in Tongzhou District, apartments renting for 1000-2000 yuan/month account for more. This is easily understandable, given the significant differences in location and economic development.
h = pd.pivot_table(df,index=['租金分段'],values=['价格'], columns=['位置1'],aggfunc=['count'])k = h.droplevel([0,1],axis=1) # Delete specified index/column levelsc = ( Polar(init_opts=opts.InitOpts(theme=ThemeType.DARK)) .add_schema(angleaxis_opts=opts.AngleAxisOpts(data=k.columns.tolist(), type_="category")) .add("1000以下",h.values.tolist()[0], type_="bar", stack="stack0") .add("1000-2000元",h.values.tolist()[1], type_="bar", stack="stack0") .add("2000-3000元", h.values.tolist()[2], type_="bar", stack="stack0") .add("3000-4000元", h.values.tolist()[3], type_="bar", stack="stack0") .add("4000元以上", h.values.tolist()[4], type_="bar", stack="stack0") .set_global_opts(title_opts=opts.TitleOpts(title="Rental Situation by Administrative District",subtitle="Data Source: Eggshell Apartments\n Charting: CaiJ Learning Python"))c.render_notebook()Floor Distribution of Eggshell Apartments
From the floor distribution of Eggshell Apartments in Beijing, 73.92% are below 10 floors, indicating that high-rise and super high-rise buildings are not ideal choices for Eggshell Apartments.
# Funnel Chartdf['楼层分段'] = pd.cut(df['所在楼层'],[0,10,20,30,40,1000000],labels=['10层以下','10-20层','20-30层','30-40层','40层以上'],right=False)count = df['楼层分段'].value_counts() # pd.Seriesprint(count)job = list(count.index)job_count = count.values.tolist()from pyecharts.charts import Funnelc = ( Funnel(init_opts=opts.InitOpts(theme=ThemeType.DARK)) .add("", [list(i) for i in zip(job,job_count)]) .set_global_opts( title_opts=opts.TitleOpts(title="Floor Distribution of Eggshell Apartments",subtitle="Data Source: Eggshell Apartments\n Charting: CaiJ Learning Python",pos_top="0.1%",pos_left = 'left'),legend_opts = opts.LegendOpts(is_show = False)) .set_series_opts(label_opts=opts.LabelOpts(formatter="{b}:{d}%,font_size=16")) )c.render_notebook()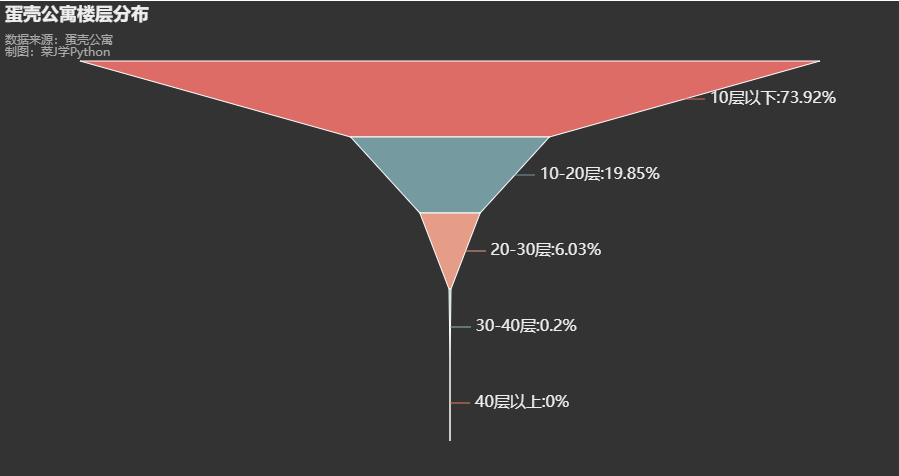
Distribution of Apartment Types in Eggshell Apartments
From the distribution of apartment types in Eggshell Apartments in Beijing, 3 rooms and 1 bathroom are the most common, totaling 2783, followed by 4 rooms and 1 bathroom. This is significantly different from the situation in Shenzhen, where 4 rooms and 1 bathroom are predominant.
df2 = df.groupby('户型')['价格'].count() df2 = df2.sort_values(ascending=False)[:10]# print(df2)bar = Bar(init_opts=opts.InitOpts(theme=ThemeType.DARK))bar.add_xaxis(df2.index.to_list())bar.add_yaxis("",df2.to_list()) # Swap X and Y axesbar.set_global_opts(title_opts=opts.TitleOpts(title="Distribution of Apartment Types in Eggshell Apartments",subtitle="Data Source: Eggshell Apartments\t Charting: CaiJ Learning Python",pos_top="2%",pos_left = 'center'), xaxis_opts=opts.AxisOpts(axislabel_opts=opts.LabelOpts(font_size=16)), # Change horizontal coordinate font size yaxis_opts=opts.AxisOpts(axislabel_opts=opts.LabelOpts(font_size=16)), # Change vertical coordinate font size )bar.set_series_opts(label_opts=opts.LabelOpts(font_size=16,position='top'))bar.render_notebook()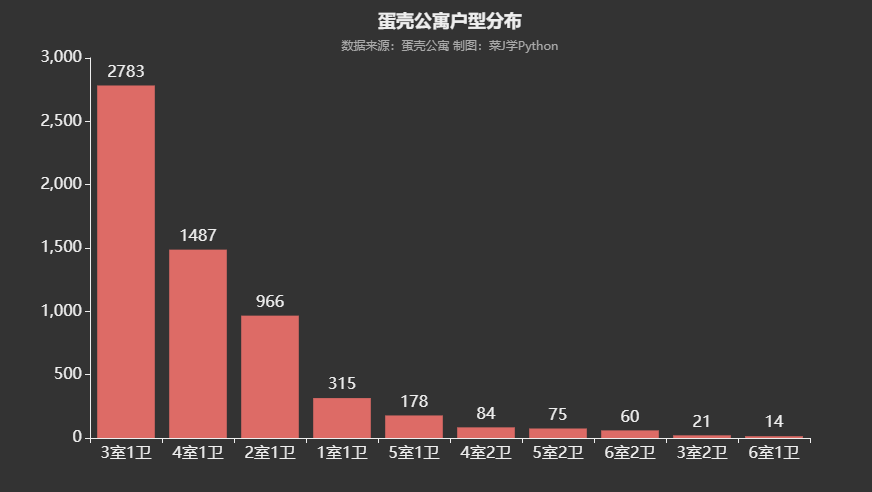
Distribution of Apartment Areas in Eggshell Apartments
From the area distribution of Eggshell Apartments in Beijing, 86.77% of the apartments are less than 20㎡. The proportion of Eggshell Apartments under 10㎡ in Beijing reaches 21.2%, although this number is still less than half of that in Shenzhen.
df['面积分段'] = pd.cut(df['面积'],[0,10,20,30,40,1000000],labels=['10㎡以下','10-20㎡','20-30㎡','30-40㎡','40㎡以上'],right=False)df2 = df["面积分段"].astype("str").value_counts()print(df2)df2 = df2.sort_values(ascending=False)regions = df2.index.to_list()values = df2.to_list()c = ( Pie(init_opts=opts.InitOpts(theme=ThemeType.DARK)) .add("", list(zip(regions,values))) .set_global_opts(legend_opts = opts.LegendOpts(is_show = False),title_opts=opts.TitleOpts(title="Area Distribution of Eggshell Apartments",subtitle="Data Source: Eggshell Apartments\n Charting: CaiJ Learning Python",pos_top="0.5%",pos_left = 'left')) .set_series_opts(label_opts=opts.LabelOpts(formatter="{b}:{d}%,font_size=14)) )c.render_notebook()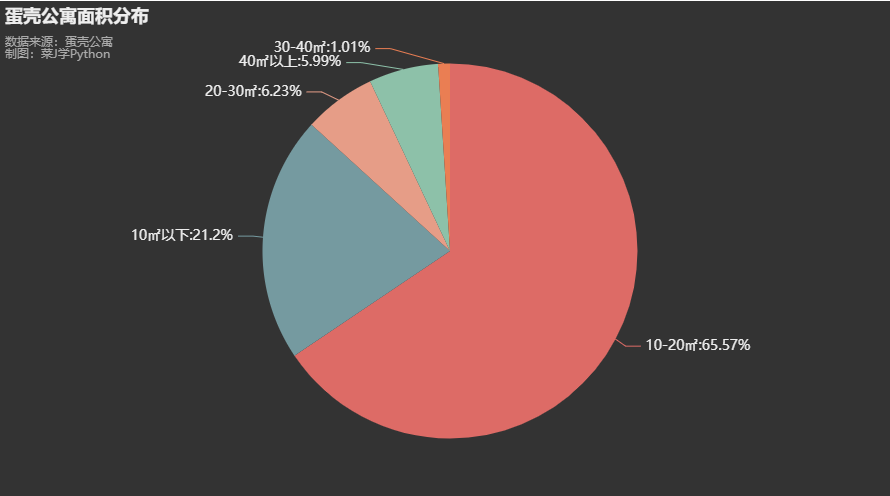
Distribution of Commercial Circles of Eggshell Apartments
By conducting word cloud statistics on the commercial circles of several major administrative districts in Beijing (the larger the font, the more Eggshell Apartments), Guanzhuang and Wangjing in Chaoyang District, Beiguan in Tongzhou District, Fanyang Road, Fangzhuang, and Jiaomen in Fengtai District, Tiantongyuan in Changping District, Yongfeng and Xierqi in Haidian District, and Huangcun and Yizhuang in Daxing District are the main commercial circles chosen for Eggshell Apartments.
# Draw Word Cloudtext1 = get_cut_words(content_series=df1['位置2'])stylecloud.gen_stylecloud(text=' '.join(text1), max_words=100, collocations=False, font_path=r'C:\WINDOWS\FONTS\MSYH.TTC', icon_name='fas fa-home', size=653, palette='cartocolors.diverging.ArmyRose_2', output_name='./1.png')Image(filename='./1.png')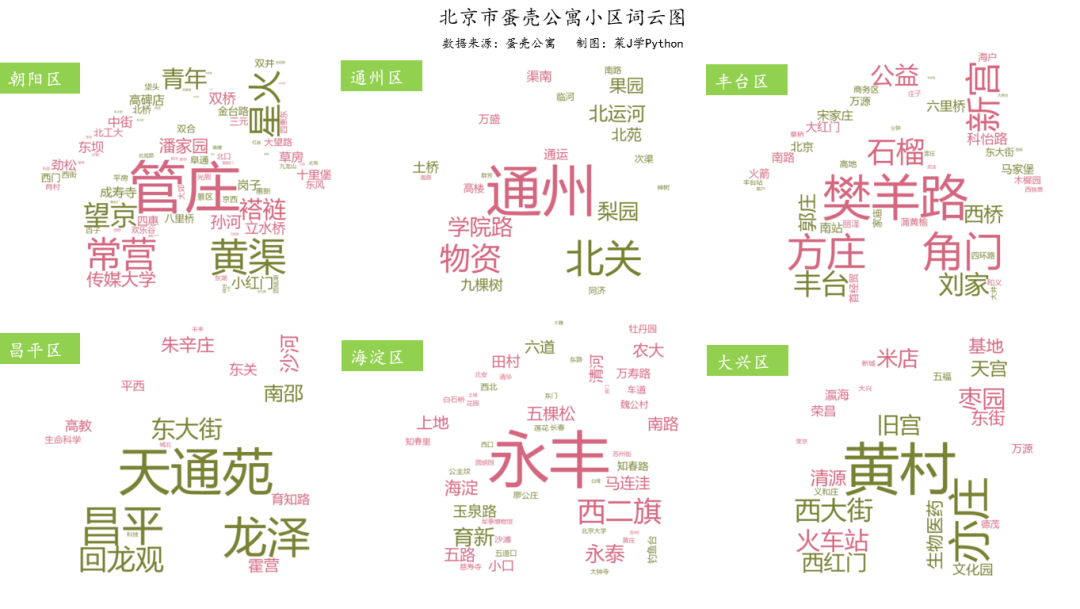
Correlation Analysis
From the correlation coefficient table, it can be seen that the area of Eggshell Apartments and the number of nearby subways have a significant impact on the price of the apartments, with correlation coefficients of 0.81 and 0.36, respectively. When pricing the apartments, Eggshell Apartments places significant weight on the area of the apartment and the subway facilities. Since Eggshell Apartments in Beijing are all very close to the subway, the distance has a limited impact on the price of the apartments. Additionally, the floor level is not an important factor affecting the rental price of Eggshell Apartments in Beijing.
color_map = sns.light_palette('orange', as_cmap=True) # Light palette color mapdf.corr().style.background_gradient(color_map)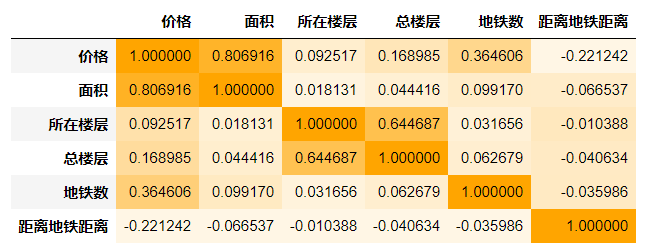
Finally, I hope that all young people affected by the “explosion” incident of Eggshell Apartments can survive this cold winter.

 Those who click “Looking” have all become better looking!