Full text link:https://tecdat.cn/?p=41465
Analyst: Nan Hu
In the data-driven era, data scientists are tasked with extracting value from vast amounts of data. This collection focuses on an in-depth analysis of rental market data, covering the factors influencing short-term rental evaluations in Beijing and exploring rental data from Lianjia in Shanghai. (Click “Read the original text” at the end to obtain the complete code, data, and documentation).
In the study of short-term rentals in Beijing, public data from Airbnb was obtained on April 17, 2019, including basic information about listings, schedule information, review information, and administrative district data. By filtering variables, correlation tests were conducted on discrete and continuous variables, followed by feature transformation to construct logistic regression and decision tree models, and model optimization. The results showed significant differences in the factors affecting short-term rental ratings between urban and suburban areas, with suburban renters focusing more on living experience, while urban renters emphasized the reliability of listings.
Regarding the rental data from Lianjia in Shanghai, Python was used to extract rental information from the Lianjia.com .csv file. After ETL data preprocessing, exploratory analysis, and data visualization, models such as Ridge Regression, Lasso Regression, Random Forest, XGBoost, Keras Neural Networks, and KMeans clustering were constructed to predict rental prices.
This collection of data from Beijing and Lianjia, along with the code, has been shared in the communication community. Reading the original text allows you to join and exchange ideas with over 500 industry professionals. Here, data scientists provide strong data support for industry development by mining rental data from different regions, offering valuable insights for precise operations in the short-term rental market and reasonable predictions of rental prices.
Research on Factors Influencing Short-Term Rental Ratings in Beijing | Data Sharing
Short-term rentals refer to the practice of renting out properties to guests for short periods, providing leasing services from one day to several months, integrating residential, hotel, and club functions. It serves both “personal use” and “investment” purposes, allowing owners to rent out spare parts of their residences.
Currently, short-term rental transactions are mainly active in first-tier cities and tourist cities, with the number of listings, users, and transaction volumes continuously increasing year by year, making competition among short-term rentals increasingly fierce. Customers and websites assign different ratings to different listings, making it crucial to explore and provide the key value factors that users desire most to achieve victory in competition and gain more benefits.
Solution
Task/Objective
Select a series of listing information and their rating information to analyze the factors influencing ratings based on urban and suburban spatial characteristics.
Data Source Preparation
The data comes from Airbnb’s publicly available data for the Beijing area on April 17, 2019 (See the end of the article for free data acquisition methods). All data is sourced from publicly available information on the Airbnb website and does not contain any personal privacy data.
Data Integration and Missing Value Imputation
Variable Selection
All variables were divided into two groups: discrete and continuous, and correlation tests were conducted for each variable with respect to whether it is in the urban area.
For discrete variables, using the variable “Is the host a superhost” as an example, the results are as follows:
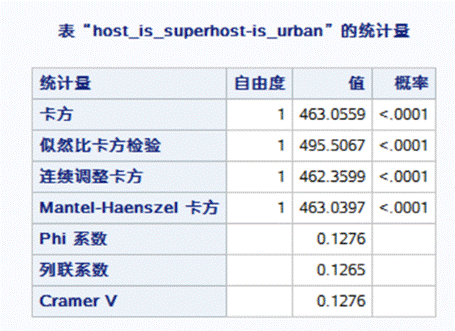
Since p<0.0001, the variable “Is the host a superhost” shows a difference between urban and suburban areas. Similarly, other discrete variables were tested, and all variables met the correlation criteria.
Continuous variables were also subjected to correlation tests, with the following results:
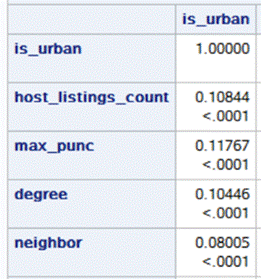
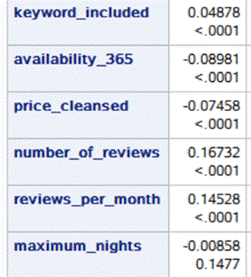
Except for “maximum_nights”, all other variables met the correlation criteria.
Feature Transformation
Number of bedrooms, number of bathrooms, and the number of listings owned by the host were manually classified into qualitative variables; the types of properties in suburban areas were represented using dummy variables, and the response time of the host, room type, and whether the listing location is accurate, as well as whether the host is a superhost, were also replaced with dummy variables.
① Further classification of property types:
Urban: All property types except ‘Apartment’, ‘House’, ‘Condominium’, ‘Loft’, ‘Serviced apartment’ (the five most common property types in urban areas) are treated as a separate category.
Suburban similarly. (‘Apartment’, ‘House’, ‘Condominium’, ‘Loft’, ‘Farm stay’)
② Remove irrelevant independent variables: number_of_reviews, reviews_per_month.
③ Response Variable:
Ⅰ The scores for specific aspects of the listing (e.g., accuracy, cleanliness, check-in, communication, location, value) are summed; since each aspect has a maximum score of ten, and there are six aspects, to align with the total score review_scores_rating (maximum score of 100), multiply by the weight 10/6 to create a new variable (for scores on specific aspects of the listing) review_scores_specific.
Ⅱ The review_scores_rating and review_scores_specific are weighted and summed to form the response variable scores, with weights of 0.3 and 0.7 respectively.
Ⅲ Considering the high number of high scores, we manually set scores greater than 97.5 to 1 and scores less than 97.5 to 0. (The threshold of 97.5 is derived from the weighted total score’s fifth percentile as the boundary for the classification variable).
Construction
The above explains how to extract relevant features, resulting in the following training samples (only a portion of the features is listed).
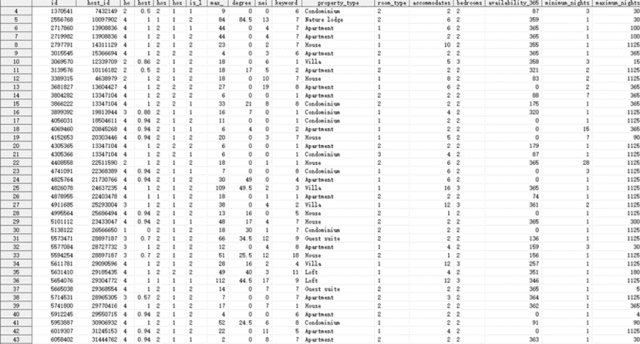
Modeling
Logistic regression is a type of generalized linear regression model suitable for cases where the dependent variable y has only two possible values, meaning the distribution of the dependent variable is Bernoulli (or binary distribution), typically represented by 1 and 0 for the two possible outcomes.
Decision trees are a widely used classification method that can extract a tree-like classification model from the given training samples. Each internal node in the tree records which attribute is used for classification, each branch represents an output of a judgment result, and each leaf node represents the final classification result. In this experiment, scores greater than 98.5 are set to 1, and scores less than 98.5 are set to 0, which serves as the target variable score_kind. The leaf nodes of the decision tree model will display the categories of the target variable score_kind, and the path rules from the root node to each leaf node form the classification rules.
Model Optimization
1. Remove outliers:
In logistic regression, output various residual statistics to the res_out dataset, then filter observations with absolute Pearson residuals greater than 2, which are considered outliers. A total of 793 outliers were identified, accounting for approximately 2%.
Using SQL processes, these 793 outliers were removed, and logistic regression was performed again.
2. Iteration after going live, improving the model based on actual A/B testing and suggestions from business personnel.
Logistic regression ROC curve:
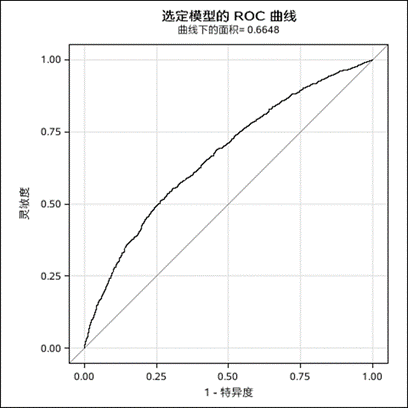
For urban data, the decision tree classification achieved an accuracy of 76.457%, while for suburban data, the decision tree classification achieved an accuracy of 85.08%, indicating better predictive performance of the decision tree.
Click the title to view previous content

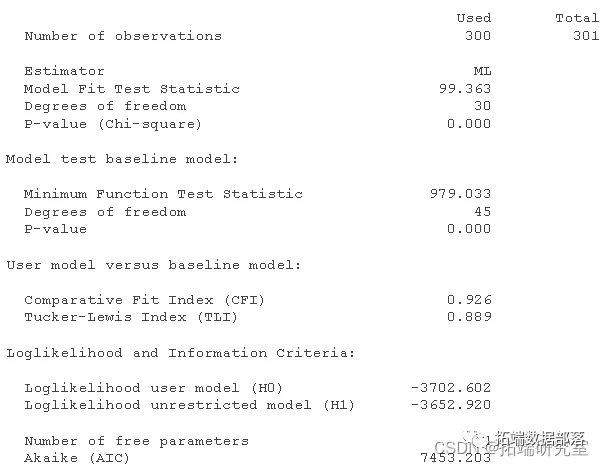
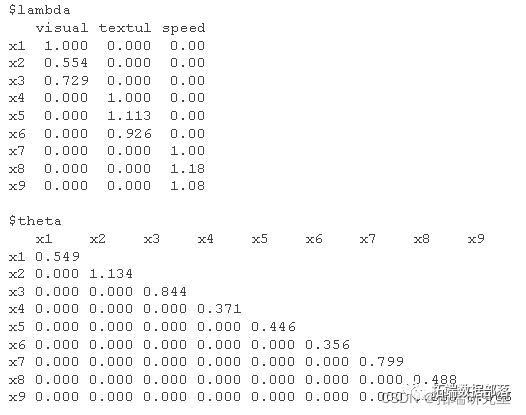
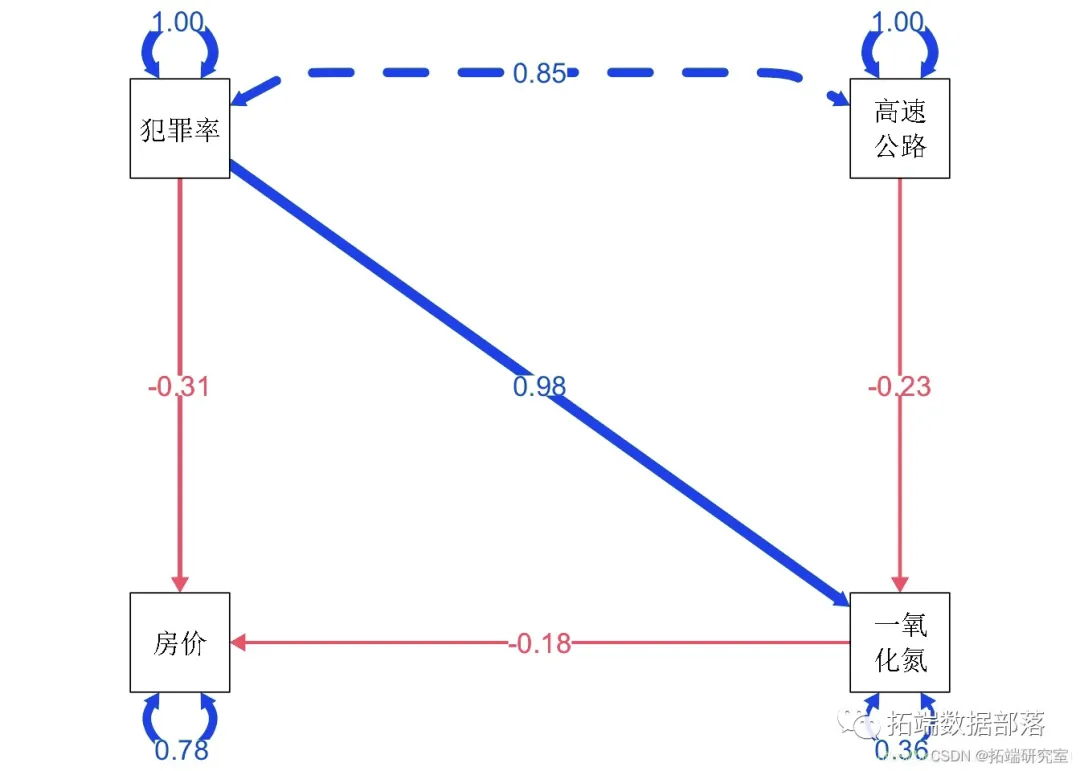
Structural equation modeling SEM, path analysis of housing prices and crime rates data, visualization of predictive factors of intelligence impact case 2

Swipe left and right to see more
01
02
03
04
From the analysis results above, it is evident that the factors influencing short-term rental ratings differ significantly between urban and suburban areas in Beijing.
In the suburbs, renters are more concerned about the property type, layout, and the administrative district where the listing is located. Attractions such as the Badaling Great Wall, Simatai Great Wall, and Miyun Reservoir, especially those focused on natural scenery, are widely distributed in the suburbs of Beijing. Properties in Miyun County, Shunyi District, and Yanqing County are more likely to become quality listings, supporting our hypothesis that renters choosing short-term rentals in the suburbs are more tourism-oriented and focus more on the living experience. Therefore, standalone and unique property types, duplexes, and serviced apartments are more popular than ordinary residential apartments.
In contrast, renters choosing short-term rentals in urban Beijing are more likely to do so due to work, study, or other needs, thus focusing on short-term living arrangements. They pay more attention to the reliability of listings and rely more on the basic information of the host and the listing, as well as past reviews.
Python Ridge Regression, Lasso, Random Forest, XGBoost, Keras Neural Networks, KMeans Clustering Geospatial Analysis of Lianjia Rental Data | Data and Code Included
1 Use Python to scrape publicly available rental data from Lianjia;
2 Analyze rental information, focusing on features related to rental prices, and build models to predict rental prices.
Task/Objective
Utilize publicly available rental information from the Shanghai Lianjia website, focusing on data analysis and mining of monthly rents.
Shanghai Rental Data
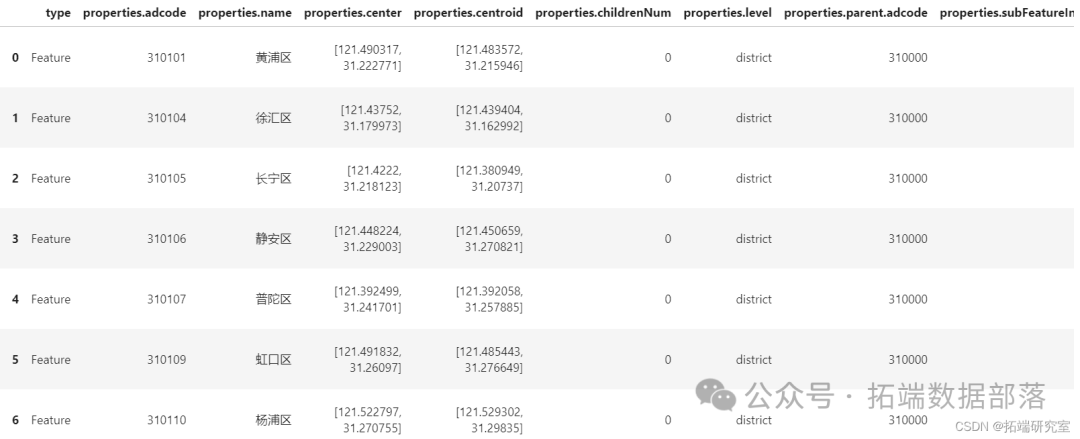
This data comes from the Lianjia.com .csv file and includes name, rental type, number of beds, price, longitude, latitude, balcony, deposit, apartment, description, tourism, transportation, independent bathroom, furniture, new listing, size, direction, dam, elevator, parking, and amenities information.
Attributes:
Name: Listing nameType: Sublease or entire rentalBeds: Number of bedroomsPriceLongitude/Latitude: CoordinatesBalcony, deposit (whether there is a deposit policy), apartment, description, tourism availability, proximity to transportation, independent bathroom, furniture
New listing: NO-0, YES-1Size: Square metersDirection: Direction of the window, South-1, Southeast-2, East-3, North-4, Southwest-5, West-6, Northwest-7, Northeast-8, Unknown-0Level: Listing level, Basement-0, Low (1-15)-1, Medium (15-25)-2, High (>25)-3Parking: No parking-0, Extra charge-1, Free parking-2Amenities: Number of amenities
import pandas as pd
import numpy as np
import geopandas
df = pd.read_csv('liashanghai.csv', sep =',', encoding='utf_8_sig', header=None)
df.head()
Data Preprocessing
ETL processing, cleaning the data frame.
df_clean.head()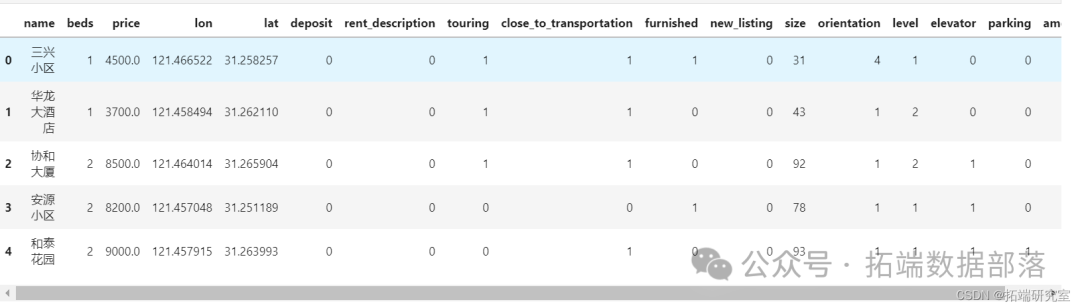
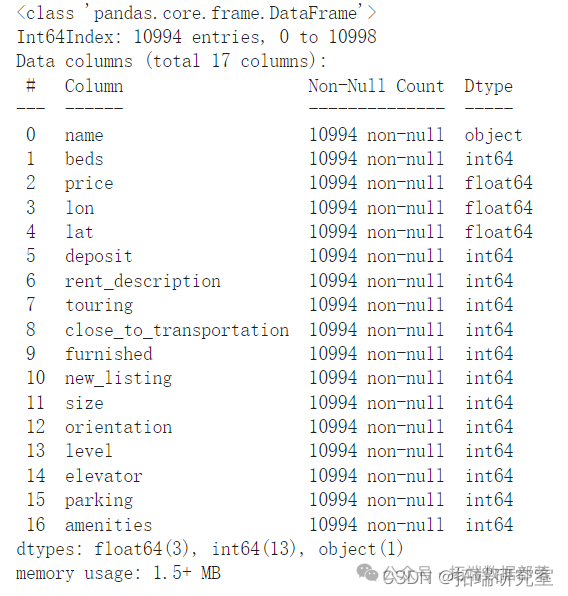
Exploratory Analysis – Data Visualization
plt.figure(figsize=(8, 6))
sns.distplot(df_clean.price, bins=500, kde=True)
plt.xscale('log') # Log transform the price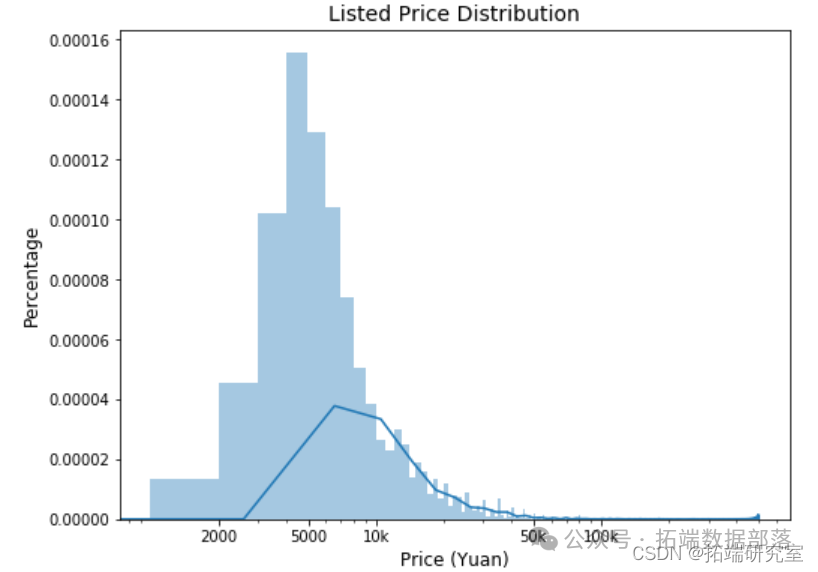
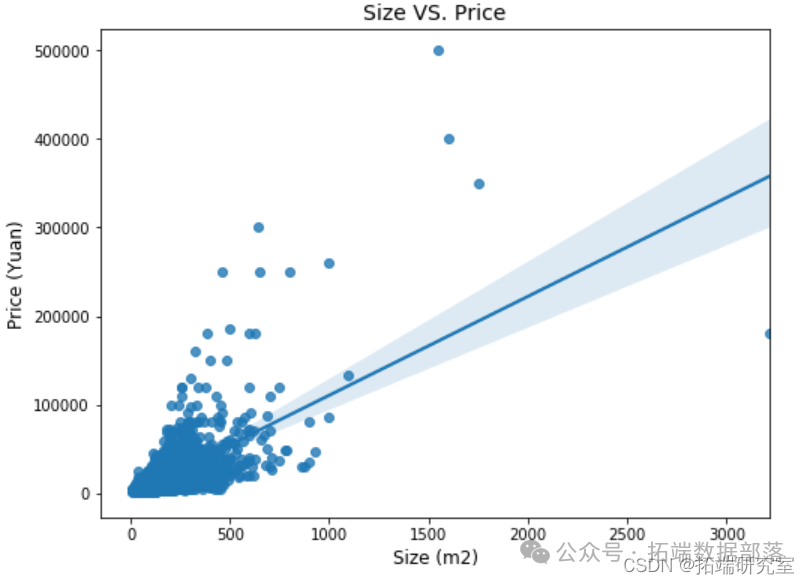
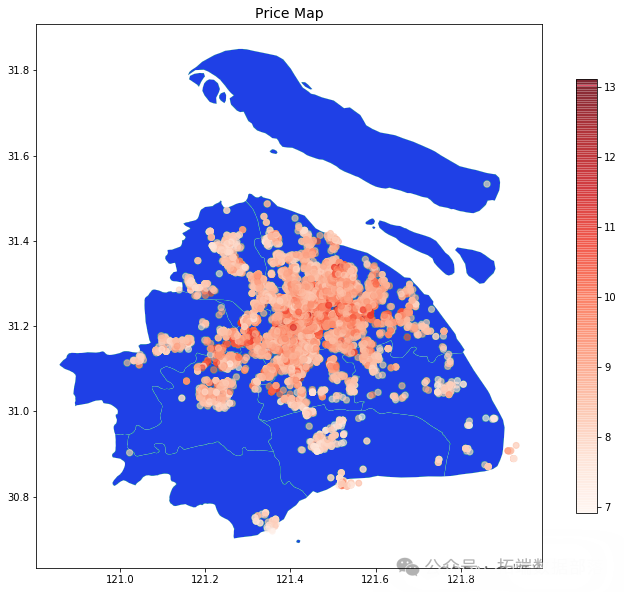
Reading Geospatial Data
plt.figure(figsize=(12, 12))
sns.heatmap(df_clean.corr(), square=True, annot=True, fmt = '.2f', cmap = 'vla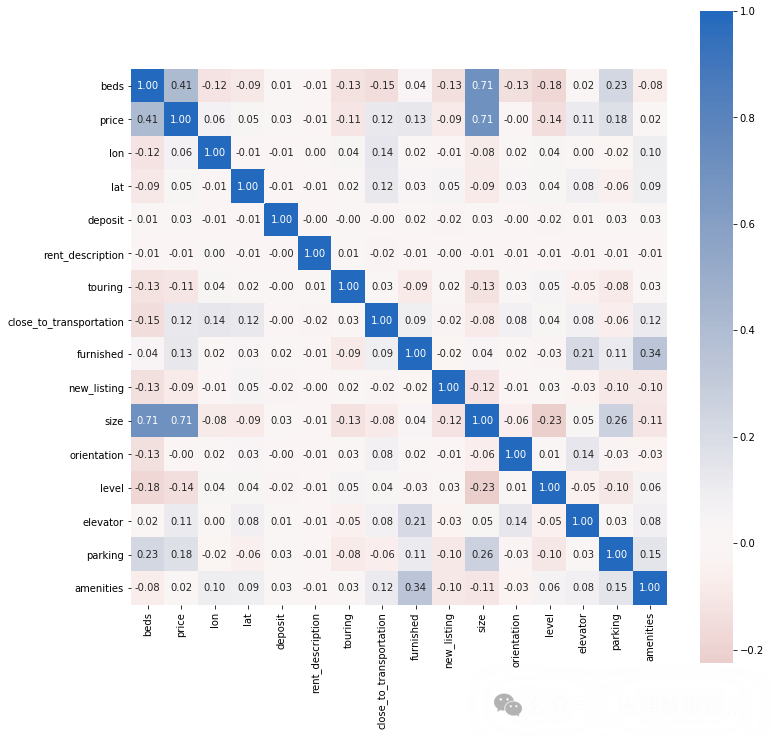
Model Construction
Attempt to predict prices based on features.
y = df_clean.log_price
X = df_clean.iloc[:, 1:].drop(['price', 'log_price'], axis=1)
Ridge Regression Model
ridge = Ridge()
alphas = [0.0001, 0.001, 0.001, 0.01, 0.1, 0.5, 1, 2, 3, 5, 10]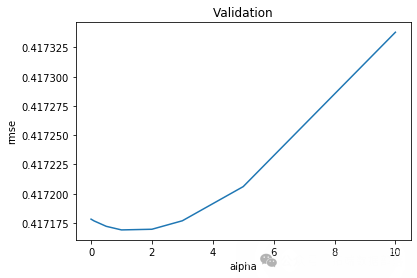
Lasso Regression
coef.sort_values(ascending=False).plot(kind = 'barh')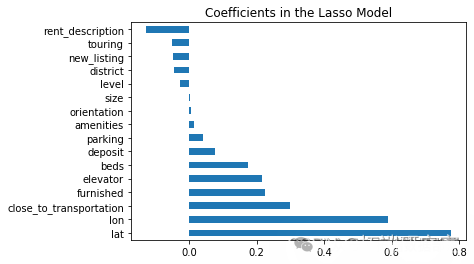
Random Forest
rf_cv.fit(X_train, y_train)
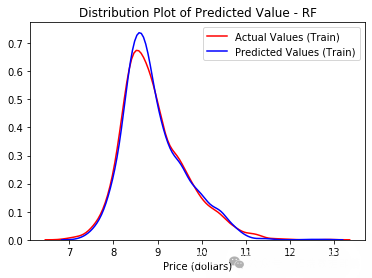
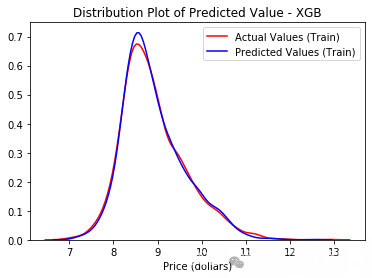
XGBoost
xgb_model.loc[30:, ['test-rmse-mean', 'train-rmse-mean']].plot();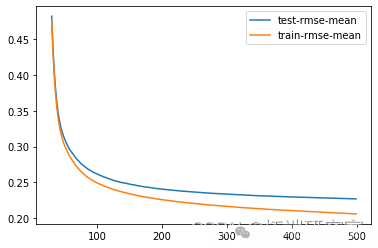
xgb_cv.fit(X_train, y_train)

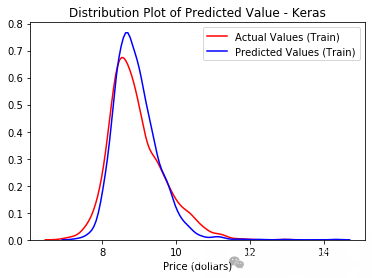
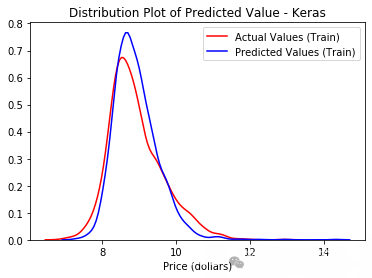
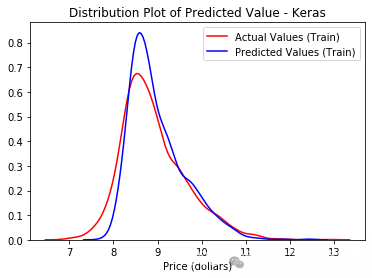
Keras Neural Networks
model.add(Dense(1, kernel_initializer='normal'))
# Compile model
model.compile(loss='mean_squared_error', optimizer='Adam')
model.summary()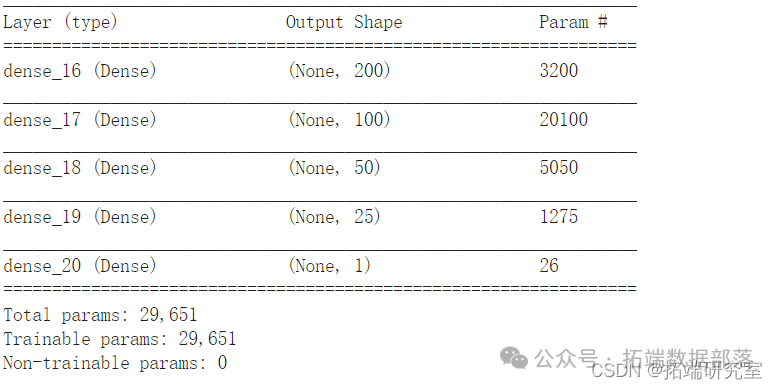
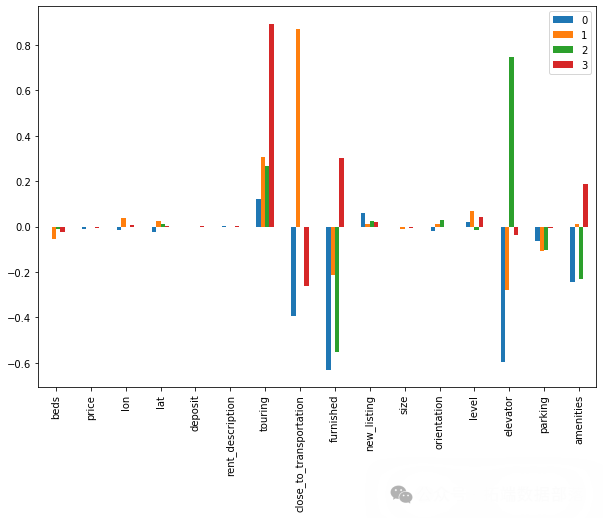
KMeans Clustering Data
  kmeanModel = KMeans(n_clusters=k).fit(X)
    kmeanModel.fit(X)
    inertias.append(kmeanModel.inertia_)
plt.plot(K, inertias, 'bx-')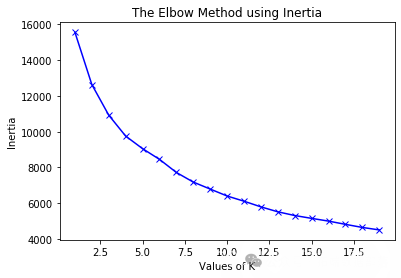
gpd.plot(figsize=(12,10), alpha=0.3)
scatter_map = plt.scatter(data=df_clean, x='lon', y='lat', c='label', alpha=0.3, cmap='tab10', s=2)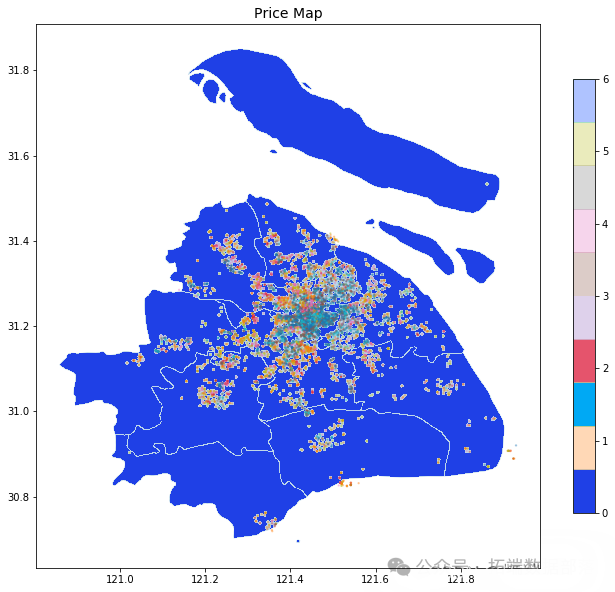

About the Analyst

We sincerely thank Nan Hu for her contributions to this article. She is pursuing a master’s degree in applied statistics at Shanghai University of Finance and Economics, focusing on data analysis and statistical modeling. She is proficient in SQL, R, Python, and SAS.
Data Acquisition
Reply “Beijing Rental Data” in the public account backend to obtain the complete data for free.

This article includes complete data, code, and documentation shared in the membership group. Scan the QR code below to join the group!

Data Acquisition
Reply “Get Materials” in the public account backend to obtain learning materials on data analysis, machine learning, deep learning, etc., for free.

Click the end of the article “Read the original text”
to obtain the complete code, data, and documentation.
This article is selected from “Analysis of Airbnb Rental Data in Beijing and Shanghai Using Logistic Regression, Decision Trees, Ridge Regression, Lasso, Random Forest, XGBoost, Neural Networks, and Clustering”.
Click the title to view previous content
PYTHON user churn data mining: building user profiles using logistic regression, XGBOOST, random forest, decision trees, support vector machines, naive Bayes, and KMEANS clusteringPython for store data LSTM and XGBOOST sales volume time series modeling and prediction analysisPYTHON integrated machine learning: using ADABOOST, decision trees, logistic regression integrated model classification and regression and grid search hyperparameter optimizationR language integrated model: boosting trees, random forests, constrained least squares weighted average model fusion analysis of time series dataPython for store data LSTM and XGBOOST sales volume time series modeling and prediction analysisR language using principal component PCA, logistic regression, decision trees, random forests to analyze heart disease data and high-dimensional visualizationR language tree-based methods: decision trees, random forests, Bagging, boosting treesR language using logistic regression, decision trees, and random forests for classification prediction of credit datasetsSPSS Modeler using decision trees and neural networks to predict ST stocksR language using linear models, regression decision trees to automatically combine feature factor levelsR language implementing the Gini coefficient of CART regression decision treesR language using RLE, SVM, and rpart decision trees for time series predictionPython using decision trees and random forests to predict NBA winnersPython using scikit-learn and pandas decision trees for iris flower data classification modeling and cross-validationR language nonlinear models: polynomial regression, local splines, smoothing splines, generalized additive models GAM analysisR language using standard least squares OLS, generalized additive models GAM, spline functions for logistic regression LOGISTIC classificationR language ISLR wage data for polynomial regression and spline regression analysisR language polynomial regression, local regression, kernel smoothing, and smoothing spline regression modelsR language using Poisson regression, GAM spline curve models to predict the number of cyclistsR language quantile regression, GAM spline curves, exponential smoothing, and SARIMA for power load time series predictionR language spline curves, decision trees, Adaboost, gradient boosting (GBM) algorithms for regression, classification, and dynamic visualizationHow to build integrated models in machine learning using R language?R language ARMA-EGARCH models, integrated prediction algorithms for predicting SPX actual volatilityCalculating neural network integrated models in Python deep learning KerasR language ARIMA integrated model for time series analysis predictionR language tree-based methods: decision trees, random forests, Bagging, boosting trees for heart disease patient analysisR language bootstrap-based linear regression prediction confidence interval estimation methodsR language using bootstrap and incremental methods to calculate generalized linear model (GLM) prediction confidence intervalsR language spline curves, decision trees, Adaboost, gradient boosting (GBM) algorithms for regression, classification, and dynamic visualizationPython for store data LSTM and XGBOOST sales volume time series modeling and prediction analysisR language random forest RandomForest, logistic regression Logisitc for predicting heart disease data and visualization analysisR language using principal component PCA, logistic regression, decision trees, random forests to analyze heart disease data and high-dimensional visualizationMatlab building SVM, KNN, and naive Bayes model classification drawing ROC curvesMatlab using quantile random forest (QRF) regression trees to detect outliers