
Background
When debugging multi-core processors with JNDTech’s CodeViser emulator, it is often necessary to manually configure the emulator and processor. This article takes the configuration of the Cortex-A9 dual-core processor in CVD as an example to introduce the multi-core debugging configuration method.
Solution
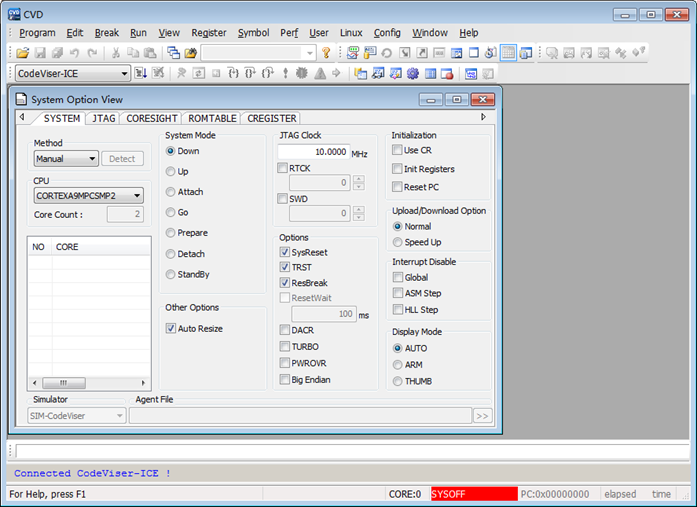
After connecting the emulator to the development board, start the CVD debugger, select Config from the menu bar, and in the System Options window under the System tab, if the Method item is Auto and the detection fails, please click the downward triangle next to Auto and select Manual. Under the CPU item, select CORTEXA9MPCSMP2 (if you cannot connect after completing the parameter configuration, you can select other Cortex A9 dual-core related options for testing).
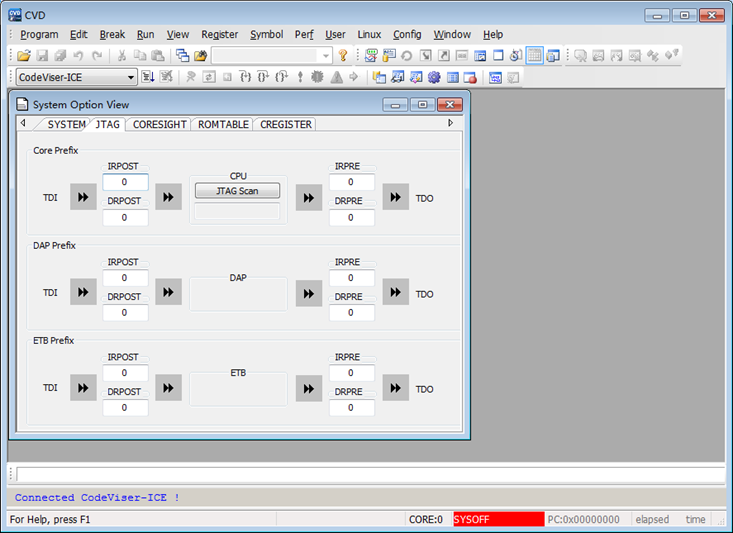
Then, click the JTAG tab, configure the Core Prefix as needed, and after configuration is complete, click the middle JTAG Scan to check if the IR and DR match the descriptions in the processor manual. You can also refer to the settings of the ARM Dstream emulator for configuration. If necessary, you can also configure the DAP Prefix and ETB Prefix, generally defaults are sufficient.
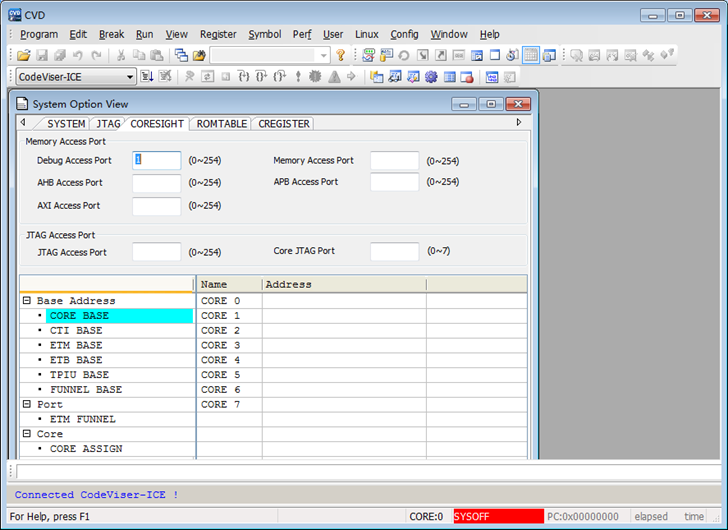
Next, select the CORESIGHT tab, the CORE BASE in the BASE Address section must be configured; its value is generally provided in the processor manual. For dual-core, configure core 0 and core 1, and you can also refer to the settings of the ARM Dstream for configuration.
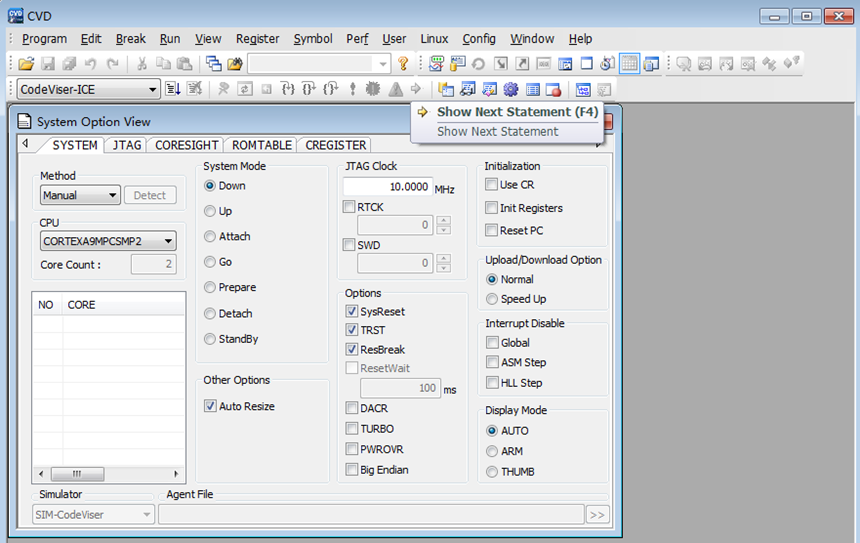
After configuration is complete, return to the System tab, click the UP button below the middle System Mode item to see if you can connect. If you can connect, you should see the assembly language window. If not, you can click the yellow right arrow in the toolbar to open the assembly window, and then you should be able to perform single-step debugging and observe the registers.
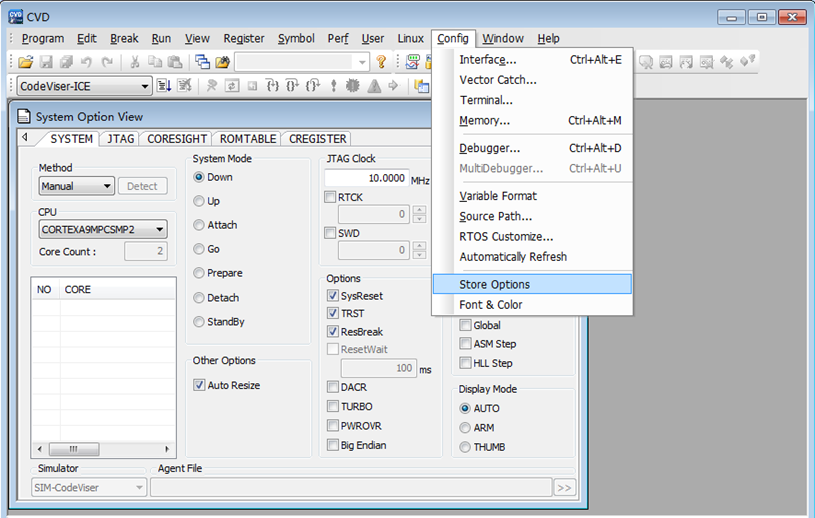
If everything works normally, you can select Config->Store Options from the menu to save your configuration as a script file *.csf.
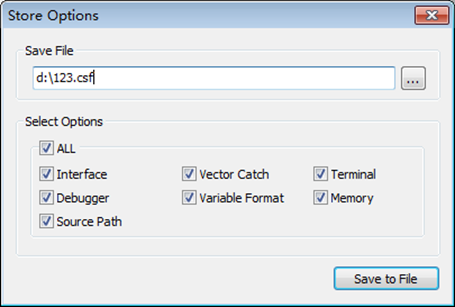
For example: enter d:\123.csf, then press Save to File.
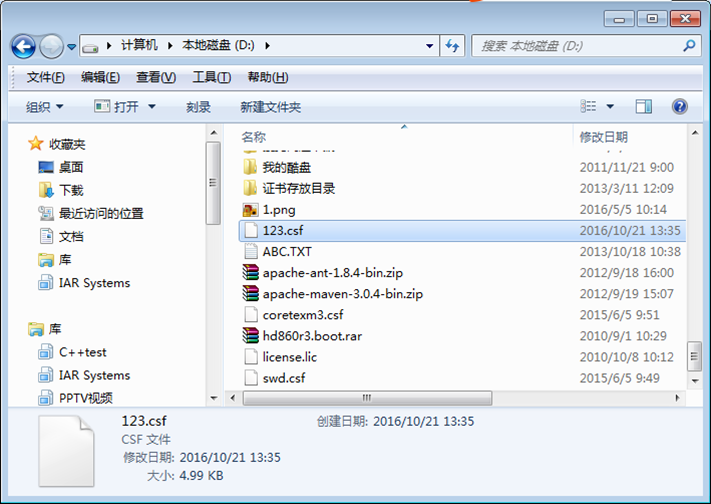
We will see the script file 123.csf in the root directory of D: drive.
The content of the script is as shown in the following image:
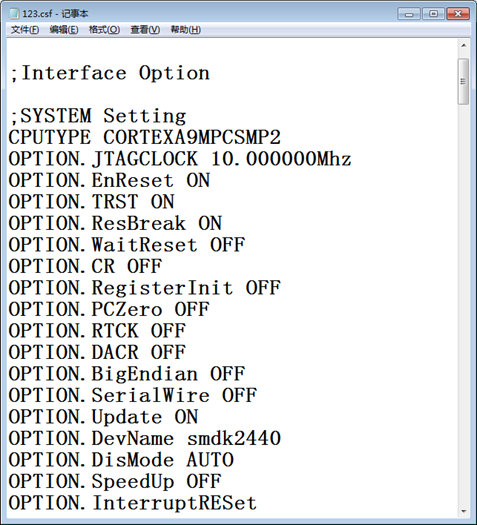
In this way, when using the same hardware in the future, you can directly run the script file to configure the processor options without needing to set each item again.
Welcome to follow the WeChat public account 【Maikete Technology】, reply “Join Group” to join the technical exchange group as prompted.
Product Consultation:
Beijing: 010-62975900
Shanghai: 021-62127690
Shenzhen: 0755-82977971
