Quick Calculation of SPI Index Using GMA Based on Raster Data

Quick Calculation of SPI Index Using GMA Based on Raster Data

1 Preparation 1.1 Environment Python: 3.12 gma: 2.1.10a1 (Download: https://pypi.org/project/gma/) **Note: Must be greater than version 2.1.10a1 to execute properly 1.2 Data The example uses monthly precipitation raster data from Luoyang City from 1980 to 2020. Sample data can be obtained from: Link: https://pan.baidu.com/s/1reTBTdBdhGlTmXEC23f9qw?pwd=dfub Extraction code: dfub 2 Functions and Help (Raster file read by … Read more
Geospatial Analysis with Python: Processing Raster Data Using GDAL

Geospatial Analysis with Python: Processing Raster Data Using GDAL

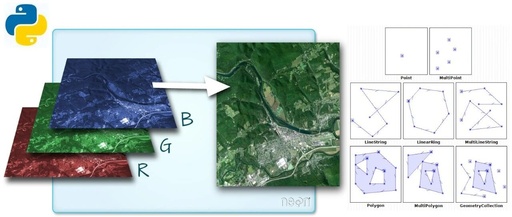
โ€œ GDAL processes raster data.โ€ Here, I will share some content on processing raster data with GDAL. Sample data can still be downloaded from the following link: https://pan.baidu.com/s/1bAnUo0S_ojxXdkyBqWAnLg?pwd=gxu2 Extraction code: gxu2 01 โ€” Data Reading When importing the GDAL module, Python automatically registers all known GDAL drivers to support reading various compatible formats. Common file … Read more

Introduction to Python Geographic Analysis: From Beginner to Expert 2 – Geographic Data Processing Made Easy

Introduction to Python Geographic Analysis: From Beginner to Expert 2 - Geographic Data Processing Made Easy

1Geographic Data Processing Python Geographic Analysis, from Beginner to Expert Part 2 Python Geographic Remote Sensing Analysis ๐ŸŒ๐Ÿ (Serial Series) From zero basics to mastery, this series will guide you step by step to master the powerful capabilities of Python in geographic spatial analysis. ๐Ÿš€ Explore spatial data types, coordinate reference systems, vector operations, and … Read more

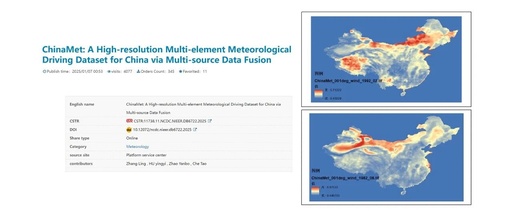
MATLAB | 1980โ€”2022 China Meteorological Element Raster Data (Precipitation/Temperature/Wind Speed/Humidity/Pressure/Potential Evapotranspiration)

MATLAB | 1980โ€”2022 China Meteorological Element Raster Data (Precipitation/Temperature/Wind Speed/Humidity/Pressure/Potential Evapotranspiration)

https://www.ncdc.ac.cn/portal/metadata/21691d03-bef2-4800-924e-5614e7268b87 Using monthly wind speed data as an example, this article demonstrates how to batch convert data to TIF format using MATLAB. .rtcContent { padding: 30px; } .lineNode {font-size: 10pt; font-family: Menlo, Monaco, Consolas, "Courier New", monospace; font-style: normal; font-weight: normal; }inputFolder = 'E:\ๆ•ฐๆฎ้ƒฝๅœจ่ฟ™้‡Œ\ๅทด้Ÿณ้ƒญๅ‹’\ChinaMet_001deg_wind\ChinaMet_001deg_wind\';outputFolder = 'E:\ๆ•ฐๆฎ้ƒฝๅœจ่ฟ™้‡Œ\ๅทด้Ÿณ้ƒญๅ‹’\ChinaMet\ChinaMet_001deg_wind\';ncFiles = dir(fullfile(inputFolder, 'ChinaMet_001deg_wind_*.nc'));for k = 1:length(ncFiles) ncPath = fullfile(inputFolder, … Read more