Today we will introduce the “Lissajous Figures.” The so-called Lissajous Figures are closed curves formed by the superposition of two mutually perpendicular simple harmonic motions.
Background Knowledge: What is “simple harmonic motion”? It is somewhat similar to the swinging of a swing, the oscillation of a clock pendulum, or the “Biu” sound of a spring bouncing up.
The mathematical expression for this physical phenomenon is:
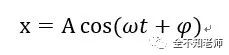
Where A is the amplitude, ω(pronounced omiga) is the angular frequency, and ψ(pronounced psai) is the initial phase.
Since the sine function and cosine function differ by 90 degrees, this is one reason why the sine function is so important. In middle school mathematics, the section on trigonometric functions mainly focuses on the sine function. High school mathematics also revolves tightly around the sine function; it is the core of the core.
When two sine signals that are mutually perpendicular in space are superimposed, if the ratio of their angular frequencies and the phase difference meet specific conditions, stable patterns can be formed, known as Lissajous Figures. In engineering, this convenient method is often used to determine the angular frequency and initial phase of signals.
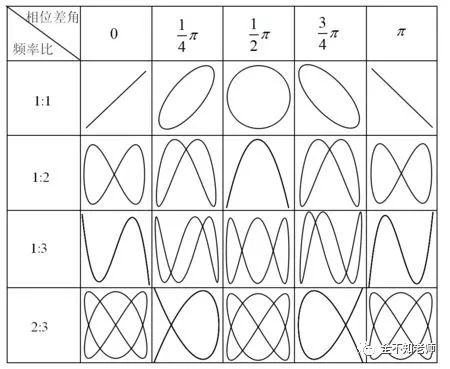
Next, let’s use a program to demonstrate this.
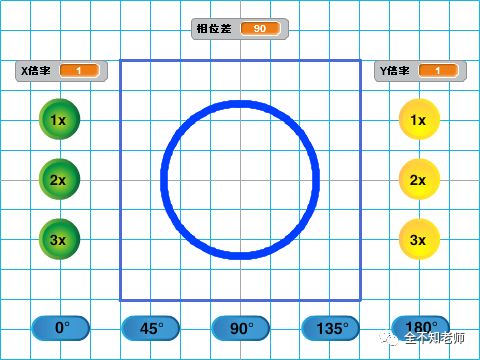
Function Introduction: First, look at the header, which shows the Lissajous Figures when the ratio of the X channel to the Y channel is 1:1, and the phase difference is 90 degrees.
Yes, it is a circle. This is one way to draw a circle.
The buttons on the left side of the screen can adjust the angular frequency of the input signal of the X channel, and pressing the “X” key can draw the signal of the X channel.
The buttons on the right side of the screen can adjust the angular frequency of the input signal of the Y channel, and pressing the “Y” key can draw the signal of the Y channel.
The buttons at the bottom of the screen can adjust the phase difference between the signals of the X channel and Y channel. Pressing the “O” key can draw the composite Lissajous Figures. Here, the situation for the ratio of 1:1 is displayed.
Below is the situation when the ratio of the X channel to the Y channel is 1:2:
The situation when the ratio of the X channel to the Y channel is 1:3:
The situation when the ratio of the X channel to the Y channel is 2:3:
(Only three small videos can be uploaded at a time, and each file has a size limit…)
Haha, doesn’t it look like an oscilloscope?
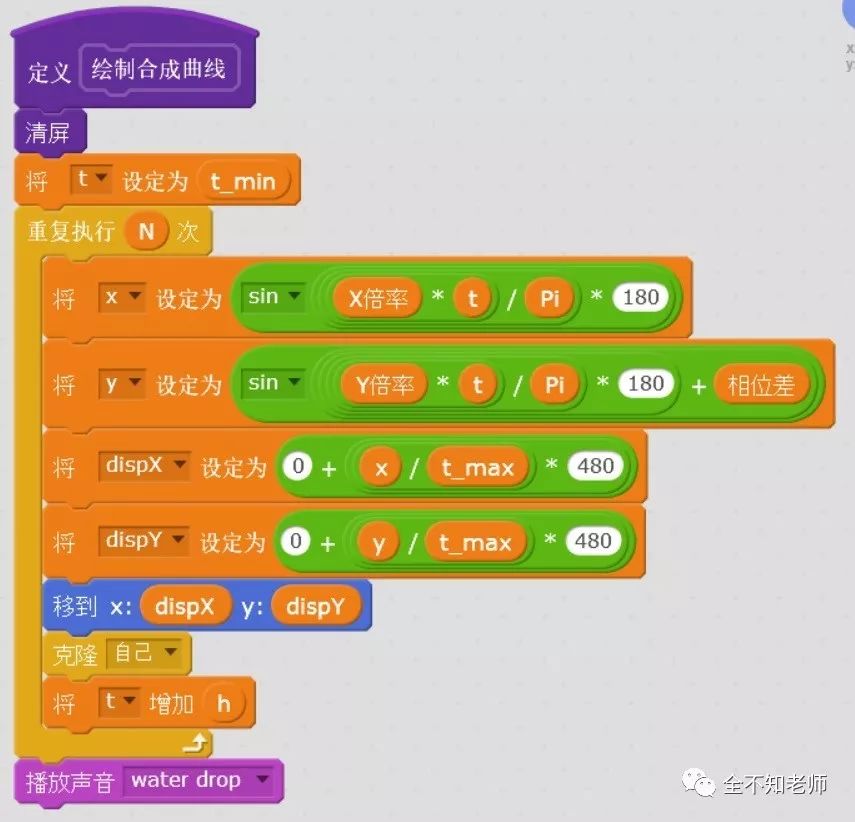
Program Implementation: The small “oscilloscope” has powerful functions. Below, we will only introduce the core part, which is the algorithm for generating Lissajous Figures. As shown:
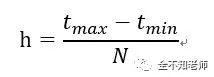
Where x corresponds to the horizontal coordinate, y corresponds to the vertical coordinate. t is the parameter variable, t_min is the lower limit of the parameter t, and t_max is the upper limit of the parameter t, corresponding to [0,2π]. N is the number of loops, and h is the loop step size,
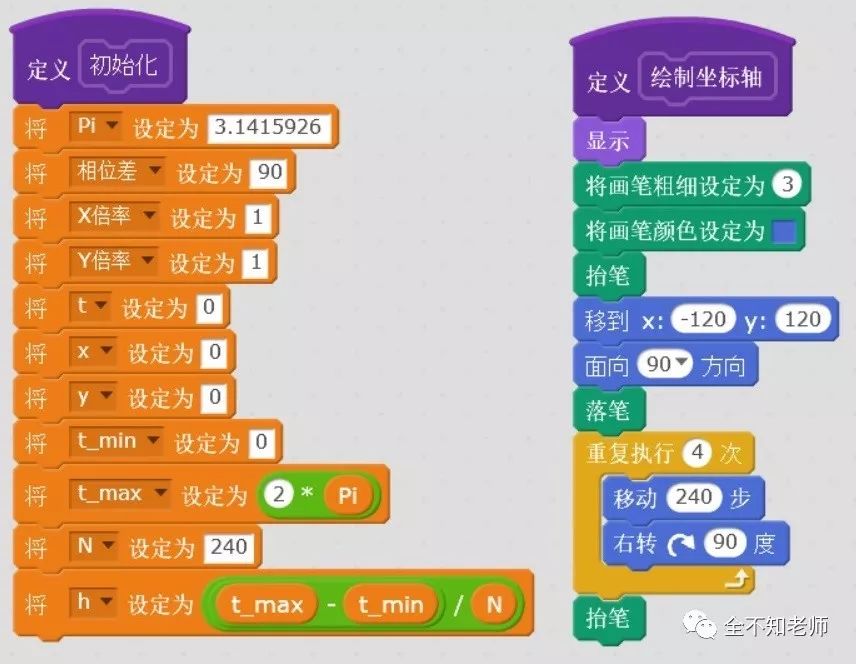
During initialization, the phase difference is set to 90 degrees, the X multiplier is set to 1, and the Y multiplier is also set to 1.
Key Point One: Default Values. In this program, the phase difference corresponds to five values: 0 degrees, 45 degrees, 90 degrees, 135 degrees, and 180 degrees. The X multiplier and Y multiplier correspond to 1, 2, and 3 respectively. The initial values assigned to them when the program runs are called default values. This is a common programming technique that allows the program to run without requiring input values at the start.
Key Point Two: Subroutines. Whether in the “initialization” or “drawing axes” parts, they are written in a way called “blocks” in Scratch. This programming technique is commonly referred to as a subroutine, mainly used in situations where a certain segment of the program needs to run multiple times.
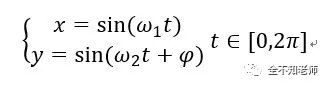
The corresponding parametric equation of the program is:
Key Point Three: Conversion Between Degrees and Radians. In the discussion of trigonometric functions, radians are usually used. 360 degrees correspond to one full rotation, which corresponds to 2π. Thus, the following conversion relationship exists:
In Scratch, trigonometric functions use degrees. To facilitate computer graphics, conversion to radians is required.
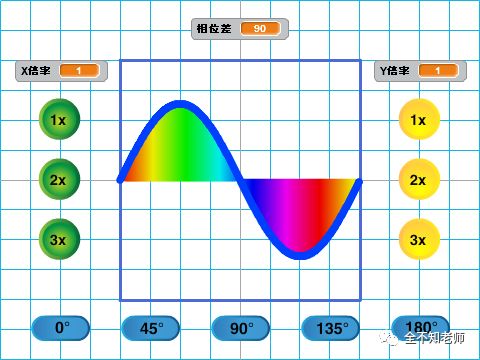
The image when the X multiplier is 1.
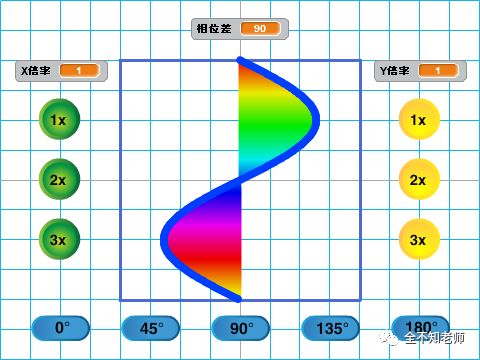
The image when the Y multiplier is 1.
When the phase difference is 90 degrees, the composite Lissajous Figure they form is:
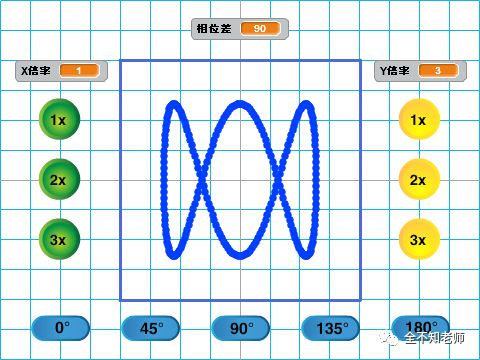
The following image shows when the X multiplier is 1, the Y multiplier is 3, and the phase difference is 90 degrees.
Postscript: The standard form of simple harmonic motion is written in the form of the cosine function. Some students may wonder, since everyone learns and understands the sine function more, why not use the sine function form? The reason is as follows:
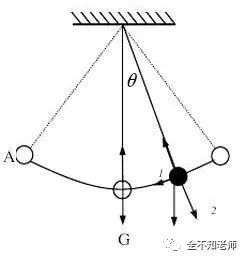
Taking a simple pendulum as an example, when the pendulum is pulled back to a certain angle and then released, it begins to swing. The starting position corresponds to the maximum amplitude, with a speed of 0. When the pendulum reaches the lowest point, the amplitude is 0, and the speed is at its maximum. This corresponds to the graph of the cosine function rather than the sine function.