In the daily service of customers, I often encounter inquiries about the meanings of parameters on the ultrasound interface, how to adjust and set the instrument parameters. I have a keen interest in the application of the instrument, and I have organized the following content based on my understanding.
With the development and widespread application of ultrasound technology, ultrasound has gradually been applied to the discovery of physiological and pathological conditions. To produce better images, just as soldiers must understand their weapons, ultrasound doctors must also understand the influencing factors that generate Doppler signals.
After turning on the instrument and entering the ultrasound interface, wait until the box at the bottom (CV series is at the bottom left, HD5/6/7 is at the bottom right, HD8 is directly below) appears before performing any key operations.
Before adjusting parameters, first check if the display brightness and contrast are within the normal range.

Adjusting parameters that affect spatial resolution, such as frequency, harmonics, line density, and output power, can have a “cosmetic” effect on the image;
Adjusting parameters that affect contrast resolution can have a “makeup” effect.
1. B-Mode Adjustment Parameters
1.Frequency
The higher the frequency, the better the resolution, but the worse the penetration;
The lower the frequency, the worse the resolution, but the better the penetration;
|
Mode |
Icon |
Description |
|
2D Mode |
|
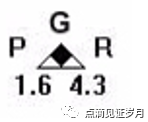
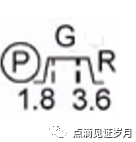
This probe emits and receives frequencies in the range of 1.6 to 4.3 MHz. The black square pointing to G (Grain) indicates that this fusion setting is optimized for texture (Grain). |
|
Tissue Harmonic Imaging |
|
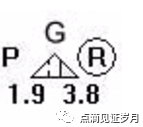
This probe emits a frequency of 1.9 MHz and receives a frequency of 3.8 MHz (twice the emission frequency). The circle near R (Resolution) indicates that this fusion setting is optimized for resolution (Resolution). |
|
|
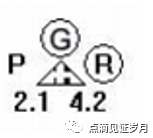
This probe emits a frequency of 2.1 MHz and receives a frequency of 4.2 MHz. The circles around G and R indicate that this fusion setting is optimized for texture and resolution. This icon is used for enhanced pulse inversion settings. |
|
|
Contrast Harmonic Imaging |
|
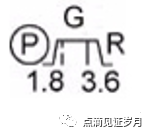
This probe emits a frequency of 1.8 MHz and receives a frequency of 3.6 MHz. The circle near P (Penetrate) indicates that this fusion setting is optimized for penetration (Penetrate). |
|
|
This probe emits a frequency of 1.8 MHz and receives a frequency of 3.6 MHz. The circle near P (Penetrate) indicates that this fusion setting is optimized for penetration (Penetrate). This icon is used for enhanced pulse inversion settings. |
For thin body types, the frequency can be appropriately increased and harmonics added for better resolution;
For obese individuals and elderly patients with significant intestinal gas, it is advisable to avoid harmonics and lower the frequency for observation; the image resolution will decrease, but seeing something is better than seeing nothing.
When harmonics are turned on, the echo signals collected decrease, making the image overall darker compared to when harmonics are off, with the far field appearing even darker.
Using harmonics can balance the advantages of penetration and resolution. For instance, to achieve an image resolution of 5MHz, one can either use a 5MHz emission and reception frequency or use a 2.5MHz second harmonic, where the reception frequency is 5MHz, but the 2.5MHz emission frequency has better penetration than the 5MHz.
2.Compression
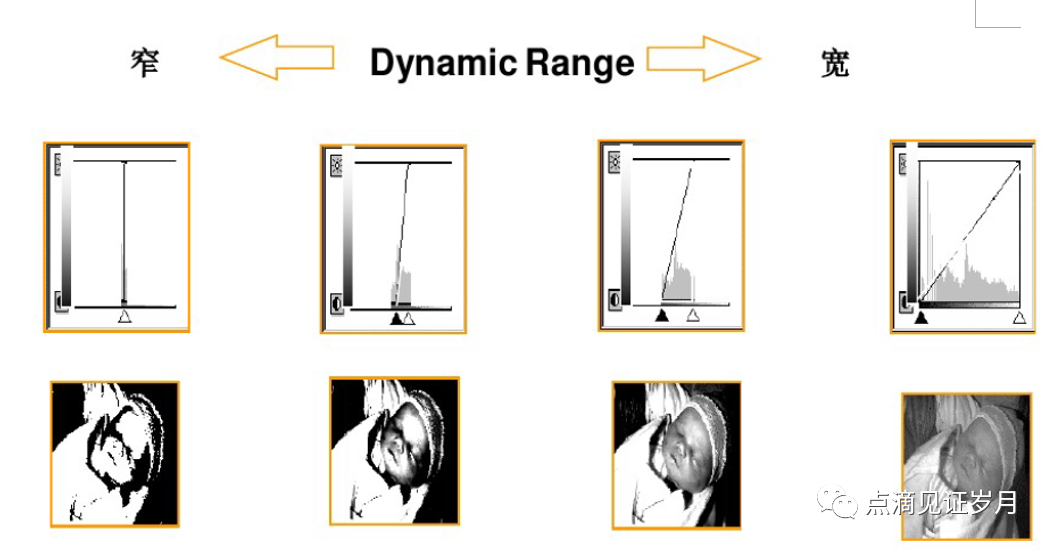
The dynamic range of the instrument’s echo grayscale is 232DB, but the display cannot fully restore the 232DB signal (a good display can restore a dynamic range of 60DB, generally between 30-40DB, and the human eye can only distinguish a dynamic range of 40-50DB), so it is necessary to compress the instrument’s grayscale signal for easier observation.
Similar to scoring in exams, 0-60 is a failing score (black), 60-70 is average (gray), 70-80 is good (bright), and 90-100 is excellent (white).
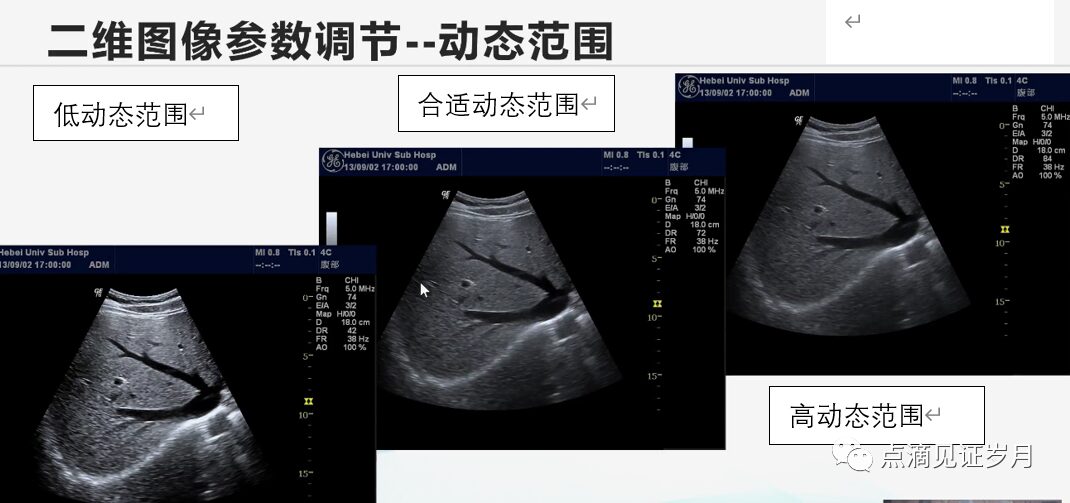
Adjusting the return echo compression will affect the grayscale display effect.
Increasing compression will increase the signal quantity of the image, but also increase noise, making it appear hazy.
Reducing compression will enhance the graininess of the image, making edges sharp, and increasing the contrast between light and dark.
Generally, when observing the heart and blood vessels, compression can be adjusted to between 40-50;
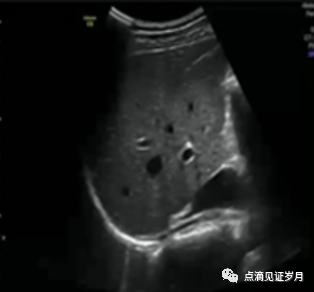
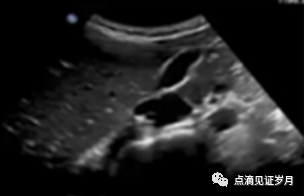
If observing the abdomen, if compression is too low, the low echo tissues will appear very dark, while high echo tissues will appear very bright, similar to the state in the first image. If compression is too high, a hazy feeling will occur, similar to the state in the fourth image.
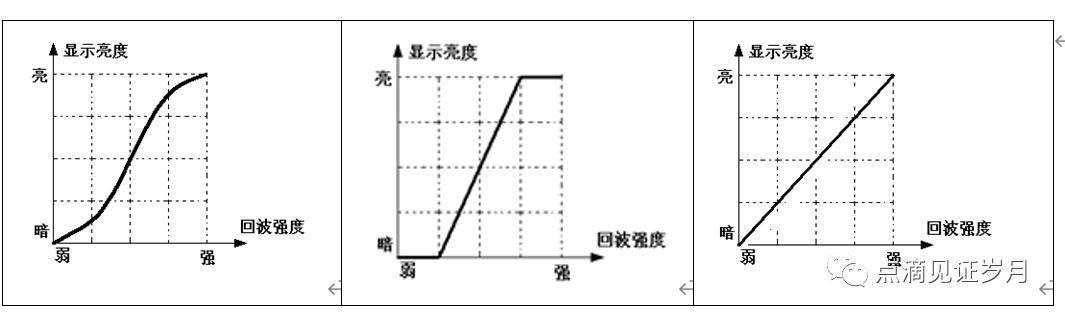
3.Grayscale Image
The dynamic range of the instrument’s output grayscale signal does not match the dynamic range that the display can show, so a function curve is needed to adjust the relationship between the two for easier observation by the operator.
Similar to scoring in exams, a division and rating is made for different score ranges;
Choose an appropriate grayscale image based on the brightness and contrast of the display for suitable image display.
4.Persistence
Persistence refers to the time a light point stays on the screen.
Persistence can evenly distribute continuous images, providing a smoother appearance with less interference.
If persistence is not added, it is like using stairs between two floors; adding persistence is like adding a ramp.
For rapidly moving organs or tissues, such as the heart and large blood vessels, a lower persistence value should be used, while for slowly moving organs or tissues, a higher persistence value can be used.
In C mode, increasing persistence will enhance the color or vascular filling effect and reduce noise, making low-flow low-velocity vessels easier to display.
Excessively high persistence will make the image appear like a slow-motion movie, resulting in a ghosting effect.
Some brand machines use frame correlation to replace this term.
5Smoothing
Smoothing is used to soften or clarify 2D images;
A higher setting makes the image softer;
A lower setting makes the image clearer;
6. SonoCT Real-Time Spatial Compound Imaging
SonoCT imaging collects images using different beam deflection angles and then combines the collected images into one image, similar to a shadowless lamp effect.
Turning on SONOCT will reduce the frame rate but provides the following advantages:
l Reduces speckle and improves image smoothness.
l Enhances contrast resolution.
l Improves contrast and clarity of tissue interfaces.
When observing kidney stones, if there are acoustic shadows behind the stones, it is necessary to turn off SONOCT.
7.XRes Adaptive Image Processing
Can enhance the display effect of the image without changing the image resolution, similar to a filter smoothing function.
XRes processing has the following advantages:
-
Improves contrast resolution
-
Reduces artifacts
-
Increases visibility of tissue texture patterns
-
Improves boundary definition and continuity
XRes processing only affects the black-and-white parts of 2D images and does not affect blood flow data or spectra, with 5 levels of adjustment available.
This function is generally bound to the MAC address of the PC motherboard, and after replacing the PC motherboard, it needs to be reactivated.
Some brand machines refer to it as softening or speckle noise suppression.
8.False Color
There are multiple levels to adjust; when observing certain nodules in gynecology, using wheat-colored false color can make the edges of the nodules clearer.
In M and PW modes, adding false color to the spectrum makes the display more intuitive;
9. iSCAN Intelligent Optimization
By pressing the iSCAN button, multiple settings can be automatically optimized, divided into 2D optimization ATO, color optimization ACO, and spectrum optimization ASO;
In 2D mode, iSCAN can adjust the current image’s TGC and gain settings.
In HD5, the 2D option is actually adjusting the instrument’s frequency.
|
Phenomenon |
Solution |
|
|
2D image appears hazy |
Reduce compression/dynamic range; Reduce or turn off persistence; Turn on harmonics; Select appropriate grayscale image; Adjust 2D optimization, reduce frequency; Select another preset; |
|
|
Image penetration is insufficient |
Reduce frequency Turn off harmonics Increase far field TGC Focus on the far field; Use fat mode |
|
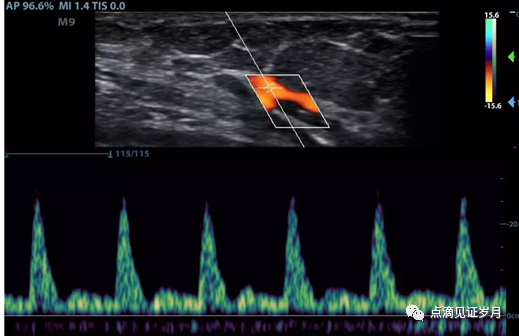
2. Parameters in C Mode
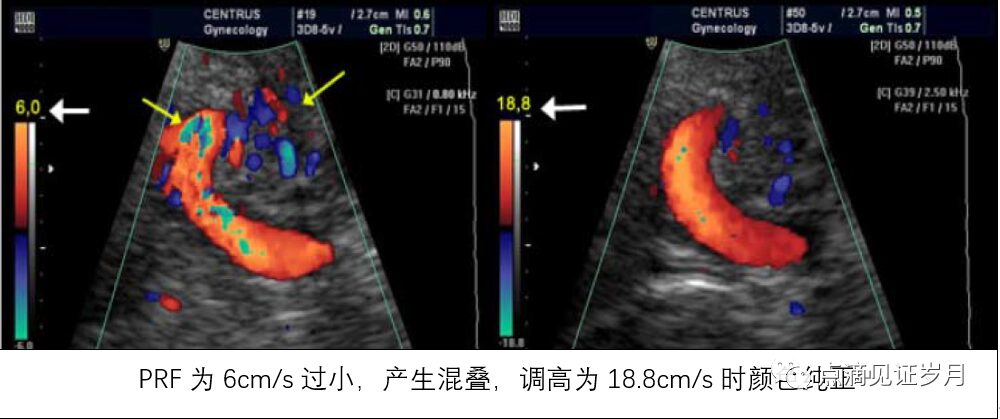
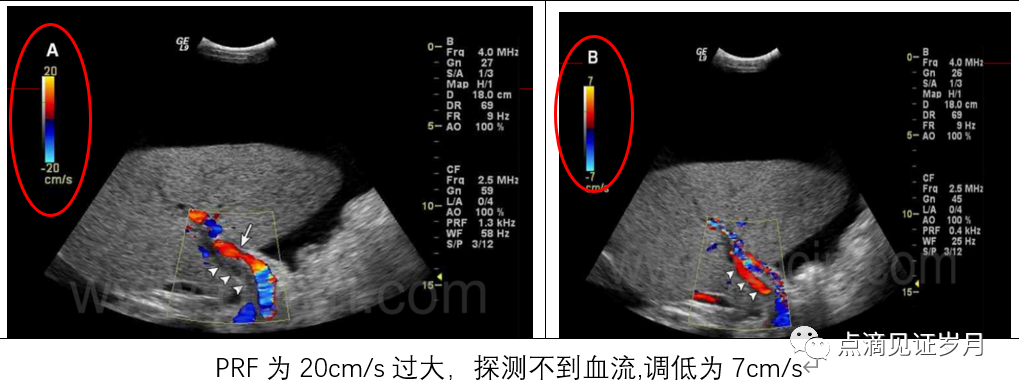
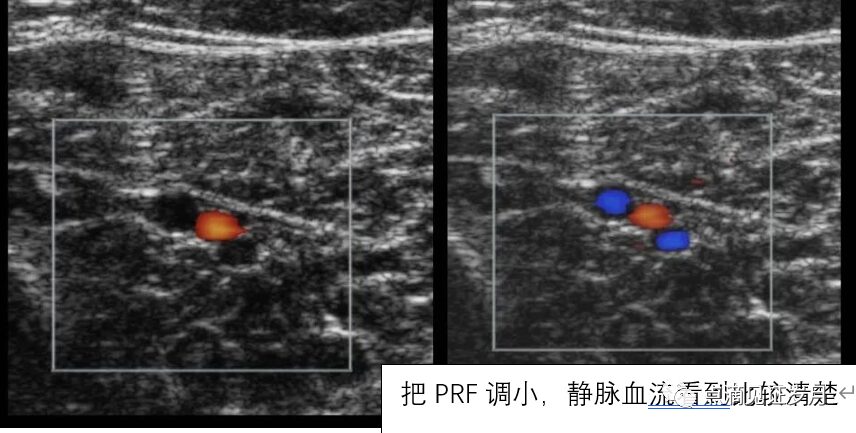
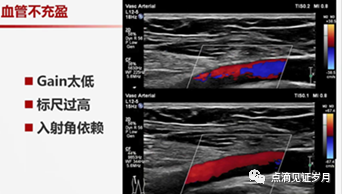
When observing blood flow, generally, first adjust the PRF value corresponding to the blood vessel, with large vessels corresponding to high PRF and small vessels corresponding to low PRF; there are also differences in the same blood vessel among different patients;
On the color scale, the higher the speed, the lighter the color; if the color in the vessel is too light, it means the PRF value selection is too low, and the PRF scale needs to be increased;
Next, increase the color gain until noise appears outside the vessel and then reduce it to an appropriate state.
1.Color Gain
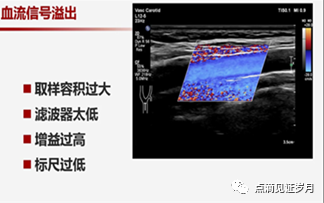
Increasing color gain will also amplify noise, causing red and blue color overflow outside the vessel; if the color gain is too low, the color display of blood flow inside the vessel will be insufficient;
2.Scale
When determining blood flow direction, first check the colors on the upper and lower parts of the color scale; the color displayed above represents flow towards the probe;
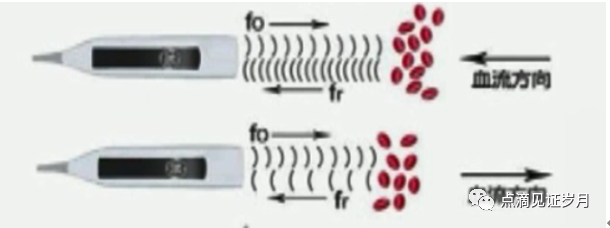
Adjusting the scaleactually adjusts the PRF value.
The speed range setting is too high, making it difficult to detect low-speed blood flow; if set too low, color aliasing occurs.
The speed range should be adjusted to maximize the display of low-speed blood flow without color aliasing.
In the absence of blood aliasing, satisfactory blood flow imaging should have good filling of blood flow within the lumen; no color aliasing; and the central part of the lumen should be brightly colored due to higher flow speed, such as red with a hint of yellow.
Color aliasing value: In liver and kidney punctures, the aliasing phenomenon can indicate postoperative complications that cannot be detected in 2D mode – arteriovenous fistula;
Methods to eliminate aliasing:
❶ Increase Scale (range) to increase pulse repetition frequency;
❷ Adjust the baseline;
❸ Use a lower color frequency;
❹ Use a smaller incident angle;
❺ Use continuous wave Doppler (CW).
3.Baseline
Using the baseline to change the color change scale allows for the decomposition of aliased blood flow and displays more blood flow characteristics.
If the blood flow speed is very high, even by increasing the speed range, the color aliasing phenomenon cannot be eliminated, and moving the color baseline can also improve the maximum detection speed of blood flow, expanding the display range without aliasing colors.
4.Filtering
During Doppler ultrasound examinations, the signals received by the probe come not only from red blood cells but also mixed with signals from the blood vessel walls and surrounding tissue movements, as well as reflexive Doppler signals generated by the patient’s breathing. These signals are characterized by low frequency but large echo signal amplitudes compared to blood flow signals, which can interfere with blood flow detection.
The filter’s role is to remove these low-frequency high-amplitude Doppler signals, allowing only stable blood flow signals with low echo intensity but high frequency shift to enter the signal processor.
Increasing the filter will reduce low-speed echo information and noise;
Reducing the filter will increase the sensitivity of low-speed echo information;
A filter with a high order will not only filter out non-blood flow signals but also filter out low-speed blood flow signals.
The choice of filter should depend on the examination object; in the abdominal field, unless checking high-speed large vessels like the abdominal aorta, the filter is generally adjusted to a lower level;
When detecting venous blood flow, a smaller filter level will display low-speed blood flow more fully.
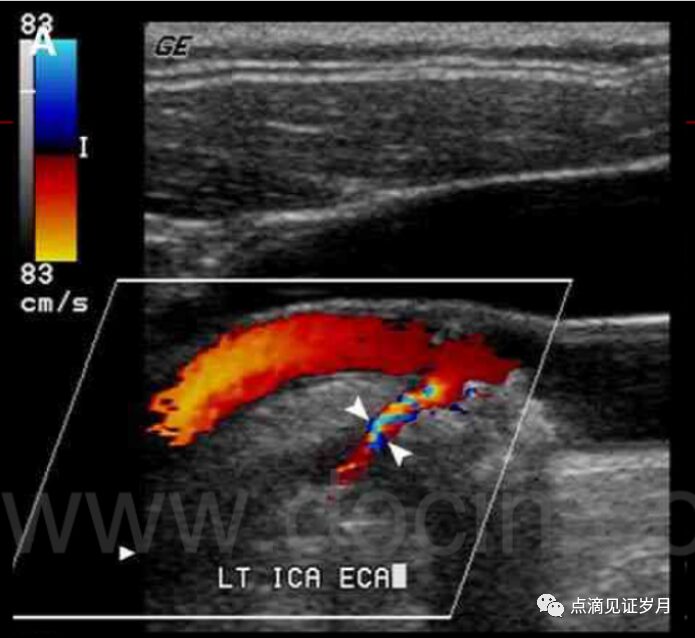
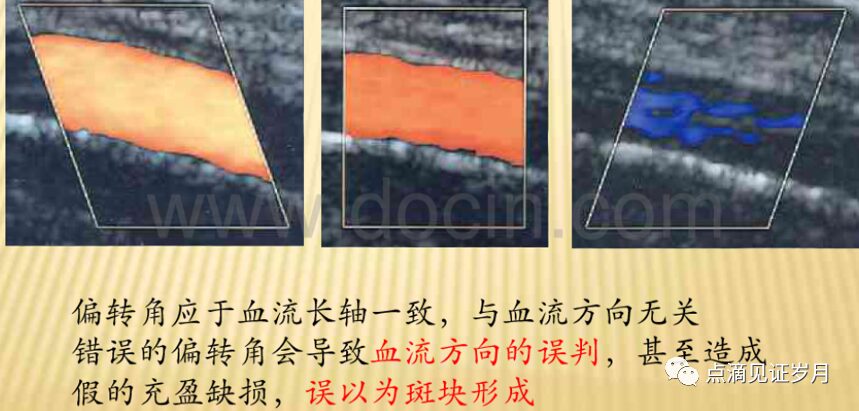
5.Sampling Frame Angle
When using a linear array probe to view blood vessels, align the sampling frame angle along the long axis of the vessel, forming a sharp angle with the vessel for better blood flow filling effect;
6.Frame Rate
To achieve good real-time performance during examinations, a certain frame rate must be maintained.
If the frame rate is too low, real-time performance is poor, and low-speed blood flow signals become difficult to distinguish from color noise.
Rapidly moving organs and blood vessels require a high frame rate for convenient real-time display.
7.Line Density
Adjusting line density specifies the number of ultrasound detection lines; increasing line density can improve lateral resolution and increase the detection rate of certain small lesions.
Increasing line density will reduce the frame rate.
Reducing line density will increase the frame rate.
In some modes under the linear array probe, the color may become blurry after 2D, and increasing line density can restore normalcy;
When observing the heart, line density can be appropriately reduced;
8.Sampling Frame
Under the condition of satisfying the sampling range adjustment, try to minimize the size of the sampling frame.
Increasing the sampling package will increase the detection range of blood flow or energy images but reduce the frame rate.
Reducing the sampling package will decrease the detection range of blood flow or energy images and increase the frame rate.
9.Color Frequency
Adaptive frequency settings apply to certain probe components.
For the selected focal area, adaptive frequency will change the color frequency to the optimal frequency for that probe.
Lowering the color frequency can increase sensitivity to blood flow in deeper tissues;
10. Priority
Using priority to specify the priority level of color data over 2D grayscale data.
When imaging small vessels or slow blood flow, turn on the priority.
11.Black and White Suppression
Using black and white suppression to force the width and position of the 2D image to match the width and position of the color or energy image window.
Reducing the size of the window will increase the frame rate.
This function can only be used with sector and convex array linear probes.
It is very valuable when checking fetal heartbeats.
|
Increasing blood flow sensitivity |
Lower color frequency Increase color gain Lower PRF scale Lower wall filter Increase sampling volume (PW mode) Adjust sampling frame angle and blood vessel long axis intersection angle (linear array probe) Increase color priority Increase acoustic output power |
|
Reducing color overflow |
Lower color gain Increase PRF Increase wall filter Have the subject hold their breath Narrow the color sampling frame |
|
Increasing frame rate |
Reduce color sampling frame Reduce scanning area (depth, angle, width) Lower line density Turn off spatial compound imaging Reduce persistence (frame correlation) |
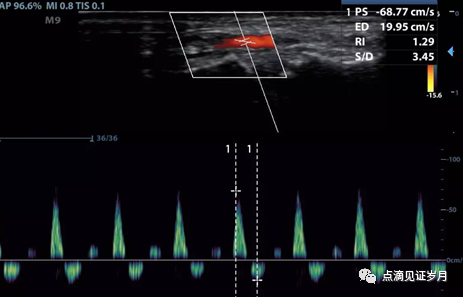
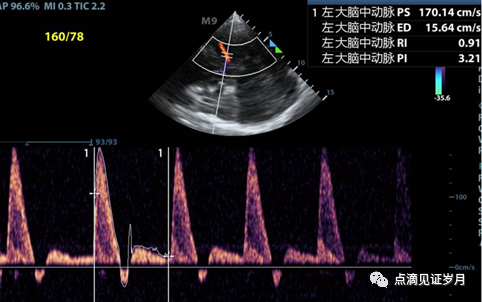
3. Adjustment Parameters in D Mode
Pulsed Doppler (PW)
❶ Measure the speed at a specific point
❷ There is an upper limit on measuring speed (Nyquist limit = 1/2 pulse repetition frequency PRF), usually around 140 cm/s
❸ Key point – spatial accuracy
Continuous Wave Doppler (CW)
❶ Measures the maximum speed along a line but cannot determine the exact position of that speed
❷ Continuous wave Doppler: continuously sends and receives signals without a waiting period, hence no pulse repetition frequency PRF and no Nyquist limit.
❸ Key point – spatial ambiguity
Such as the jet from a narrowed valve, shunting at the ventricular level, shunting between large vessels and heart chambers;
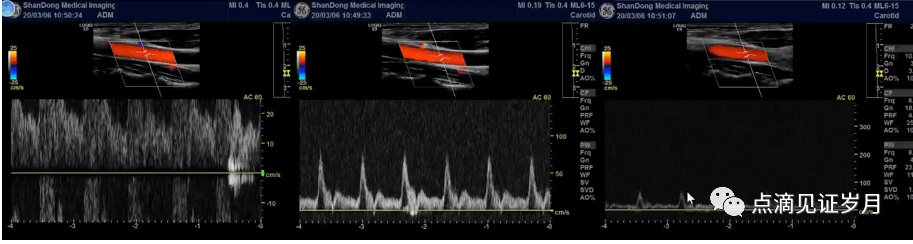
Types of blood flow spectral waveforms:
(1) Steady blood flow (portal vein flow) is unrelated to heartbeats, showing no peaks, flowing at a constant speed;
(2) Venous biphasic blood flow (hepatic venous flow) is synchronized with the cardiac cycle, displaying two peaks for each heartbeat;
(3) Arterial pulsatile blood flow (arterial blood flow) displays peaks during systole and the lowest flow speed during diastole, synchronized with the cardiac cycle.
The baseline flow speed is 0; generally, the waveform above the baseline indicates blood flow towards the probe, while the waveform below the baseline indicates blood flowing away from the probe.
The vertical axis represents flow speed, and the horizontal axis represents time.
The brightness of the spectrum indicates the intensity of the distribution of blood flow speeds.
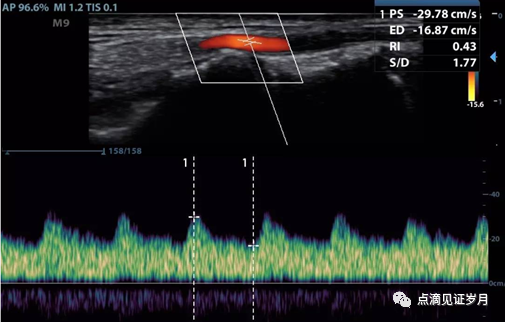
Manual tracing method to measure PI.RI
1.Sampling Volume.
The spectral Doppler evaluates blood flow speed and its changes by detecting the frequency shift signals within the sampling volume range.
The position of the sampling volume is usually placed in the center of the blood vessel.
The distribution of blood flow speed within the blood vessel is not uniform; generally, the flow speed is higher in the center of the lumen and lower near the vessel walls due to resistance.
If the sampling volume is small and placed in the center of the blood vessel, only fast-flowing blood can be measured. To obtain more blood flow speed information, the sampling volume range should be set wider, ideally about 1/2 to 2/3 of the inner lumen of the blood vessel.
However, it should not overlap with the vessel wall to avoid interference from the reflexive Doppler signals generated by the pulsation of the vessel wall.
If it is a relatively thin vessel (such as vessels within a tumor), the sampling volume can be adjusted to match the width of the blood flow.
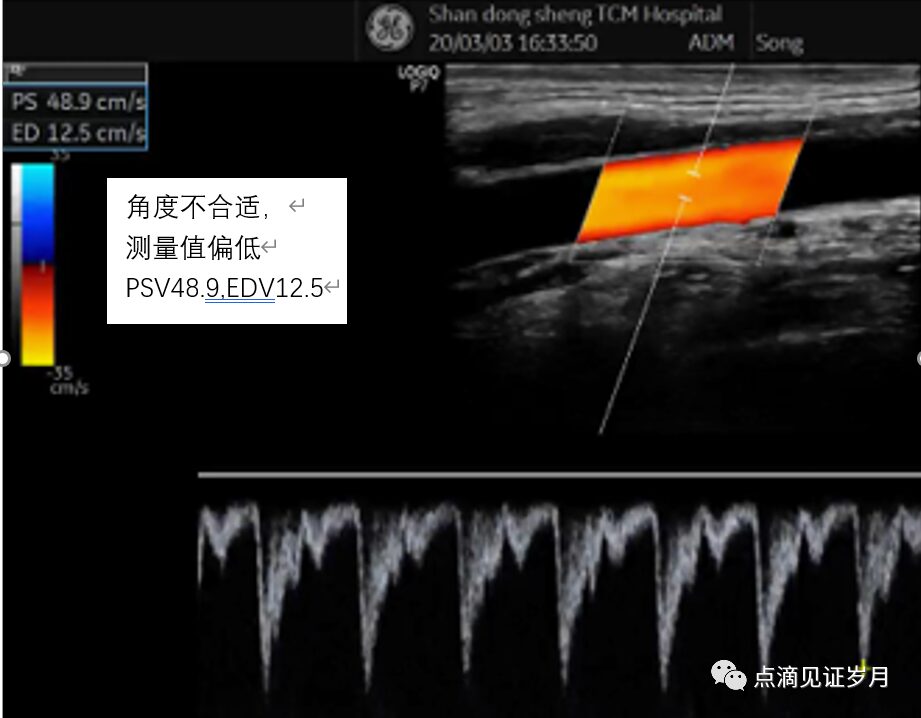
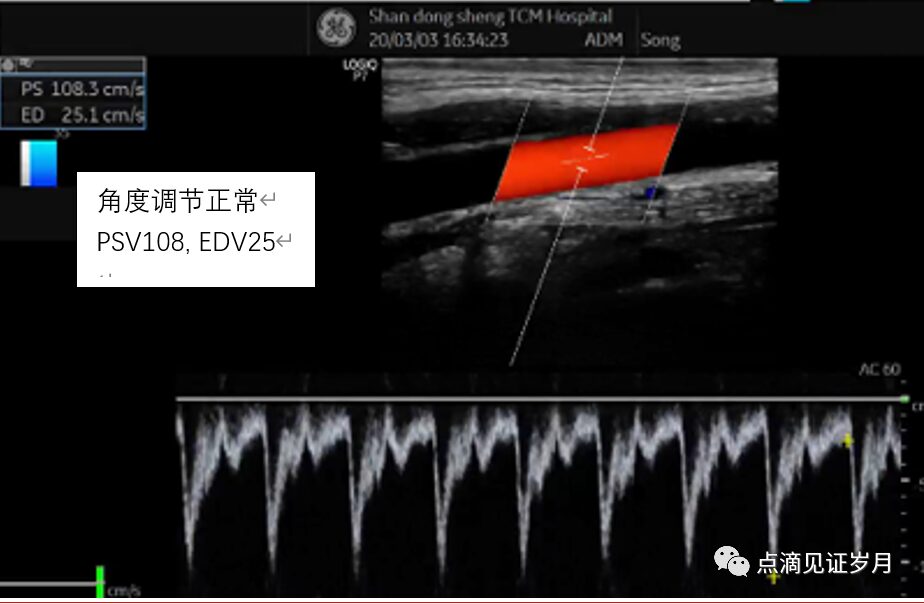
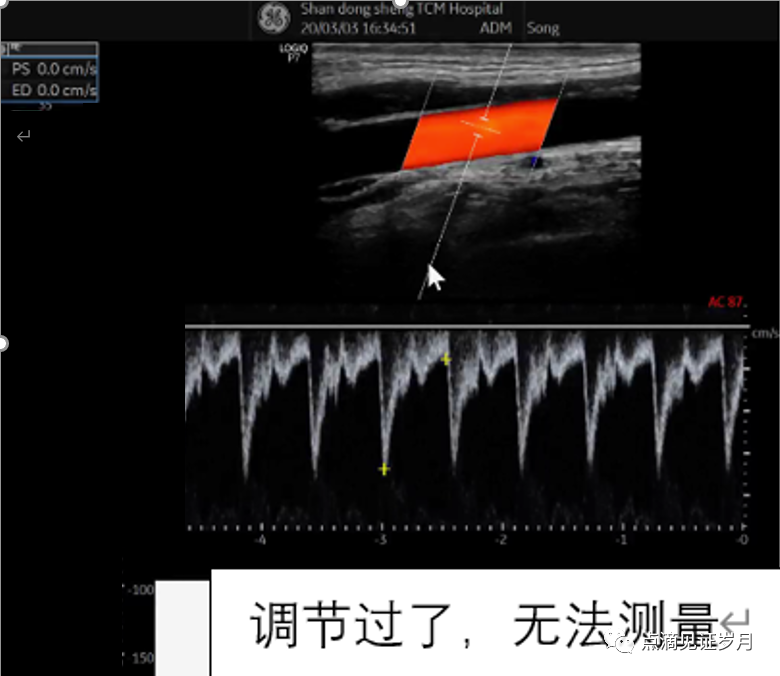
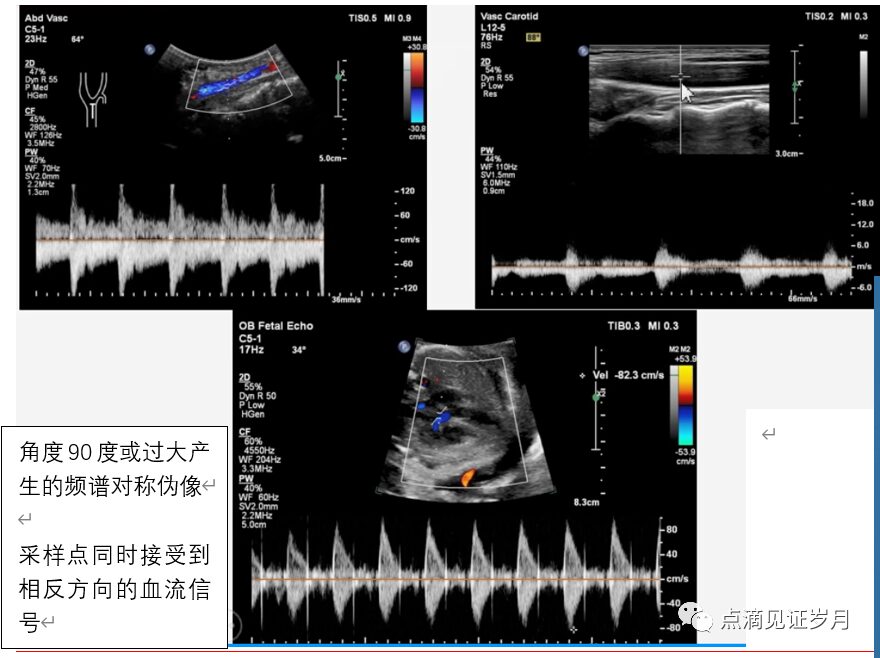
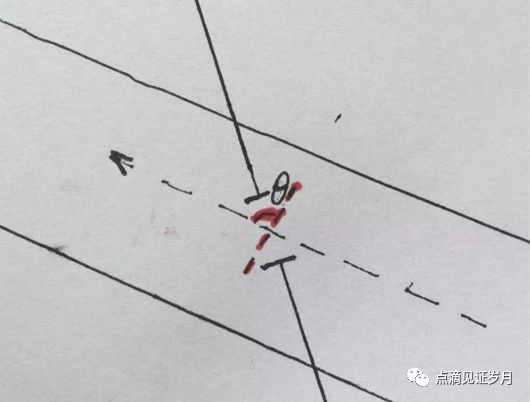
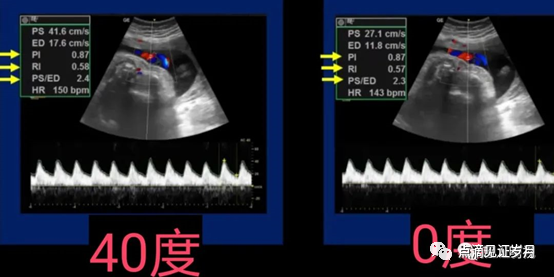
2.Angle Correction
This is a necessary step for quantitatively detecting blood flow speed. To accurately measure flow speed,the sampling should be done along the long axis of the vessel rather than the short or oblique axes, so the ratio of the length to the diameter of the measured blood vessel should be as large as possible.
Additionally, the long axis of the vessel should be as parallel to the sampling line as possible; generally, it should not exceed 60 degrees to keep the measurement error within an acceptable range.
In practice, adjusting the sampling line angle does not change the angle of the Doppler sound speed; its real effect is to measure the size of the angle between the sound speed and the blood flow angle being measured, which is calculated during post-processing to determine blood flow speed.
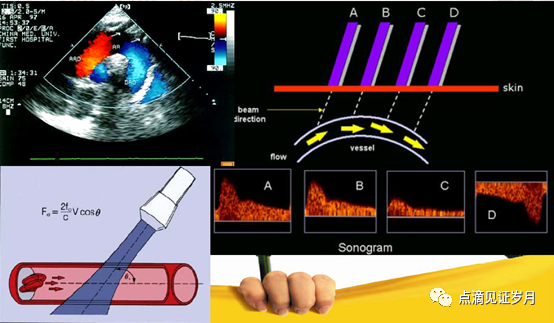
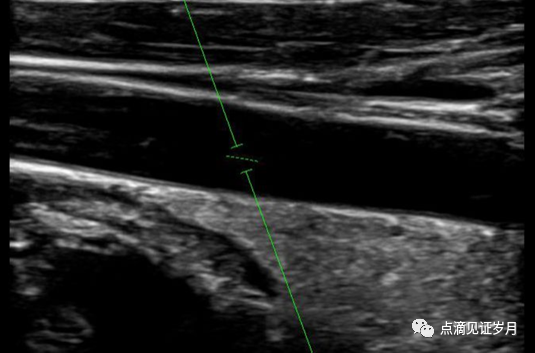
The sampling line is almost parallel to the blood vessel.
The following ratio parameters are independent of the sampling angle, including
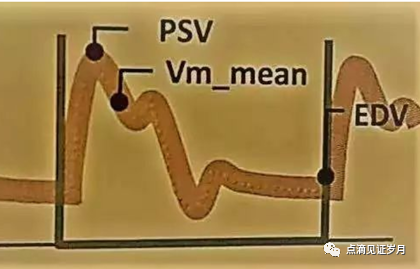
S/D ratio (PSV/EDV)
PI(PSV-EDV/TAMV) TAMV=(PSV+EDV)/2
RI(PSV-EDV/PSV).
The variation of the sampling angle synchronously affects the values of PSV and EDV, so the sizes of S/D, PI, and RI are unaffected.
3.Scale
Adjust the range on the right side of the Doppler spectrum to measure blood flow speed; the greater the blood flow speed, the larger the scale range needs to be adjusted.
This function can only be used when the spectrum is active.
4.Baseline Shift
When the baseline position is maximally shifted up or down, the measurable range of blood flow speed can be doubled.
Adjusting the baseline in the Doppler spectrum to set the zero baseline position allows for complete display of spectral images that exceed the range;
Complete spectrum display ensures accurate measurements.
This function can only be used when the spectrum is active.
5.Spectrum Doppler Filtering
Also known as wall filtering, operates on the same principle as in C mode.
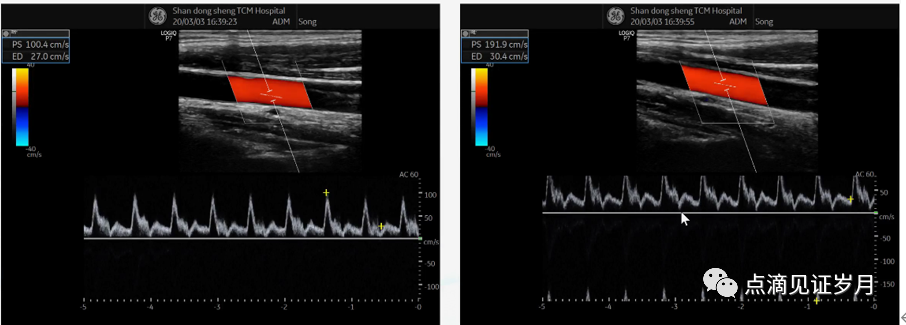
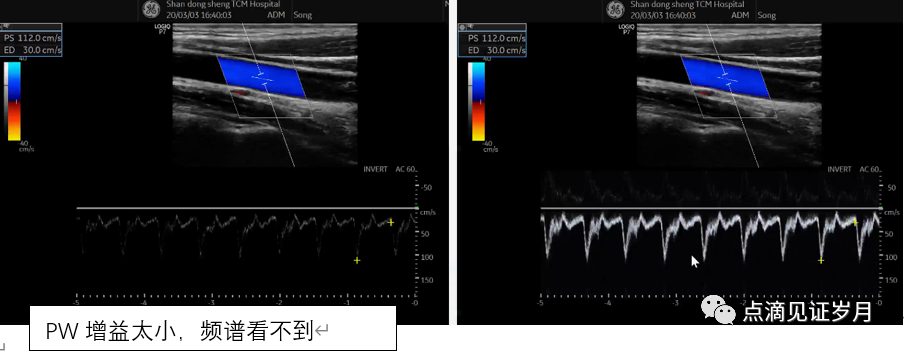
6.Spectrum Doppler Gain
PW gain should be adjusted so that the spectral curve is bright and clear, with sharp edges and a clean background.
If the PW gain is adjusted too high, the brightness of the spectrum will be saturated, edges will be rough, and the background will show snowflake-like noise.
If the PW gain is adjusted too low, the spectral curve will be dim, and the spectral boundary will not be clear.
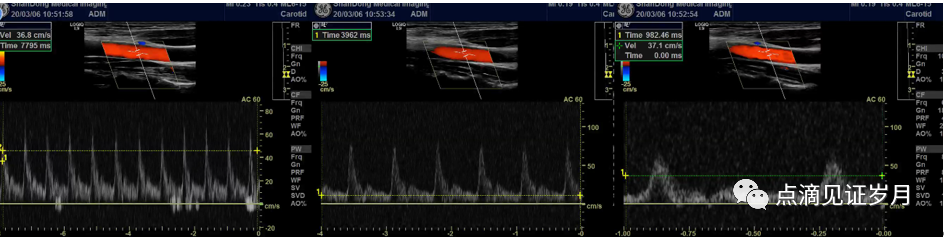
7.Scanning Speed
Increasing scanning speed can reduce the number of spectral waveforms displayed within the display area, elongating the frequency window and improving detail display;
For example, when measuring venous reflux, AVO, AVC
8.Suppression
Using suppression to obscure background noise in the spectrum.
For strong Doppler signals, suppression should be increased;
For weak signals, suppression should be reduced.
9.PW Inversion
Using PW inversion to reverse the spectral display so that positive values (indicating blood flow movement towards the probe) appear below the Doppler baseline, while negative values (indicating blood flow movement away from the probe) appear above the Doppler baseline, facilitating measurement and envelope detection.
PW inversion also swaps stereo audio channels.
Only when the spectral tracing is active can this function be used.