▼Click the image below to search for the secret code【001】, and immediately receive154 pages of Linux study notes.

What Is the Difference Between CPU Utilization and CPU Load?
When mentioning CPU utilization, one must understand the time slice. What is a CPU time slice? The operating systems we currently use, such as Windows, Linux, and Mac OS, are all “multi-tasking operating systems”, which means they can “simultaneously” run multiple programs, such as browsing the web in Chrome while listening to music.
However, in reality, a single CPU core can only do one thing at a time. So how does the operating system achieve “multi-tasking”? The general method is to allow multiple processes to take turns using the CPU for a small amount of time. Since this “small amount of time” is very short (between 5ms and 800ms on Linux), users do not feel it, making it seem like several programs are running simultaneously. The “small amount of time” mentioned above is what we refer to as the CPU time slice. Modern time-sharing multi-tasking operating systems allocate CPU time in time slices.
CPU utilization refers to the degree of CPU time slice usage by a program, that is, CPU utilization = CPU time slice used by the program / total time. For example, if process A occupies 10ms, then process B occupies 30ms, then idle for 60ms, and so on, if this pattern continues over a period of time, then the CPU utilization during that time is 40%. CPU utilization reflects the real-time percentage of CPU occupied by the program during its execution.
Most operating systems categorize CPU utilization into user mode CPU usage and system mode CPU usage. User mode CPU utilization refers to the percentage of time spent executing application code out of the total CPU time. In contrast, system mode CPU utilization refers to the percentage of time spent executing operating system calls out of the total CPU time. A high system mode CPU utilization indicates competition for shared resources or a large amount of interaction between I/O devices.
CPU load, on the other hand, displays the average number of tasks currently using and waiting to use the CPU over a period of time.
To simplify, one represents the real-time usage of the CPU, while the other represents the current and future usage of the CPU. For example, if I have a program that needs to continuously use the CPU’s computational power, then at this time, the CPU utilization might reach 100%, but the CPU load would be close to “1” because the CPU is only responsible for one task! If two such programs are executed simultaneously, the CPU utilization remains at 100%, but the load would become 2. This means that the greater the CPU load, the more frequently the CPU has to switch between different tasks. Regardless of whether the CPU utilization is high or low, it has no inherent relationship with how many tasks are queued (CPU load).
If it’s a single-core CPU, a load of 1 indicates that the CPU is already at full capacity. If it exceeds 1, subsequent tasks will have to wait in line for processing. If it’s a multi-core, multi-CPU setup, for example, if there are 2 CPUs, each with 2 cores, then a total load of up to 4 is acceptable.
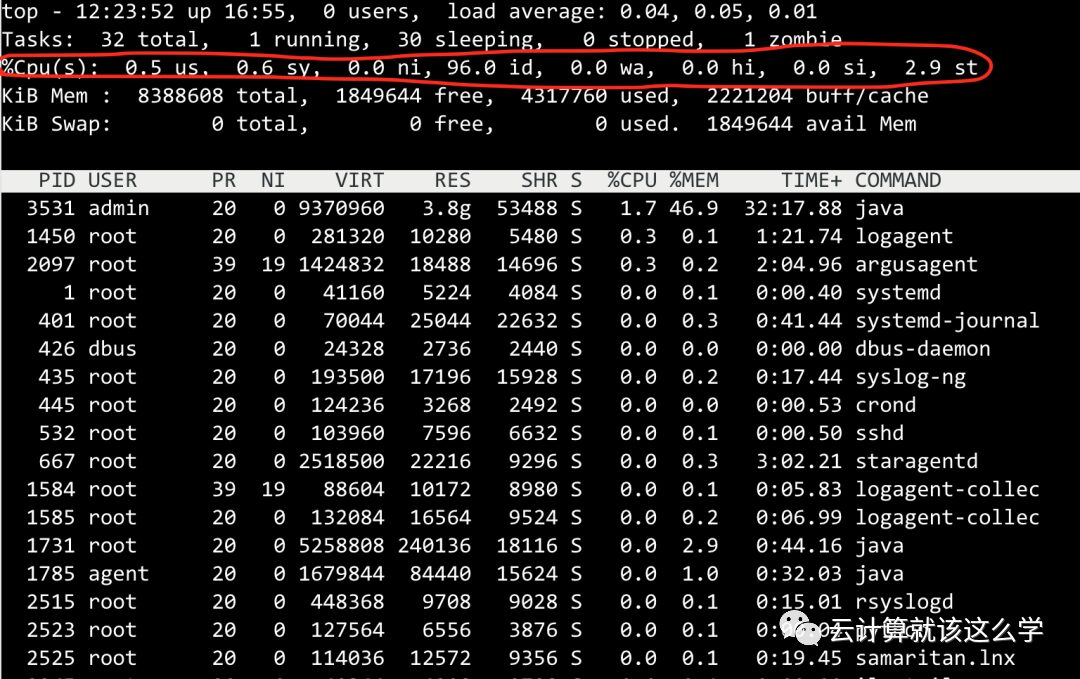
You can check the average CPU load using the uptime and w commands, and the top command can show the overall CPU load utilization as well as the CPU usage ratio of each process.
Check the number of physical CPUs
cat /proc/cpuinfo| grep "physical id"| sort | uniq| wc -lCheck the number of cores in each physical CPU
cat /proc/cpuinfo| grep "cpu cores" | uniqCheck the number of logical CPUs
cat /proc/cpuinfo| grep "processor"| wc -lIf the CPU load is very high but the utilization is very low, what should you do?
A high CPU load with low utilization indicates that there are many tasks in a waiting state. The higher the load, the more likely there are many zombie processes. This situation is typically caused by I/O-intensive tasks, where a large number of tasks are requesting the same I/O, resulting in a backlog in the task queue.
Common scenarios that cause low CPU utilization and high load in a production environment include the following:
Scenario 1: Excessive disk read/write requests leading to a lot of I/O wait
When a process runs on the CPU, it needs to access disk files. At this point, the CPU will initiate a request to the kernel to fetch the file from the disk, causing the CPU to switch to other processes or become idle. This task will transition to an uninterruptible sleep state. When there are too many read/write requests, it leads to too many processes in uninterruptible sleep state, resulting in high load and low CPU utilization.
Scenario 2: MySQL statements without indexes or deadlock situations
We know that MySQL data is stored on disk. If an SQL query is required, the data must first be loaded from disk into memory. When the data is particularly large, executing SQL statements without indexes can lead to scanning too many rows in the table, causing I/O blocking, or if there are deadlocks in the statements, it will also cause I/O blocking, leading to too many processes in uninterruptible sleep state and excessive load.
Similarly, you can first observe using the top command. Suppose you find that there is indeed high load and low utilization.
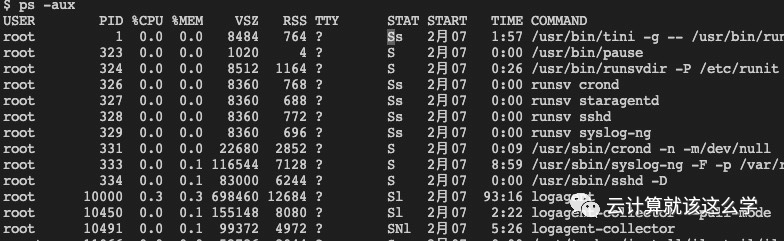
Then, use the command ps -aux to check if there are any processes in state D. This state refers to processes that are in an uninterruptible sleep state. Processes in this state cannot be terminated or exit on their own; they can only be resolved by restoring their dependent resources or restarting the system. The following image shows that there are no processes in D state.
Five states of processes in Linux
R (TASK_RUNNING): Executable state, only processes in this state may run on the CPU. Multiple processes can be in an executable state at the same time.
S (TASK_INTERRUPTIBLE): Interruptible sleep state, processes in this state are suspended waiting for a specific event to occur (e.g., waiting for a socket connection, waiting for a semaphore).
D (TASK_UNINTERRUPTIBLE): Uninterruptible sleep state, the process is in sleep state but cannot be interrupted at this moment. The significance of TASK_UNINTERRUPTIBLE state is that certain kernel processing flows cannot be interrupted.
T (TASK_STOPPED or TASK_TRACED): Stopped state or traced state. Z (TASK_DEAD – EXIT_ZOMBIE): Exit state, the process becomes a zombie process. The process has terminated, but its process descriptor remains until the parent process calls wait4() system call to release it.
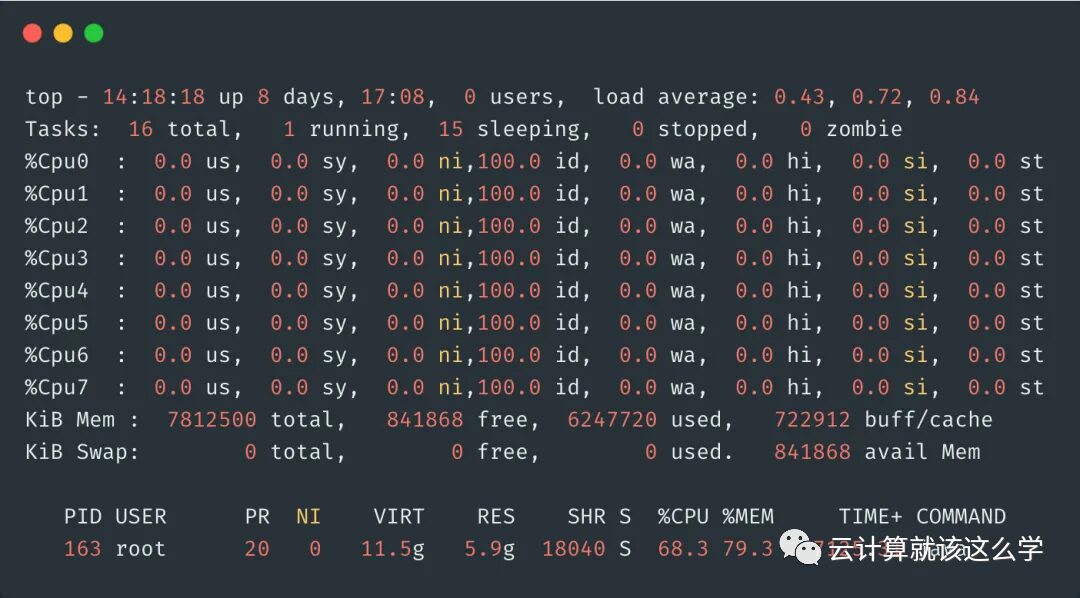
If the CPU load is very low but utilization is very high, what should you do?
This indicates that there are not many tasks for the CPU, but the execution time of the tasks is very long. Most likely, there is an issue with the code you wrote, typically due to compute-intensive tasks that generate a large number of short-duration computing tasks.
How to troubleshoot? Directly use the top command to find the process with the highest CPU utilization and check it out. If there are no issues with the code, then the CPU utilization will decrease after a while. Past interview question summaries: 250 issues of interview materials
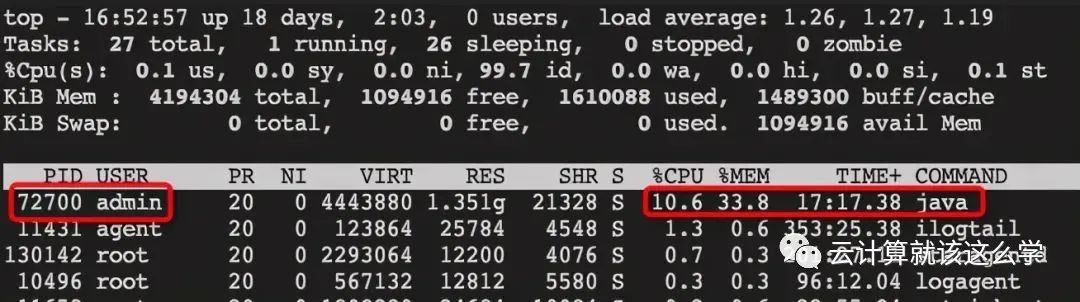
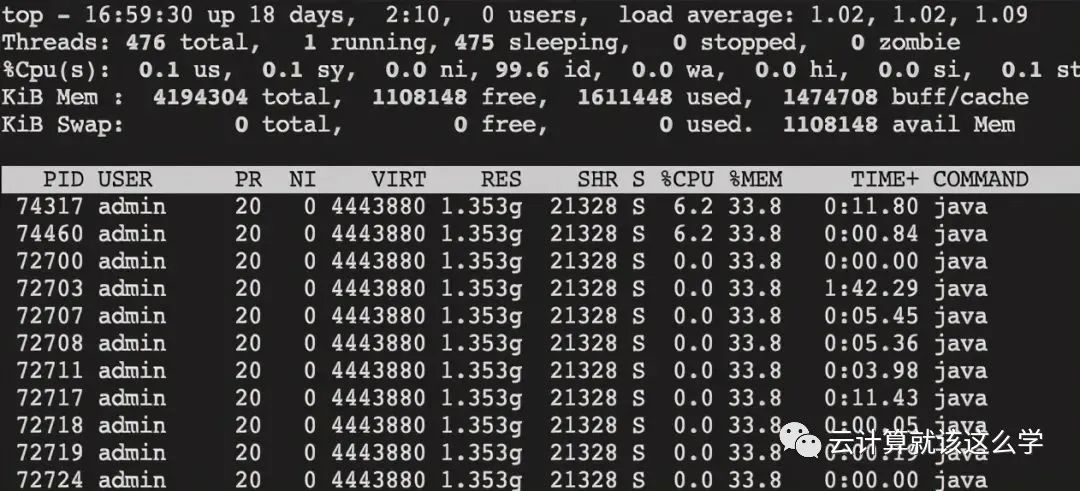
How to troubleshoot when CPU utilization reaches 100%
1. Use top to find the processes with high CPU usage
2. Use top -Hp pid command to view the thread IDs with high CPU usage
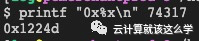
3. Convert the thread ID to hexadecimal, printf “0x%x\n” 74317, resulting in 0x1224d
4. Use the command jstack 72700 | grep ‘0x1224d’ -C5 –color to find the problematic code
Note: The target of jstack is the PID of the Java process, not the PID of the Java thread.
Common Linux Commands
Common File/Directory Commands
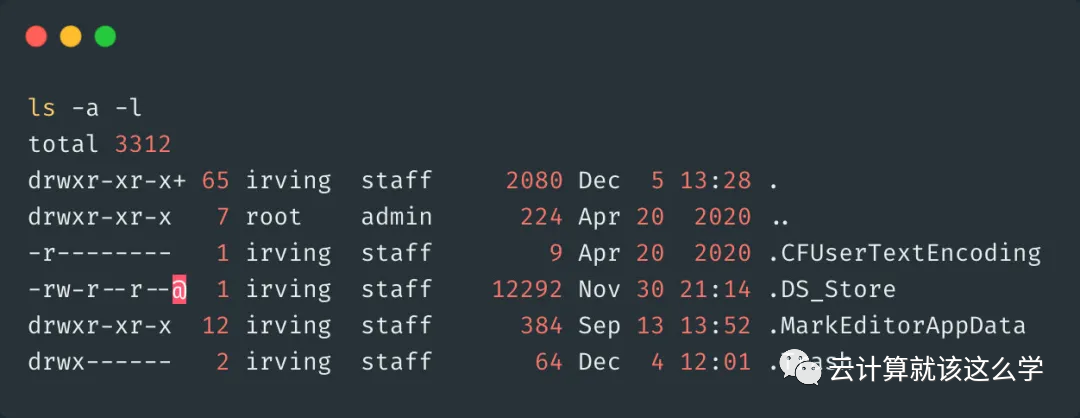
ls: Used to view files in a directory. ls -a can be used to view hidden files, ls -l can be used to view detailed information about files, including permissions, size, owner, etc.
touch: Used to create a file. If the file does not exist, a new file is created; if the file exists, the timestamp of the file is modified.
cat: The abbreviation of concatenate, used to view file contents. Using cat to view a file will display all its contents at once, so it is not suitable for viewing very large files.
more: Similar to cat, more is used to display file contents page by page. You can use the space bar to scroll down and the b key to scroll up.
less: Similar to more, less is used for line-by-line display.
tail: This is probably the most commonly used command for checking log files. tail -fn 100 xx.log checks the last 100 lines of content.
Common Permission Commands
chmod: Modify permission command. Generally, + is used to add permissions, – is used to delete permissions, x represents execute permission, r represents read permission, w represents write permission. A common usage is chmod +x filename to add execute permission.
There is also another way to grant permissions using numbers, because r=4, w=2, x=1. So when executing chmod 777 filename, this grants the highest permissions.
The first number 7=4+2+1 represents the permissions of the owner, the second number 7 represents the permissions of the group, and the third number represents the permissions of others. Common permission numbers include 644, which grants read and write permissions to the owner and read-only permissions to others, and 755, which grants read and execute permissions to others.
chown: Used to change the owner and group of files and directories. General usage chown user filename is used to change the file owner, chown user:user filename changes both the owner and the group of the file, where the colon separates the owner and the group. Past interview question summaries: 250 issues of interview materials
Common Compression Commands
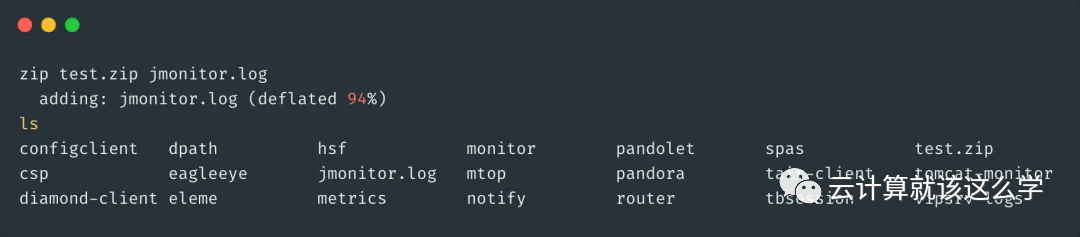
zip: Command to compress zip files, for example, zip test.zip filename can compress a file into a zip file, and if compressing a directory, the -r option must be added.
unzip: The command to decompress zip files. unzip xxx.zip directly decompresses, and you can also specify the decompression directory with the -d option.
gzip: Used to compress files with .gz suffix. The gzip command cannot package directories. Note that directly using gzip filename will cause the source file to disappear. To keep the source file, you can use gzip -c filename > xx.gz; to decompress, use gzip -d xx.gz.
tar: The tar command can create archives for Linux files and directories. Using tar, you can create an archive (backup file) for a specific file or change files in the archive or add new files to the archive. Common options for tar include -x for unpacking, -c for packing, -f to specify the archive file name, and -v to display the packing process. Generally, the common usage is tar -cvf xx.tar filename to pack, and to unpack, use tar -xvf xx.tar.
First, it’s important to understand the two concepts: packaging and compression. Packaging refers to turning a bunch of files or directories into a single file; compression refers to reducing a large file into a smaller file using compression algorithms. Why distinguish between these two concepts? This is because many compression programs in Linux can only compress a single file, so when you want to compress a bunch of files, you first have to package them into one (using the tar command) and then use a compression program (like gzip) to compress them.
In Linux, packaging and compression are separate operations. If you want to package and compress at the same time, you must first use tar to package and then use gzip to compress. Of course, there is a better way using the -z option to do both.
Use the command tar -zcvf xx.tar.gz filename to package and compress, and use the command tar -zxvf xx.tar.gz to decompress.
New Courses Recently Added:
Linux System Administration | Linux Service Management | MySQL Database Management | Shell Scripting | Python Introduction | Asible Automation Operations | Enterprise KVM Virtualization | Kubernetes Container Orchestration | Docker | Large Website Clusters | ELK Log Center | Zabbix