Abstract
The network dedicated line service is a transparent channel service provided by operators for customers in various industries to establish internal networks across regions. As an important component of operators’ business revenue, the market competition for network dedicated lines is always fierce. Efficiently and quickly meeting the rapid access needs of different customers is a key focus for operators in network construction. This paper proposes a heat value analysis method for network dedicated lines, which shifts the demand forecasting method from passive collection to active analysis through information extraction, model construction, grid mapping, and heat output, providing a reference for matching construction needs and precise investment in network construction.
Introduction
The network dedicated line service mainly provides point-to-point and point-to-multipoint networking channel services for customers. Operators provide differentiated service assurance capabilities based on the characteristics of different business demands. High-value industry customers such as government, military, finance, and large enterprises have extremely high requirements for the quality of service (Quality of Service, QoS) in terms of security, reliability, and latency performance of network circuits. Traditional multi-service transport platform (MSTP) networks struggle to meet the capacity, protection, and latency requirements for carrying these demands. The packet-enhanced optical transport network (OTN) integrates massive bandwidth from wavelength division multiplexing (WDM) technology, flexible wavelength scheduling, routing recovery mechanisms, and optical data unit (ODU)/packet (PKT)/virtual container (VC) sub-rate processing capabilities, making it the preferred carrier network for high-quality network dedicated lines.
During the construction of OTN networks, the construction of the backbone layer, core layer, and aggregation layer follows relatively regular patterns. However, the business demands at the access layer are difficult to predict, especially for important dedicated line customers who have high business value, strong circuit burst characteristics, and fast response requirements. When deploying access layer networks, it is essential to focus on responding to such customers. This paper analyzes the problems with traditional demand analysis methods based on survey interviews and circuit predictions, proposing a proactive analysis method based on customer value, distribution range, and regional heat, focusing on the capability satisfaction of high-value customer aggregation areas, guiding precise network construction, and improving investment efficiency.

01
Problems with Traditional Demand Analysis Methods
The construction cycle of the network carrying government and enterprise services is generally measured in years. When preparing construction plans, there are mainly two traditional forecasting methods for network dedicated line business demands: one is to collect demand in deterministic incremental areas through surveys, focusing on ensuring network capacity in that area; the other is to estimate the development trend of demand based on historical business development data in the system and use this to prepare construction plans. The correlation between traditional business demand forecasting and station equipment construction is relatively low, and the network access capacity in some areas struggles to meet the rapid access needs of burst business, especially for bidding projects for high-value customers. Efficient access capability and excellent network quality are key factors affecting project success. Therefore, the construction should start from the customer perspective, be business-driven and data-driven, improve the matching degree between network construction and business demands, and enhance investment precision.

02
Heat Value Analysis Method for Network Dedicated Lines
This method centers on customer distribution, focusing on analyzing customer-related data. By creating customer profiles, typical customer characteristics are generated; combined with market opportunity information, the most convenient business access areas for existing and potential customers (such as the operator’s comprehensive business access area) are used as aggregation targets to map the distribution of all customers to their respective areas. Based on customer profile characteristics and the development forecast of existing businesses, the government and enterprise heat and capability demand for each comprehensive business access area are output. The government and enterprise heat and capability demand of the comprehensive business access area are benchmarked against network resources, and the total investment amount is integrated to guide network capability construction and project prioritization, enhancing investment efficiency. The data-driven demand analysis method for network dedicated lines can be summarized in four steps: “Extract Information, Build Models, Implement Grids, Calculate Heat,” ultimately outputting the ranking of government and enterprise customer heat values for each area, thereby guiding precise investment in network construction and rolling updates.
2.1 Extract Information
Information collection includes two aspects: demand and network. Demand collection is used for business-level analysis, mainly including customer location, customer name, activation time, business bandwidth, circuit rental fees, etc.; network information collection is used for capability analysis, mainly including station distribution, business access range, equipment types, network utilization, port capacity, etc.
2.1.1 Demand Information Collection
The sources of demand information are based on the distribution of potential market opportunities, which are used for aggregating similar types of customers; on the other hand, it is based on the extraction of existing customer information, which is used for inputting basic data for customer profiling.
Potential opportunity information can be obtained in various forms, such as opportunity reserves from front-end departments, publicly available information from important customer websites, etc. In summary, under legal and reasonable premises, all possible potential customer distribution locations within the area should be collected as comprehensively as possible to provide basic analysis data for business aggregation.
The extraction of existing customer information is relatively simple and can be based on the operator’s existing business support system (Business Support System, BSS) and operational support system (Operation Support System, OSS) to extract various key information, mainly including customer location, customer name, activation time, business bandwidth, circuit rental fees, etc., which are key input information for profiling various dedicated line business customers.
2.1.2 Network Information Collection
Network information mainly comes from network management or resource systems, which are used to determine the business access range and network carrying capacity, mainly including the range of comprehensive business access areas, the location of comprehensive business stations, and related equipment’s port and traffic usage information.
2.2 Build Models
The purpose of this step is to analyze the business characteristics of existing customers to output profile information for different types of customers, thereby providing typical reference data for the value ranking and capability demand of all customers. Since network dedicated line services are mainly provided by three domestic telecom operators, the sample size and types can basically cover all typical businesses in the network dedicated line market, making it highly valuable for reference. Customer profiling is a sampling analysis of existing customers, and the content of customer profiles mainly includes four aspects: industry type, value contribution, business bandwidth, and carrying demand.
a) Industry Type. Used to aggregate similar customers, it can be divided according to the type of target customers and the granularity of demand analysis, generally including government, military, finance, large enterprises, and small and medium-sized enterprises.
b) Value Contribution. A quantitative analysis of the business revenue of existing customers, aimed at finding typical revenue reference values for similar types of customers to distinguish the value of different industry type customers.
c) Business Bandwidth. By quantifying the circuit bandwidth of existing customers, typical circuit rates for similar types of customers are identified for bandwidth demand estimation.
d) Carrying Demand. By surveying the isolation degree (physical or logical), latency (whether there are requirements), and availability (whether there are requirements) of circuits from front-end and operational support personnel, the carrying quality of circuits for different industry types is distinguished.
Through customer profiling, typical parameters for value contribution, business bandwidth, and carrying demand across different industry types are ultimately outputted, providing reference data for calculating the heat value of network dedicated line demand.
2.3 Implement Grids
The purpose of this step is to aggregate the location distribution of target customers into existing comprehensive business access areas, mapping all customer demands into corresponding comprehensive business access stations, thereby transforming discrete business demands into quantifiable analysis data for comprehensive business access stations.
The location information of existing customers is mainly obtained from the circuit list exported from the resource system, using the AZ end access station information. By comparing and associating the AZ end access station with the comprehensive business access station through station coding, the mapping of existing customers to comprehensive business access stations is achieved. For the location information of potential opportunities, the corresponding latitude and longitude coordinates are queried based on the collected address information, and then combined with the closed range coordinates of the comprehensive business access area, each customer node is mapped into the corresponding comprehensive business access area using latitude and longitude algorithm tools.
Through the above methods, all customer information can be aggregated into different comprehensive business access areas, achieving the basic data input for government and enterprise heat analysis of each comprehensive business access station.
2.4 Calculate Heat
Heat value calculation is based on each comprehensive business access station as the basic unit, analyzing the corresponding access scale, business flow, value contribution, and carrying demand based on the types of customers accessed, outputting the government and enterprise business heat value for each comprehensive business access station, providing decision-making basis for network construction.
The specific dimensions of heat analysis can also be adjusted according to the actual situation of demand analysis, such as increasing economic development levels, adjusting analysis dimension types, setting dimension weights, etc. This paper conducts government and enterprise business heat analysis based on the dimensions of economic development levels, node scales of different industry type customers, business flow, value contribution, and carrying demand, with a brief calculation shown in formula (1).
Heat Value = ∑[Economic Level + (Customer Scale + Business Flow) × Value Contribution × Carrying Demand]
(1)
Since the data has different dimensional units, the dimensions vary greatly, requiring preprocessing of the data. This paper adopts a normalization data standardization method, linearly scaling the dimensions of economic level, customer scale, and business flow to map into the [0, 1] interval, avoiding excessive or insufficient impact on the results of comprehensive data analysis due to different dimensional units, allowing different dimensional units to have the same measurement scale for easier comparative weighted analysis.
For the basic data of customer scale and business flow, the development forecast of existing customers can be overlaid with potential user demand to estimate the total number of accesses and bandwidth demand for each comprehensive business access station, with the size of the values corresponding to the height of the heat value.
Focusing on the characteristics of business revenue and carrying demand for different types of customers during heat value calculation, high-value customers are prioritized by increasing the adjustment coefficients for value contribution and carrying demand, tilting the heat value calculation results towards high-value customers, enhancing the precision of construction investment and investment efficiency.
Through comprehensive analysis and comparison of the above data, a list of government and enterprise heat values for each comprehensive business access station can be outputted, reflecting the necessity of construction. Combined with the distribution of comprehensive business access areas, business intelligence (Business Intelligence, BI) software can be used to create intuitive graphical displays of government and enterprise heat values in various regions.

03
Application of Heat Value Analysis in Network Construction
The application of heat value analysis in network construction mainly guides network expansion work by benchmarking the basic data of customer scale, business flow, and carrying demand in the heat value analysis of each comprehensive business access station against the coverage, port, and link information of existing network carrying devices. Among them, customer scale corresponds to the coverage and port usage demand of network devices, business flow is used to analyze whether the existing network link bandwidth can meet carrying demands, and carrying demand corresponds to the carrying methods used by different types of customers. For example, high-value customers’ rigid pipeline demands prefer OTN network carrying to enhance business transmission quality; the logical isolation demands of ordinary network dedicated lines can use smart transport networks (Smart Transport Network, STN) or slicing packet networks (Slicing Packet Network, SPN) to reduce business transmission costs. Ultimately, this method will output the network construction demands of different types of customers.
At the same time, combined with the ranking of heat values of each comprehensive business access station and the investment plans and coverage strategies of construction units, this method can guide the overall planning and phased implementation of the network. With data updates, this method can be cyclically used and rolled out, serving both for post-evaluation of network construction and for planning or scheme preparation for the next year.

04
Demonstration of Heat Value Analysis Method Application
Taking the heat analysis of network dedicated lines from a certain operator as an example, this section illustrates the application of heat calculation and analysis methods for reference.
The basic information for this heat value analysis comes from the operator’s service activation system and opportunity system, with customer types divided into four categories: government and military (DZJ), finance (JR), large enterprises (DXQY), and others (QT). By using algorithm tools, the location coordinates of different customers are mapped into the corresponding comprehensive business access areas, aggregating them into the corresponding comprehensive business access stations.
For the dimensional data of heat value calculation, the economic level is analyzed using per capita GDP, the node scale is based on the sum of existing circuits and potential customer distribution, and the business flow is the sum of existing circuit traffic forecasts and typical bandwidth of potential customers. In terms of value contribution, weight coefficients are artificially set based on the revenue of the four customer types, with weights of 1.2, 1.2, 1, and 0.8 for DZJ, JR, DXQY, and QT, respectively. For carrying demand, based on the operator’s network dedicated line carrying strategy, weight coefficients of 1, 1, 1, and 0.8 are set for DZJ, JR, DXQY, and QT (1 for OTN network carrying, 0.8 for packet network carrying), with the purpose of increasing attention to high-value customers to enhance investment efficiency. Additionally, the dimension of local economic development level is introduced to guide construction investment towards high-value areas, improving investment efficiency.
During the heat value calculation process, the economic level, node scale, and business flow are first standardized, mapping the data into a dimensionless interval of [0, 1] to eliminate differences caused by different dimensional units and magnitudes; then weighted calculations are performed to derive the list of government and enterprise heat values for each comprehensive business access station, with the calculation formula as follows.
Heat Value = ∑[Per Capita GDP + (Node Scale + Business Flow) × Value Contribution × Carrying Demand]
(2)
By calculating the heat values of over 1,500 comprehensive business access stations across the province, a detailed list of heat values for all comprehensive business access stations in the province is obtained, with part shown in Table 1.
Table 1: Excerpt of Comprehensive Business Access Station Heat Value List
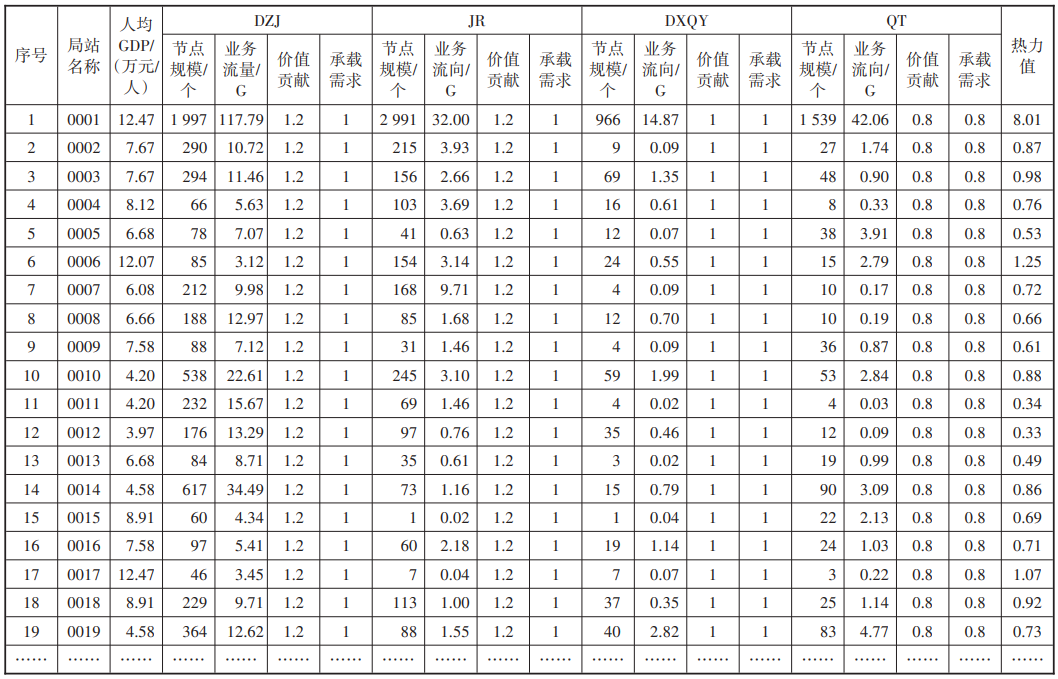
Considering the impact of extreme values on analysis, the distribution interval of the above original heat calculation results is observed, as shown in Figure 1.

Figure 1: Distribution of Original Heat Values for Comprehensive Business Access Stations
In Figure 1, 87% of the heat value samples are distributed in the [0, 1] interval, and the impact of extreme value samples on the overall analysis is minimal. Therefore, the entire sample is linearly amplified. The original heat values above 1 are all high heat areas, setting the heat value to 100, while the remaining original heat values are proportionally amplified, outputting optimized heat values in the [0, 100] interval, with the distribution of each sample shown in Figure 2.
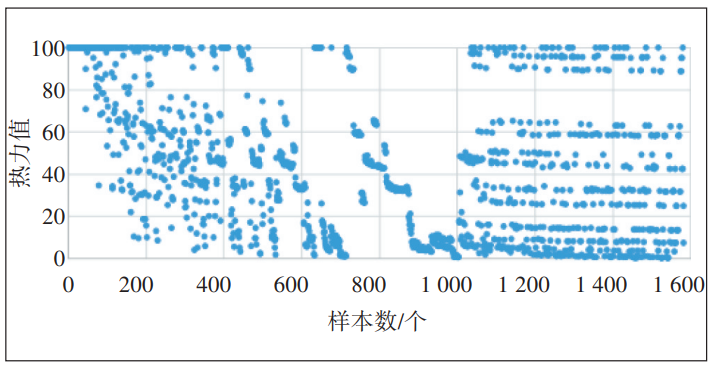
Figure 2: Distribution of Optimized Heat Values for Comprehensive Business Access Stations
By observing Figure 2, it is found that the sample distribution is relatively balanced, making it representative for overall sample analysis. Therefore, based on the principles of optimizing heat values, the optimized detailed list of heat values for all comprehensive business access stations in the province is obtained, with part shown in Table 2.
Table 2: Excerpt of Optimized Heat Value List for Comprehensive Business Access Stations
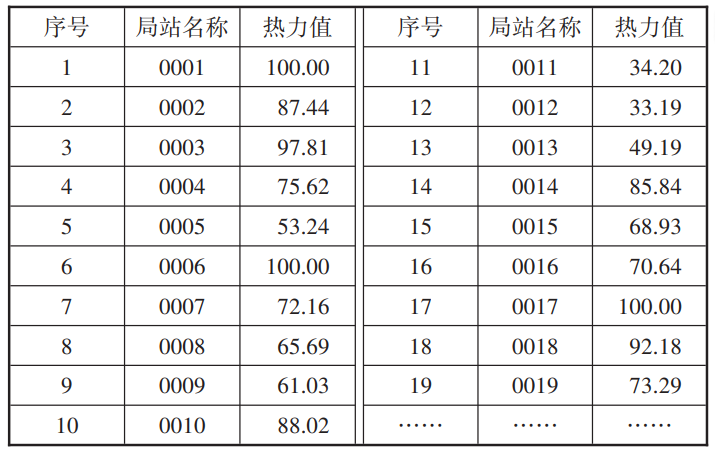
Based on the correspondence between comprehensive business access stations and comprehensive business access areas, using business intelligence (BI) tools, the distribution of government and enterprise heat across the province is visually presented (see Figure 3).

Figure 3: Heat Map of Comprehensive Business Access Areas Across the Province
05
Conclusion
Compared to the traditional demand survey + network capability analysis method, the heat analysis method for network dedicated line business covers demands more accurately and comprehensively, and the business is more efficient. Based on the ranking of heat values in various regions, this method can guide precise investment in construction, promoting healthy development of networks and businesses. The analysis dimensions in the heat analysis method can be set according to actual needs, and the methodology is not limited to the analysis and forecasting of network dedicated line business; by setting different dimensions, it can also be used for other business demand analyses, providing certain reference significance.

References
[1] Ministry of Industry and Information Technology of the People’s Republic of China. Technical Requirements for Enhanced Multi-Service Transport Node (MSTP) Equipment: YD/T 2486-2013[S]. Beijing: People’s Posts and Telecommunications Press, 2013.
[2] Ministry of Industry and Information Technology of the People’s Republic of China. Technical Requirements for Packet-Enhanced Optical Transport Network (OTN) Equipment: YD/T 2484-2021[S]. Beijing: People’s Posts and Telecommunications Press, 2021.
[3] Ministry of Industry and Information Technology of the People’s Republic of China. Technical Requirements for N×100Gbit/s Wavelength Division Multiplexing (WDM) Systems: YD/T 2485-2013[S]. Beijing: People’s Posts and Telecommunications Press, 2013.
[4] Ministry of Industry and Information Technology of the People’s Republic of China. Technical Requirements for Reconfigurable Optical Add-Drop Multiplexer (ROADM) Equipment: YD/T 2003-2018[S]. Beijing: People’s Posts and Telecommunications Press, 2018.
[5] Ministry of Industry and Information Technology of the People’s Republic of China. Technical Requirements for Wavelength Switched Optical Networks (WSON): YD/T 3598-2019[S]. Beijing: People’s Posts and Telecommunications Press, 2019.
Author Biography

Yu Tao, Senior Engineer, mainly engaged in research and planning design of transmission networks.
Recommended Reading
Research and Practice of Millisecond-Level Protection Scheme for Carrier Network Services Based on BFD Protocol
Effectiveness Evaluation of Communication Information Systems Based on AHP-Center of Gravity Judgment Method
Research on End-to-End Low Latency Communication for Industrial Gateways Based on 5G uRLLC
Exploration of Technical Architecture and Application Model of Next-Generation Intelligent Customer Service Platform

Click “Read Original” to download the PDF of the paper


Headline|Postal and Telecommunications Design Technology
Official Website|http://ydsjjs.paperopen.com
Editor|Li Xingchu Reviewer|Jiang Huoming