Real-Time Monitoring of System Resources with Python: Visualizing CPU, Memory, and Disk Usage
Have you ever faced a situation where your computer suddenly lags or applications crash? — Insufficient system resources are one of the most common culprits. As a developer, it is crucial to understand how your programs utilize system resources. However, the information provided by the Windows Task Manager or the Linux top command is quite limited.
Today, we are going to do something different. We will create our own resource monitoring tool using Python, which can also visualize the data! This not only helps you identify resource hogs but also serves as an excellent practice for learning Python system programming.
Environment Setup
First, let’s get our toolbox ready:
-
Python 3.8+ (lower versions might work, but I’m too lazy to test…)
-
psutil 5.9.0+: A Swiss Army knife for obtaining system resource information
-
matplotlib: A visualization library that turns cold numbers into intuitive charts
-
Oh, and some auxiliary functions provided by DeepSeek
Installation is super simple:
Run in Python: pip install psutil matplotlib deepseek
Getting Basic System Information
The psutil library is simply amazing! You can get CPU, memory, and disk information with just a few lines of code:
Run in Python: import psutil
import time
CPU Usage (Percentage)
cpu_percent = psutil.cpu_percent(interval=1)
print(f"CPU Usage: {cpu_percent}%")
Memory Information (in GB)
mem = psutil.virtual_memory()
mem_total = mem.total / (1024**3)
mem_used = mem.used / (1024**3)
print(f"Memory Usage: {mem_used:.2f}GB/{mem_total:.2f}GB")
Disk Usage
disk = psutil.disk_usage('/')
disk_total = disk.total / (1024**3)
disk_used = disk.used / (1024**3)
print(f"Disk Usage: {disk_used:.2f}GB/{disk_total:.2f}GB")
Wait, this is just static data. Shouldn’t monitoring be real-time? That’s right! We need to collect data periodically and record changes.
Real-Time Data Collection and Visualization
Visuals are more intuitive than numbers — this is human nature. Turning data into charts makes trends clear at a glance:
Run in Python: import matplotlib.pyplot as plt
from matplotlib.animation import FuncAnimation
import psutil
import time
from collections import deque
import threading
Storing Historical Data
max_points = 100
times = deque(maxlen=max_points)
cpu_data = deque(maxlen=max_points)
mem_data = deque(maxlen=max_points)
disk_data = deque(maxlen=max_points)
Data Collection Function
def collect_data():
while True:

    # Current timestamp

    times.append(time.time())

    # CPU data

    cpu_data.append(psutil.cpu_percent())

    # Memory data (percentage)

    mem = psutil.virtual_memory()

    mem_data.append(mem.percent)

    # Disk IO (read/write speed MB/s)

    disk_io = psutil.disk_io_counters()

    disk_data.append(disk_io.read_bytes / (1024**2) +

                     disk_io.write_bytes / (1024**2))

    # Pause for 1 second

    time.sleep(1)
Starting the Data Collection Thread
data_thread = threading.Thread(target=collect_data, daemon=True)
data_thread.start()
Creating the Chart
fig, (ax1, ax2, ax3) = plt.subplots(3, 1, figsize=(10, 8))
fig.suptitle('System Resource Monitoring', fontsize=16)
Update Function
def update_plot(frame):
# Clear the chart

ax1.clear()

ax2.clear()

ax3.clear()

# Set titles and labels

ax1.set_ylabel('CPU Usage (%)')

ax2.set_ylabel('Memory Usage (%)')

ax3.set_ylabel('Disk Activity (MB)')

ax3.set_xlabel('Time (seconds)')

# Plot data

if len(times) > 1:

    # Convert time to relative seconds

    relative_times = [t - times[0] for t in times]

    ax1.plot(relative_times, cpu_data, 'r-')

    ax2.plot(relative_times, mem_data, 'g-')

    ax3.plot(relative_times, disk_data, 'b-')

    # Set y-axis range

    ax1.set_ylim(0, 100)

    ax2.set_ylim(0, 100)
return ax1, ax2, ax3
Creating the Animation
ani = FuncAnimation(fig, update_plot, interval=1000, cache_frame_data=False)
Displaying the Chart
plt.tight_layout()
plt.show()
This code creates three subplots that display CPU, memory, and disk activity. We use a thread to continuously collect data while the main thread is responsible for updating the chart — that’s the charm of multithreading!
I really want to see what this script looks like in action… but to describe it in words: three colorful lines change continuously with your operations. Open a browser, and the CPU line spikes; run a large program, and the memory line rises; copy a large file, and the disk line soars!
Making Monitoring Smarter: Powered by DeepSeek
Is just looking at charts not intuitive enough? — Let DeepSeek help us interpret the data and provide optimization suggestions:
Run in Python: from deepseek import Client
Initializing the DeepSeek Client
client = Client(api_key="YOUR_API_KEY")
Analyzing System Resource Data
def analyze_system_data():
# Collect current system status

cpu = psutil.cpu_percent(interval=1)

mem = psutil.virtual_memory().percent

processes = []

# Get TOP 5 resource-consuming processes

for proc in sorted(psutil.process_iter(['pid', 'name', 'cpu_percent', 'memory_percent']),

                  key=lambda p: p.info['cpu_percent'],

                  reverse=True)[:5]:

    processes.append(f"{proc.info['name']}: CPU {proc.info['cpu_percent']}%, MEM {proc.info['memory_percent']:.1f}%")

# Build prompt

prompt = f"""

Analyze the following system resource data and provide optimization suggestions:

- CPU Usage: {cpu}%

- Memory Usage: {mem}%

- Top 5 resource-consuming processes:

{chr(10).join(processes)}

Please provide:

1. System status assessment

2. Possible performance bottlenecks

3. Optimization suggestions

"""

# Get DeepSeek analysis results

response = client.chat.completions.create(

    model="deepseek-chat",

    messages=[{"role": "user", "content": prompt}]
)

return response.choices[0].message.content
Usage Example
analysis = analyze_system_data()
print("\nSystem Analysis Report:")
print(analysis)
This code calls the DeepSeek API, using system data as a prompt to let AI analyze the system status and provide suggestions.
Complete Project: Web Monitoring Dashboard
Want to take it a step further? Integrate all functionalities into a web monitoring dashboard for real-time viewing:
Run in Python: import dash
from dash import dcc, html
from dash.dependencies import Input, Output
import plotly.graph_objs as go
import psutil
import time
from collections import deque
Initializing Data Storage
max_points = 100
times = deque(maxlen=max_points)
cpu_data = deque(maxlen=max_points)
mem_data = deque(maxlen=max_points)
disk_data = deque(maxlen=max_points)
Getting Initial Time
start_time = time.time()
Initializing Dash Application
app = dash.Dash(name, title=”System Resource Monitoring”)
Creating Layout
app.layout = html.Div([
html.H1("Real-Time System Resource Monitoring", style={"textAlign": "center"}),

# Chart update interval

dcc.Interval(id="interval", interval=1000, n_intervals=0),

# System resource chart

dcc.Graph(id="live-graph"),

# Main process table

html.Div(id="process-table")
])
Callback Function to Update Chart
@app.callback(
Output("live-graph", "figure"),

Input("interval", "n_intervals")
)
def update_graph(n):

# Get current data

times.append(time.time() - start_time)

cpu_data.append(psutil.cpu_percent())

mem_data.append(psutil.virtual_memory().percent)

disk = psutil.disk_usage('/').percent

disk_data.append(disk)

# Create chart

fig = go.Figure()

fig.add_trace(go.Scatter(

    x=list(times), y=list(cpu_data),

    name="CPU",

    line=dict(color="red", width=2)
))

fig.add_trace(go.Scatter(

    x=list(times), y=list(mem_data),

    name="Memory",

    line=dict(color="green", width=2)
))

fig.add_trace(go.Scatter(

    x=list(times), y=list(disk_data),

    name="Disk",

    line=dict(color="blue", width=2)
))

# Update layout

fig.update_layout(

    title="System Resource Usage (%)",

    xaxis=dict(title="Time (seconds)"),

    yaxis=dict(title="Usage (%)", range=[0, 100]),

    legend=dict(orientation="h", yanchor="bottom", y=1.02, xanchor="right", x=1),

    margin=dict(l=20, r=20, t=40, b=20),

    height=500
)

return fig
Callback Function to Update Process Table
@app.callback(
Output("process-table", "children"),

Input("interval", "n_intervals")
)
def update_processes(n):
# Get process data

processes = []

for proc in sorted(

    psutil.process_iter(['pid', 'name', 'cpu_percent', 'memory_percent']),

    key=lambda p: p.info['cpu_percent'] + p.info['memory_percent'],

    reverse=True
)[:10]:  # Only show top 10 processes

    processes.append(

        html.Tr([

            html.Td(proc.info['pid']),

            html.Td(proc.info['name']),

            html.Td(f"{proc.info['cpu_percent']:.1f}%"),

            html.Td(f"{proc.info['memory_percent']:.1f}%")

        ])

    )

# Create table

table = html.Table(

    [html.Thead(html.Tr([

        html.Th("PID"), html.Th("Process Name"),

        html.Th("CPU Usage"), html.Th("Memory Usage")

    ]))] + [html.Tbody(processes)],

    style={"width": "100%", "textAlign": "center"}
)

return html.Div([

    html.H3("Top 10 Resource-Consuming Processes"),

    table
])
Running the Application
if __name__ == “__main__”:
app.run_server(debug=True)
This Dash application provides a real-time refreshing web interface that not only displays resource usage trend charts but also lists the most resource-consuming processes — ensuring you can easily identify the system’s “gluttons”!
A Bit of Experience and Reflection
System monitoring may seem simple, but doing it well is an art. Here are a few suggestions:
-
The essence of monitoring is to identify problems, not to be overwhelmed by data. — Choose key metrics and ignore the noise.
-
Sampling frequency needs to be balanced: too high consumes resources, too low misses peaks. Generally, 1-5 seconds is sufficient.
-
For long-term monitoring, consider data storage and compression; don’t let the monitoring tool become a resource hog.
-
Some system calls on Windows may require administrator privileges, while Linux is more user-friendly.
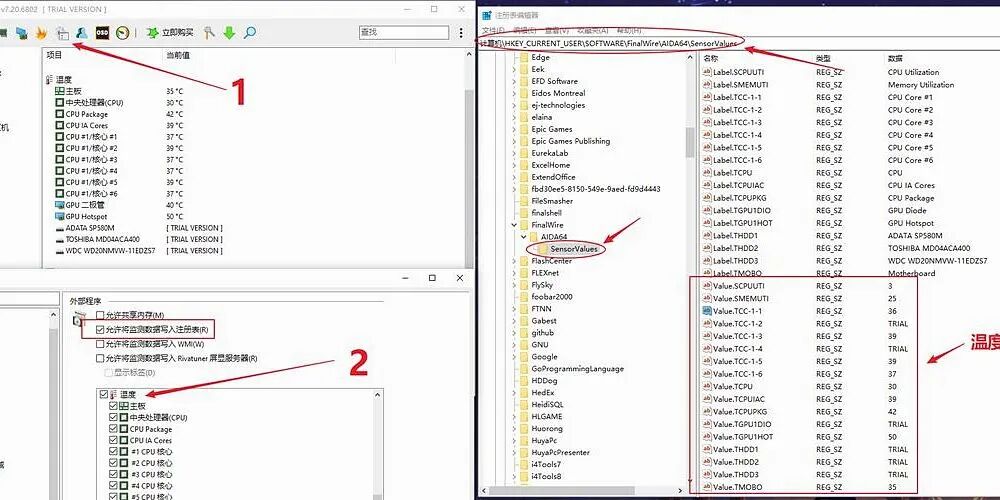
This project can be expanded: add network monitoring, GPU status, temperature monitoring, alert mechanisms… the possibilities are endless!
I really wish I had known this method ten years ago. Back then, troubleshooting system issues relied on brute force and luck; now, with this set of tools, problems have nowhere to hide.
Final Words
Monitoring system resources is not a high-level technology, but it is indeed a practical skill. Whether you are a developer, an operations personnel, or an ordinary user, understanding your system’s status is very valuable. The combination of Python and DeepSeek makes this process simple and enjoyable.
Have you discovered any interesting system behaviors using this tool? Or what other metrics would you like to monitor? Let me know in the comments! If you have cooler Python monitoring solutions, feel free to share them — let’s learn and improve together!