

Python – Plateau Vortex or Typhoon
Movement Path Diagram
–Complete code at the end
Author: Eighth Galaxy – Xin Meier~
Contact Email: [email protected]
Import Library Functions
importnumpy as np
import cartopy
import cartopy.crs as ccrs
import cartopy.feature as cfeature
from cartopy.io.shapereader import Reader
import cartopy.feature as cfeature
from cartopy.mpl.ticker import LongitudeFormatter, LatitudeFormatter
from cartopy.io.shapereader import Reader
import cartopy.crs as ccrs
import cartopy.feature as cfeature
import matplotlib.pyplot as plt
import cartopy.mpl.ticker as cticker
import cartopy.io.shapereader as shpreader
Define Background for Path Diagram
def contour_map(fig,img_extent,spec): fig.set_extent(img_extent,crs=ccrs.PlateCarree()) fig.add_feature(cfeature.COASTLINE.with_scale(’50m’))# Add coastline fig.add_feature(cfeature.LAKES,alpha=0.5)# Add lakes and adjust transparency
#fig.add_feature(cfeature.LAND) fig.set_xticks(np.arange(leftlon,rightlon+spec,spec),crs=ccrs.PlateCarree())# Set X-axis ticks and intervals fig.set_yticks(np.arange(lowerlat,upperlat+spec,spec),crs=ccrs.PlateCarree())# Set Y-axis ticks and intervals lon_formatter=cticker.LongitudeFormatter() lat_formatter=cticker.LatitudeFormatter() fig.xaxis.set_major_formatter(lon_formatter)
fig.yaxis.set_major_formatter(lat_formatter)
Read Qinghai-Tibet Plateau SHP File
reader = cartopy.io.shapereader.Reader(‘D:\PAPER\date\qingzhangshp\qingzang.shp’)# Read file
# Input the latitude and longitude of the plateau vortex (for large datasets, it is recommended to read directly from the file)
x=np.array([89.05,96.47,99.89,100.08,102.05,105.01,107.49,108.66,110.91,111.46,113.93,114.00,120.00,121.97,122.02,122.97,123.49,124.05,122.99])
y=np.array([36.02,34.99,34.98,34.56,35.00,34.99,35.02,36.66,35.56,36.42,36.00,35.90,36.00,37.00,38.00,39.00,40.00,42.00,42.99])
Create Canvas
fig=plt.figure(figsize=(20,18))
proj=ccrs.PlateCarree(central_longitude=90)# Determine the central longitude of the canvas
leftlon,rightlon,lowerlat,upperlat=(70,140,0,45)# Determine the longitude and latitude range of the canvas
img_extent=[leftlon,rightlon,lowerlat,upperlat]
ax=fig.add_axes([0.1,0.1,0.4,0.3],projection=proj)
contour_map(ax,img_extent,10)
Mark the Range of the Qinghai-Tibet Plateau
provinces = cartopy.feature.ShapelyFeature(reader.geometries(),crs=ccrs.PlateCarree(),edgecolor=’k’,facecolor=’w’,alpha=0.4)# Adjust boundary color, fill color, and transparency
ax.add_feature(provinces, linewidth=0.9, zorder=2)# Adjust line width
ax.plot(x1,y1,linewidth=2,transform=ccrs.PlateCarree())# Draw the trajectory line of the plateau vortex
ax.scatter(x1,y1,transform=ccrs.PlateCarree())# Plot the positions of the plateau vortex at different times
plt.savefig(‘road2.png’,dpi=500)# Set image save location, format, and precision
plt.show()
Trajectory Diagram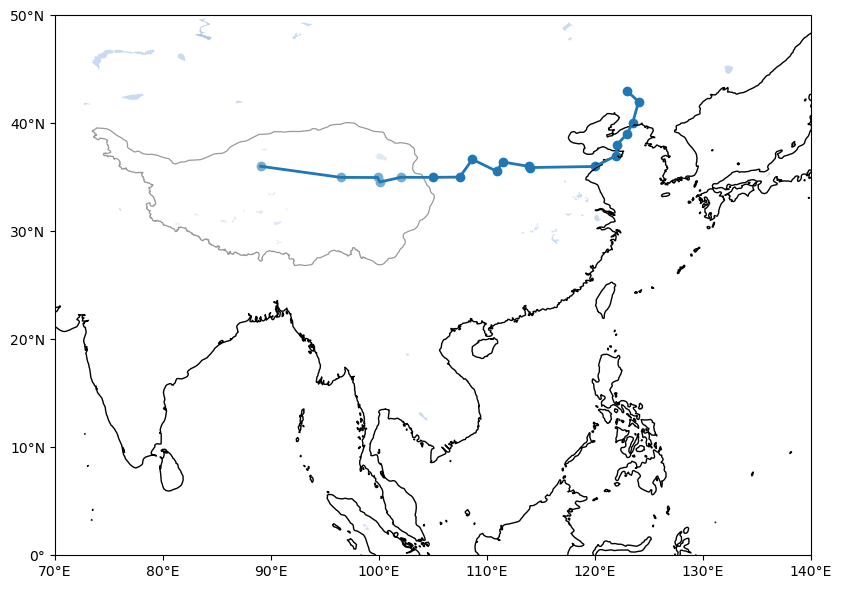


Scan to join the group!
# Trajectory Diagram
# Import Library Functions
import numpy as np
import cartopy
import cartopy.crs as ccrs
import cartopy.feature as cfeature
from cartopy.io.shapereader import Reader
import cartopy.feature as cfeature
from cartopy.mpl.ticker import LongitudeFormatter, LatitudeFormatter
from cartopy.io.shapereader import Reader
import cartopy.crs as ccrs
import cartopy.feature as cfeature
import matplotlib.pyplot as plt
import cartopy.mpl.ticker as cticker
import cartopy.io.shapereader as shpreader

def contour_map(fig,img_extent,spec):
    fig.set_extent(img_extent,crs=ccrs.PlateCarree())
    fig.add_feature(cfeature.COASTLINE.with_scale('50m'))# Add coastline
    fig.add_feature(cfeature.LAKES,alpha=0.5)# Add lakes and adjust transparency
    #fig.add_feature(cfeature.LAND)

    fig.set_xticks(np.arange(leftlon,rightlon+spec,spec),crs=ccrs.PlateCarree())# Set X-axis ticks and intervals
    fig.set_yticks(np.arange(lowerlat,upperlat+spec,spec),crs=ccrs.PlateCarree())# Set Y-axis ticks and intervals
    lon_formatter=cticker.LongitudeFormatter()
    lat_formatter=cticker.LatitudeFormatter()
    fig.xaxis.set_major_formatter(lon_formatter)
    fig.yaxis.set_major_formatter(lat_formatter)

# Read Qinghai-Tibet Plateau SHP file
reader = cartopy.io.shapereader.Reader('D:\PAPER\date\qingzhangshp\qingzang.shp')# Read file
# Input the latitude and longitude of the plateau vortex (for large datasets, it is recommended to read directly from the file)
x=np.array([89.05,96.47,99.89,100.08,102.05,105.01,107.49,108.66,110.91,111.46,113.93,114.00,120.00,121.97,122.02,122.97,123.49,124.05,122.99])
y=np.array([36.02,34.99,34.98,34.56,35.00,34.99,35.02,36.66,35.56,36.42,36.00,35.90,36.00,37.00,38.00,39.00,40.00,42.00,42.99])


# Create Canvas
fig=plt.figure(figsize=(20,18))
proj=ccrs.PlateCarree(central_longitude=90)# Determine the central longitude of the canvas
leftlon,rightlon,lowerlat,upperlat=(70,140,0,45)# Determine the longitude and latitude range of the canvas
img_extent=[leftlon,rightlon,lowerlat,upperlat]
ax=fig.add_axes([0.1,0.1,0.4,0.3],projection=proj)
contour_map(ax,img_extent,10)


# Mark the Range of the Qinghai-Tibet Plateau
provinces = cartopy.feature.ShapelyFeature(reader.geometries(),crs=ccrs.PlateCarree(),edgecolor='k',facecolor='w',alpha=0.4)# Adjust boundary color, fill color, and transparency
ax.add_feature(provinces, linewidth=0.9, zorder=2)# Adjust line width
ax.plot(x1,y1,linewidth=2,transform=ccrs.PlateCarree())# Draw the trajectory line of the plateau vortex
ax.scatter(x1,y1,transform=ccrs.PlateCarree())# Plot the positions of the plateau vortex at different times

plt.savefig('road2.png',dpi=500)# Set image save location, format, and precision
plt.show()
Editor: myp