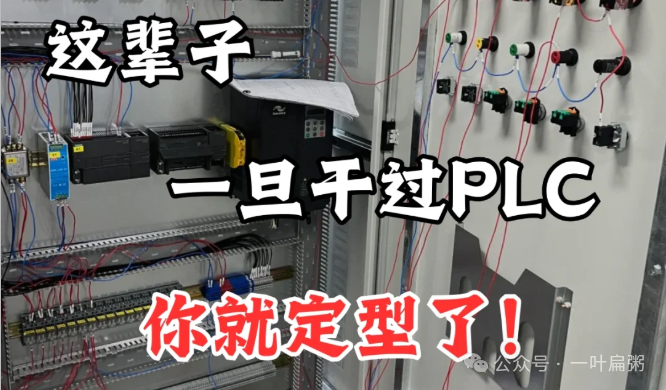
PLC Hardware Monitoring: Online Monitoring Module Configuration for Real-Time Parameter Management!
Introduction
Hello everyone! Today, I want to share a technology that will help PLC maintenance engineers sleep better—online hardware monitoring! [Red Code]Imagine being able to detect potential issues before the device alarms, just like giving your PLC a “health bracelet”! [Blue Code] By keeping track of key parameters in real-time, we can eliminate 80% of failures at their inception. Want to know how? Let’s explore together!
What is PLC Hardware Online Monitoring?
Let’s start with a real-life analogy: traditional PLC maintenance is like a regular health check-up, while online monitoring is like a 24-hour wearable health monitor.
-
Fixed Checks: Previously, you had to stop the machine and connect a programmer to check the module status.
-
Online Monitoring: Now, you can see in real-time through HMI or SCADA:
✅ Module operating temperature
✅ Input/output voltage fluctuations
✅ Communication response time
✅ Memory usage rate
[Red Code]“Last week, thanks to this feature, we detected a bulging capacitor in a power module ahead of time, avoiding an 8-hour downtime on a production line!”—Wang, a maintenance team leader at an automotive factory, said [Blue Code]
Why Monitor in Real-Time?
Three core values that you cannot refuse:
-
Fault Warning (Predictive Maintenance)
-
Capturing the gradual decline trend of the power module voltage
-
Identifying abnormal increases in CRC error counts for communication modules
-
-
Configuration Management
-
Remotely verifying that the IO module’s hardware configuration matches the actual setup
-
Monitoring the online hot standby status of spare modules
-
-
Performance Optimization
-
Identifying program optimization points through scanning cycle fluctuations
-
Adjusting data block allocation based on memory usage rates
-
[Blue Code]Case study from a food factory: Monitoring revealed that voltage fluctuations at night caused the CPU to restart frequently; after adding a voltage stabilizer, the failure rate dropped to zero! [Red Code]
Monitoring Solutions for Mainstream PLCs
1. Siemens TIA Portal Solution
-
Hardware Diagnostic View: Intuitive like a car dashboard
-
Web Server Functionality: Key parameters can be viewed on mobile devices
-
Key Monitoring Items:
- OB block execution time (red alarm threshold can be set)
- PROFINET communication load rate
- Digital mapping of module LED status
2. Rockwell Studio 5000 Solution
-
Module Health Scoring system
-
Trend Graph Functionality: Can trace back 72 hours of data
-
Especially Useful Feature:
[Red Code]“When the rack temperature exceeds 55°C, automatically reduce the scan frequency to protect the hardware”[Blue Code]
3. Mitsubishi MELSOFT Solution
-
Module Life Prediction (based on operating hours + environmental parameters)
-
Smart Reminders:
“FB block memory usage exceeds 90% for three consecutive scans; consider optimizing program structure”
Practical Tips Revealed
▶ Five Golden Parameters You Must Monitor
-
CPU Load Rate (sustained >70% requires warning)
-
Backplane Bus Communication Error Count
-
Power Module Ripple Coefficient
-
Jitter Frequency of Digital Input Points
-
Zero Drift Value of Analog Channels
▶ Alarm Strategy Settings
Example of a Three-Level Warning Mechanism:
| Level | Condition | Response Time |
|——|——|———-|
| Notice | Temperature >60°C | Check within 24 hours |
| Warning | Memory leak >5%/day | Address within 8 hours |
| Emergency | Communication interruption >30 seconds | Immediate response |
[Blue Code]“Setting reasonable thresholds is more important than monitoring itself!”—Li, an instrumentation director at a petrochemical company, reminds [Red Code]
Avoiding Pitfalls Guide
⚠️ Three Common Mistakes Made by Beginners:
-
Too many monitoring points leading to system overload (suggest <50 key parameters)
-
Setting alarm thresholds without establishing baseline data
-
Ignoring the impact of environmental temperature on monitoring data
[Red Code]“We once had a mishap because the monitoring program itself consumed 15% CPU load!”—Zhang from a packaging machinery factory learned this lesson [Blue Code]
Quick Start Roadmap
-
Step One: Enable the PLC’s built-in diagnostic buffer
-
Step Two: Configure the HMI alarm view (recommended to use color to differentiate levels)
-
Step Three: Establish a historical database (recommended lightweight solution: SQLite)
-
Advanced: Develop automatic push notification features via WeChat/email
Interactive Questions
-
What methods are you currently using to monitor PLC hardware status?
-
What failures have you encountered due to inadequate monitoring?
-
Which parameter do you most wish to automate monitoring for?
Conclusion
Online monitoring is not a luxury, but a necessity for modern PLC systems! Starting today, say goodbye to “fire-fighting maintenance” and embrace the new era of predictive maintenance. Remember: [Red Code]“The risks you cannot see are the greatest risks”[Blue Code].
[Blue Code]Feel free to share your hardware monitoring tips in the comments; if we get over 100 likes, I will share “How to Create a PLC Monitoring Dashboard with Python” next week![Red Code]
ShareSaveViewLike