This article is selected from the Extreme Technology Community column “Bare Metal Thinking”. The article mainly shares free tools related to “performance/time” for super embedded systems open-sourced on GitHub.

Is it really free from the start?
For the well-known Cortex-M processors, whether it is the Cortex-M0 emphasizing extreme resources and low power consumption or the Cortex-M7 with frequencies exceeding GHz that can compete with certain application processors, the presence of SysTick is undeniable.
SysTick is regarded as the “essential” infrastructure officially designated, and almost all embedded firmware will use it, whether in RTOS systems or bare-metal applications. In this context, if I tell you that there is a C language-based module that provides the following functions:
● Accurate measurement of system performance
● Accurate measurement of function execution time
● Accurate measurement of interrupt response latency
● Provides blocking or non-blocking delay services with microsecond precision
● Improves the random characteristics of pseudo-random numbers
● Provides system timestamps
● …
Uses SysTick but does not occupy SysTick;
In other words, while providing the above functions, the user’s existing SysTick applications (such as RTOS schedulers or ordinary application delays) will not be affected at all;
To put it bluntly: the above functions are free, and every Cortex-M processor can immediately enjoy them without being affected by the chip model,
Wouldn’t you want to exclaim: “Is it really free?”
Yes! As an open-source C language module on GitHub, it is indeed free!
Open your mouth… ah~
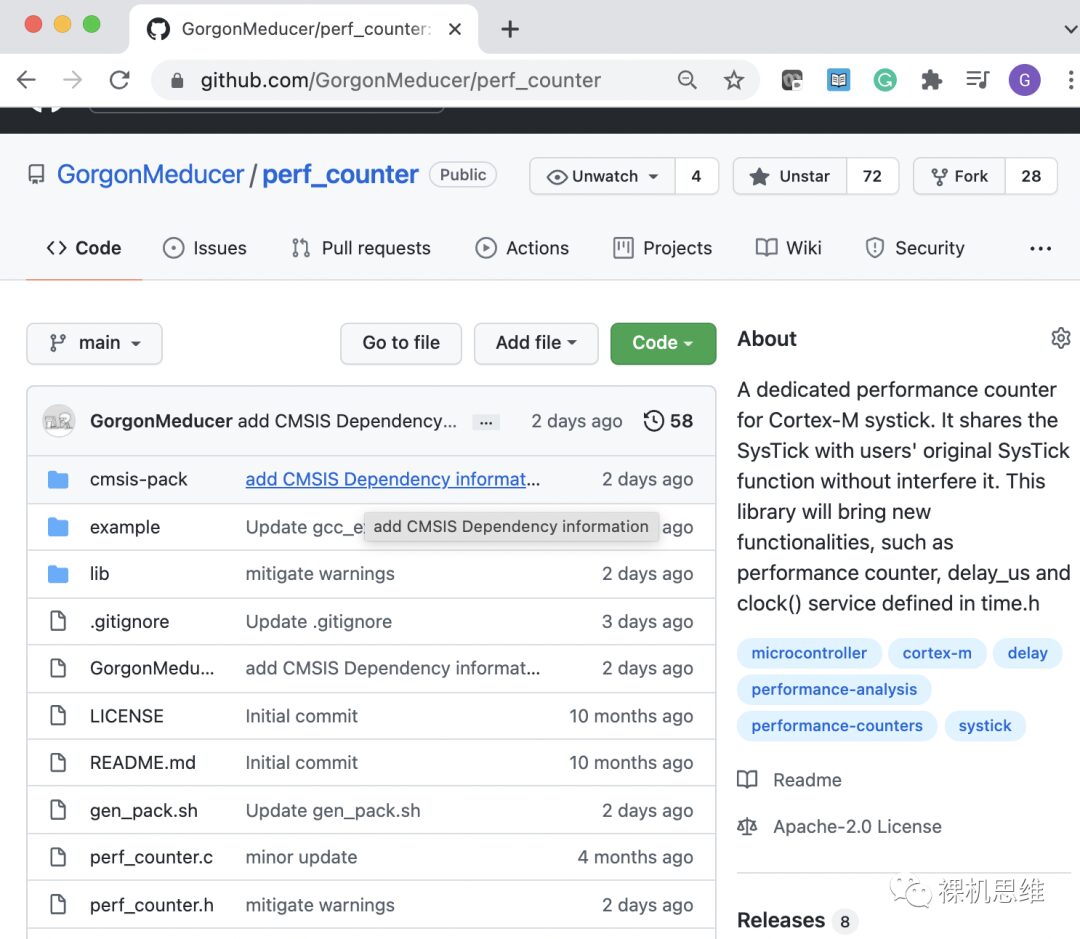
The perf_counter version has evolved continuously, from adding support for GCC and IAR, to simplifying user deployment through the Library. Starting from version 1.6.1, the deployment of the module has been simplified to the extreme: this time, you only need to download the CMSIS-Pack from the link below in one go to achieve foolproof deployment in the MDK environment:
https://raw.githubusercontent.com/GorgonMeducer/perf_counter/CMSIS-Pack/cmsis-pack/GorgonMeducer.perf_counter.1.6.3.pack
You can also click on “Read Original” at the end of the article to download.
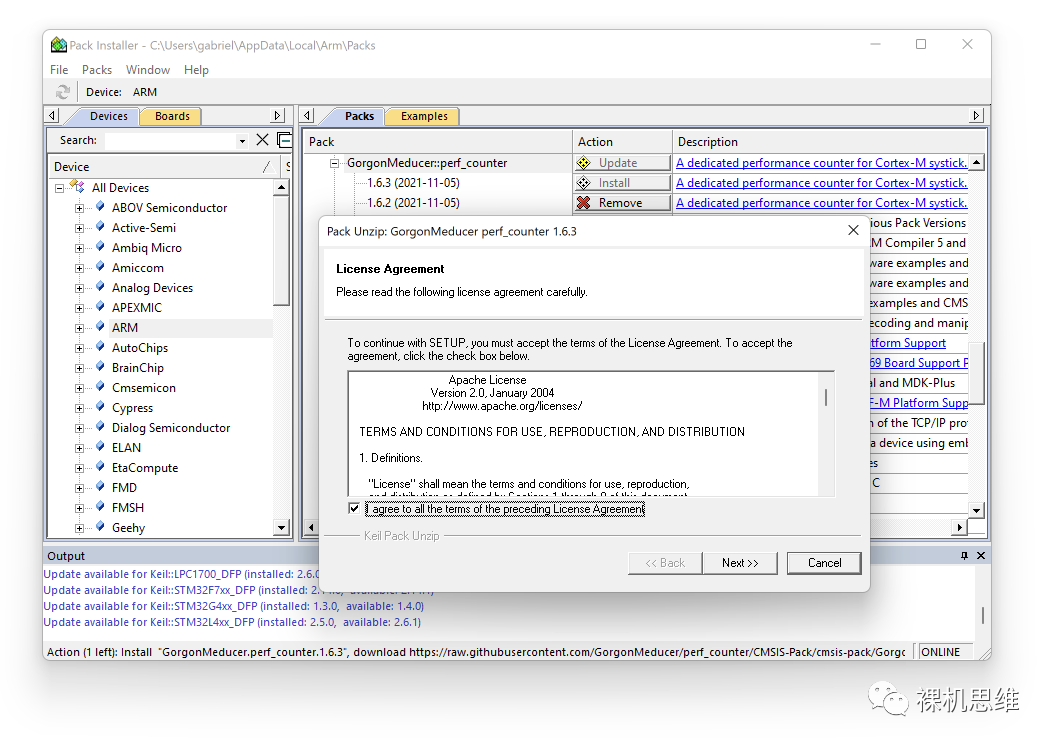
After downloading, double-click the pack file for installation:
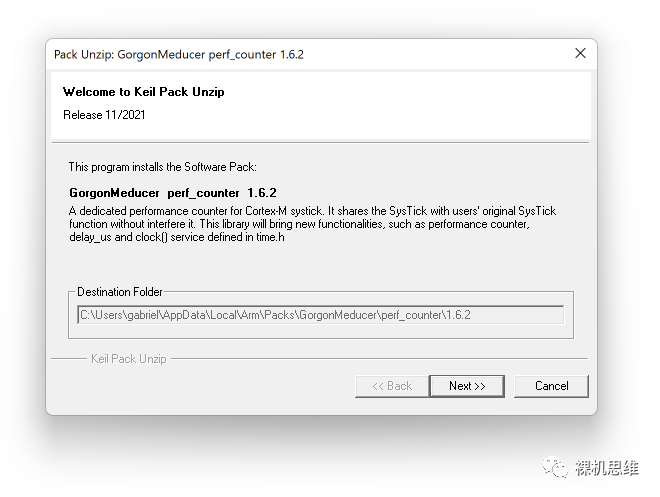
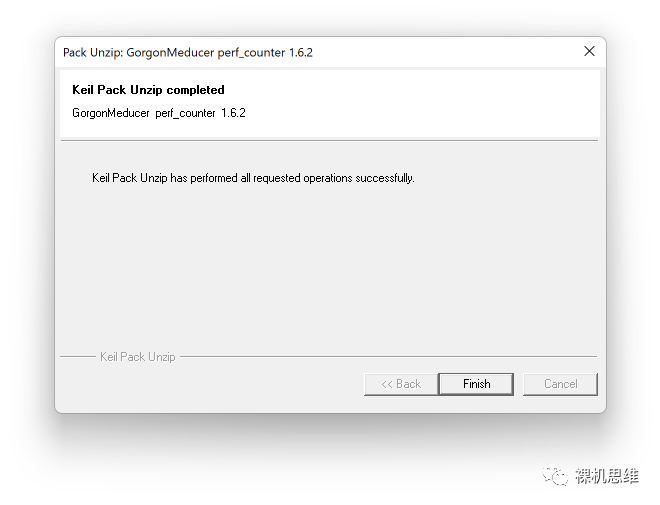
After confirming the terms of the open-source license Apache 2.0, just keep hitting Next until you click Finish to complete the entire installation process:
Generally speaking, the deployment will be very smooth, but if there is an installation error, such as the one below:
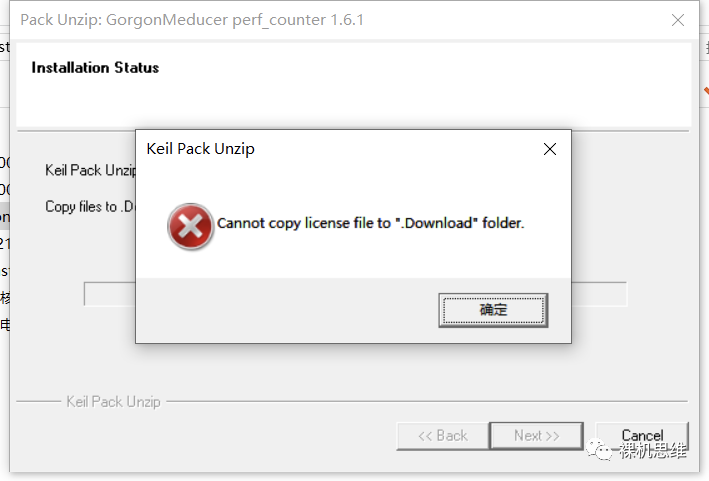
It is likely that the MDK version you are using is too low—it’s time to update MDK. Identify the mini-program below to obtain the latest MDK cloud disk link.

When we want to deploy perf_counter in any existing project, we just need to click the icon shown below on the MDK toolbar:

Open the RTE configuration window:
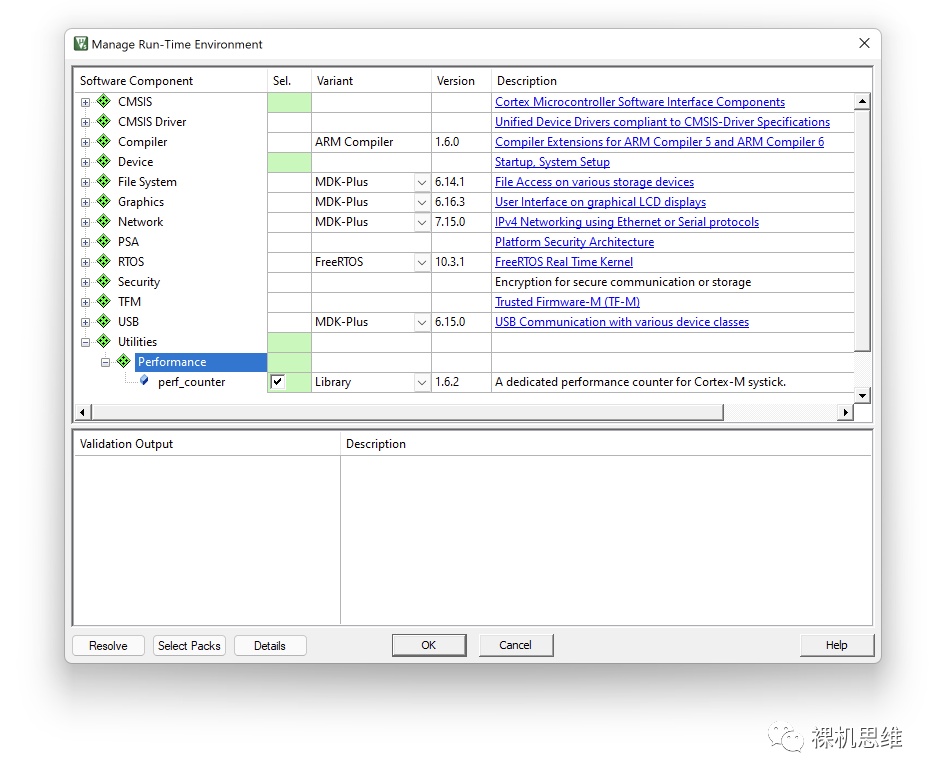
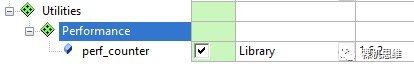
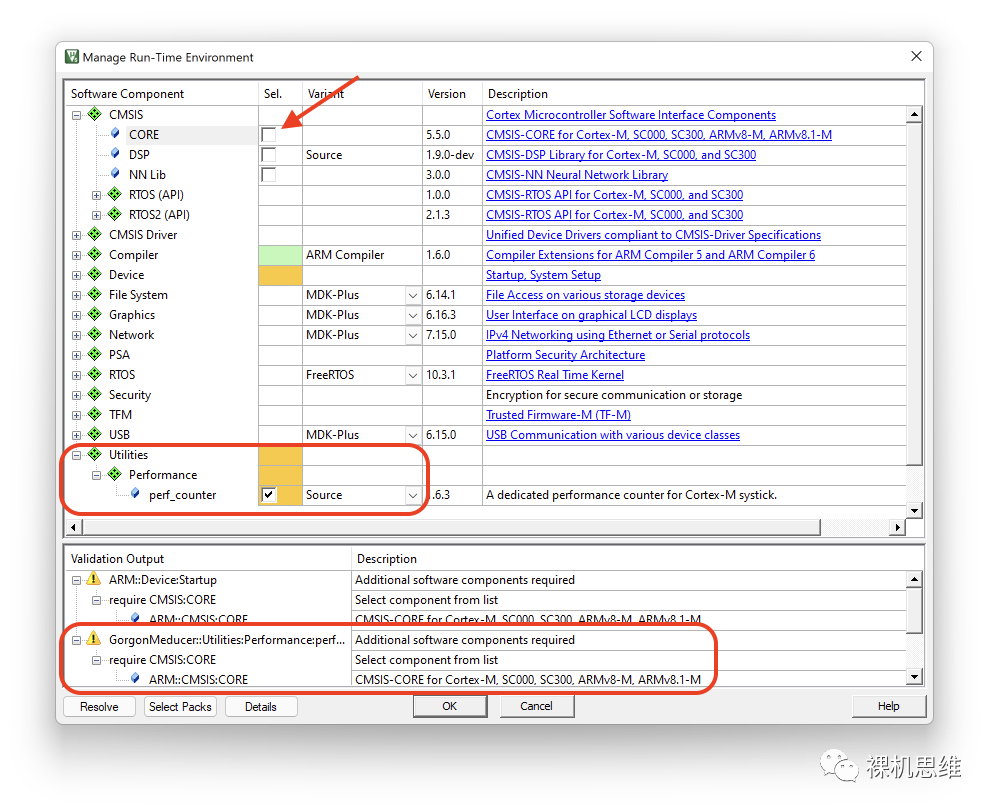
We will notice that at the end of the list, there is an entry for Utilities. After expanding it, check perf_counter under Performance—by default, the system will automatically choose to implement the module deployment in the form of a library—This is the way I strongly recommend because it saves unnecessary compilation trouble.
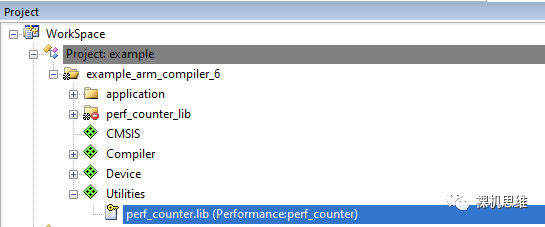
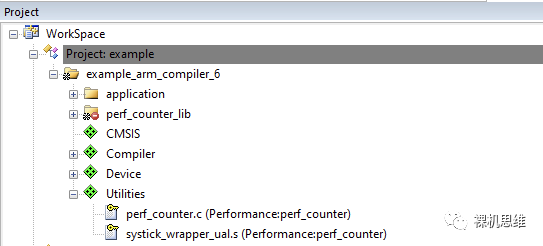
After clicking the OK button, we will find that Utilities has been added to the project manager, and perf_counter.lib has also been successfully deployed to the target project:
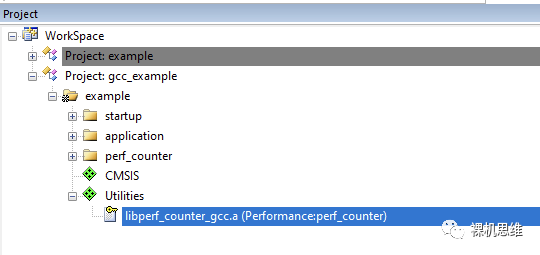
Friends who have read my previous article “[Tutorial] How to Use GCC with Zero Assembly to Get MDK for Free” must know that MDK can also use GCC as the compiler. perf_counter has also taken this into account—when the user actually uses GCC, the corresponding libperf_counter_gcc.a (instead of perf_counter.lib under Arm compiler 5 or Arm compiler 6) will be added to the project.
Using perf_counter in a GCC environment has some considerations. Since there has been a very detailed introduction at the end of the article “[Tutorial] How to Use GCC with Zero Assembly to Get MDK for Free”, I will not elaborate here.
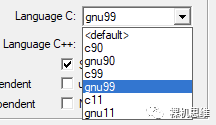
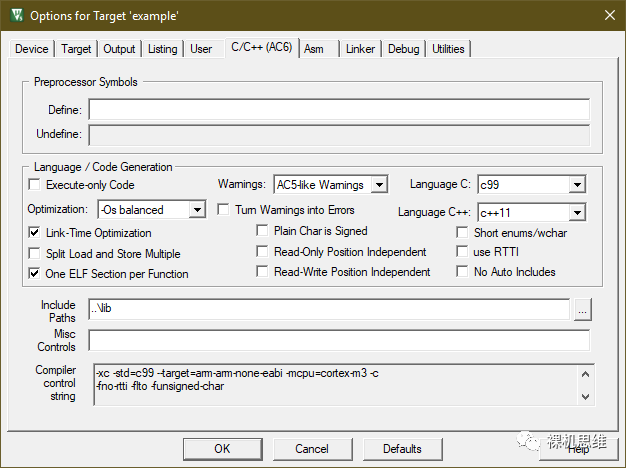
When we use Arm Compiler 6 as the compiler in the MDK environment, we need to enable support for GNU extensions and C99 (and above) language standards. The specific method is shown in the figure below: In the Language C standard dropdown list, choose the option with the gnu prefix—unless there are special concerns, it is recommended to set it to the maximum—using gnu11 is sufficient.
If you are using an older Arm Compiler 5, you should check both C99 Mode and GNU extensions. Friends who cannot find the above two options should seriously consider upgrading their MDK version.

One-click end to the sweet and salty debate?
Although in RTE, perf_counter recommends and defaults to using the library method for deployment,
Considering that there are always friends who have an inexplicable fear of black boxes:
“…often need to see the yellow wine scooped out of the jar, check if there is water at the bottom of the pot, and then see the pot placed in hot water before feeling at ease…”
https://zh.m.wikisource.org/zh/%E5%AD%94%E4%B9%99%E5%B7%B1

(Image from the internet, infringement will be deleted)
Therefore, perf_counter thoughtfully provides a way to deploy using source code:

At this time, the relevant perf_counter.c and systick_wrapper_ual.s will replace the original library files in the compilation:
Of course, compiling using the Source method also has its costs, as the source code of perf_counter depends on CMSIS—if you have not checked CMSIS-CORE in the RTE configuration interface, you will see a warning message like the one below: “Additional software components required“.
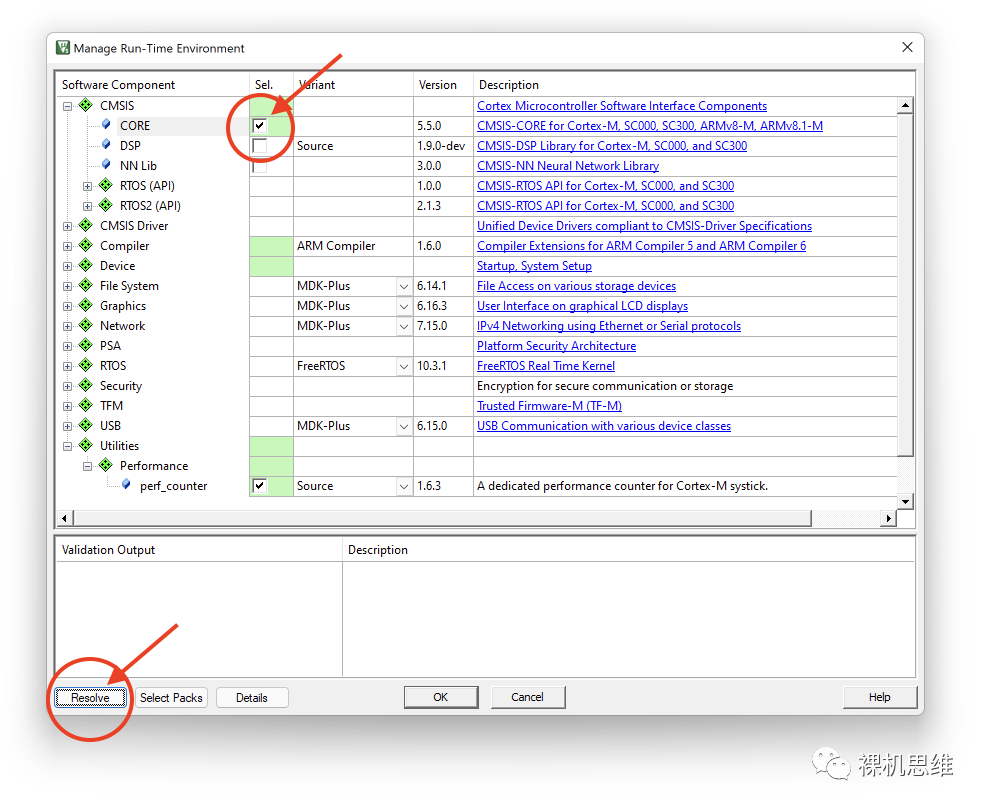
At this time, you can simply click the Resolve button to solve the problem—you will find that the so-called solution is just RTE automatically checking CMSIS-CORE required by the Source mode for you:
If you have no objections to this, the problem is perfectly solved; if your system has other versions of CMSIS (for example, many projects generated by Keil, Wildfire, and CubeMX may carry CMSIS that is not managed through the RTE configuration interface), there is a high possibility of CMSIS version conflicts—and the solution to conflicts is slightly more complicated—you can refer to my article “The Guide to the ‘Underworld Achievements’ of CMSIS Players” to achieve some trade-offs… or…
It is still recommended that you continue to use the Library mode, as it has no dependencies on CMSIS.
One-click update of… embedded software modules?
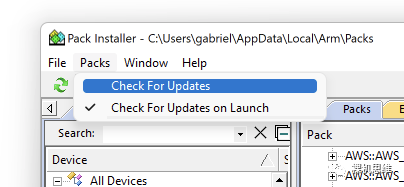
Once you install any version of the perf_counter pack, it will leave traces in the MDK pack-installer:
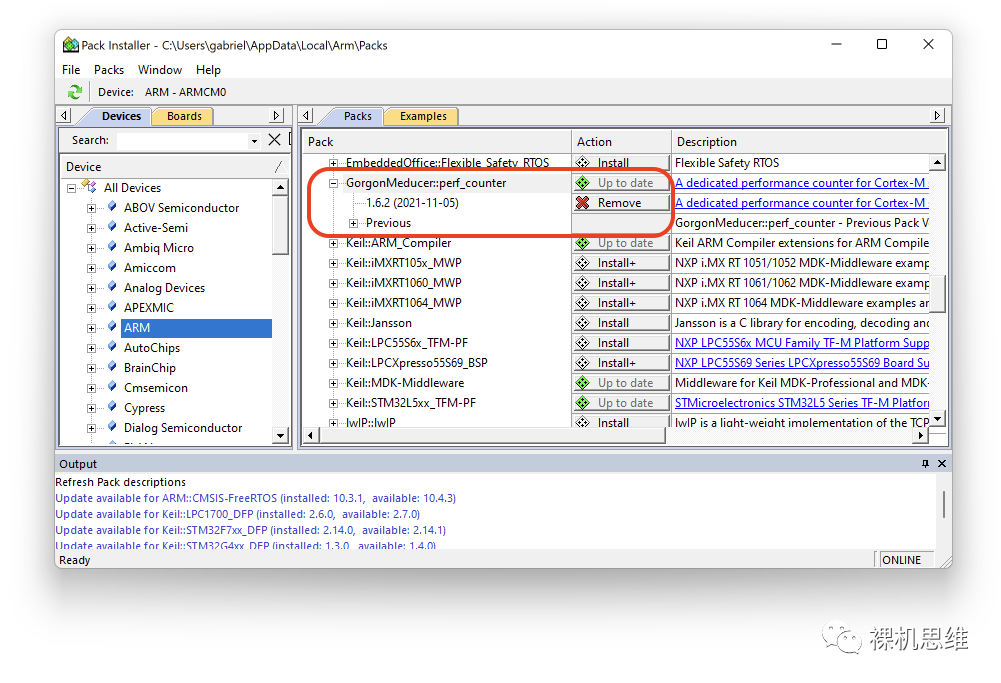
At this time, just by going to the menu Pack->Check For Update, we can check in real-time whether perf_counter has a new version:
If Pack-Installer really finds an update from GitHub, it will notify us with a yellow Update icon:
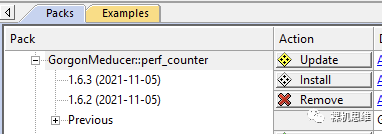
At this point, click the Update button to install the latest version:
So, how can we encourage the blogger to update more and add more and better features?
Of course, it relies on capable friends who can scientifically surf the internet to star more!
https://github.com/GorgonMeducer/perf_counter.git
Library Initialization and Precautions
About Header Files
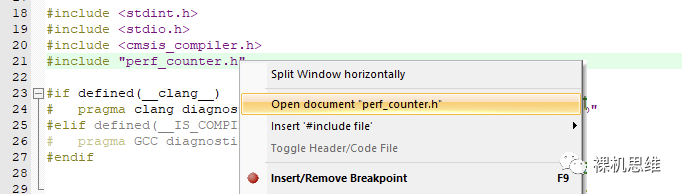
In any C language source file that needs to use perf_counter, we need to first include the header file:
#include "perf_counter.h"It should be noted that the perf_counter deployed by RTE will not introduce perf_counter.h in the project manager for users to view. Friends who want to view perf_counter.h to find available APIs can simply right-click on the above code line and select “Open document ‘perf_counter'” to access the header file.
About Library Initialization
Generally, users will configure the CPU working frequency at some point, such as in the main() function, and we should ensure that the global variable SystemCoreClock is correctly updated after completing this task—saving the current CPU working frequency, for example:
extern uint32_t SystemCoreClock;void main(void){ system_clock_update(); //! Update CPU working frequency SystemCoreClock = 72000000ul //! Assume the updated system frequency is 72MHz ...}Generally, if your chip project is based on a newer CMSIS framework, your startup file has already defined the global variable SystemCoreClock for you—of course, there are exceptions. If you report that the variable SystemCoreClock cannot be found during compilation or say “Undefined symbol__SystemCoreClock” or similar, you can define it yourself, for example:
uint32_t SystemCoreClock;void main(void){ system_clock_update(); //! Update CPU working frequency SystemCoreClock = 72000000ul //! Assume the updated system frequency is 72MHz ...}After this, we need to initialize the perf_counter library. There are two situations:
1. The user’s application does not use SysTick at all. In this case, during compilation, we will mostly see an error message like the one below:
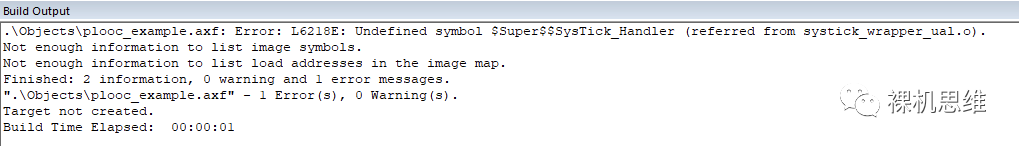
Error: L6218E: Undefined symbol $Super$$SysTick_Handler (referred from systick_wrapper_ual.o).For this situation, we need to add a SysTick interrupt handler in any C file:
#include "perf_counter.h"...
__attribute__((used))    //!< Avoid the following handler from being optimized awayvoid SysTick_Handler(void){
}
Then we initialize the perf_counter service in the main() function:
#include <stdbool.h>...
void main(void){    system_clock_update();       //! Update CPU working frequency    SystemCoreClock = 72000000ul //! Assume the updated system frequency is 72MHz    init_cycle_counter(false);    ...}
It should be noted that: since the user has not initialized SysTick themselves, we need to inform the perf_counter library of this situation—let it complete the initialization of SysTick—passing false to the function init_cycle_counter() is this function. If the perf_counter library initializes SysTick itself, it will set the overflow value (LOAD register) of SysTick to the maximum (0x00FFFFFF) for more reliable functionality.
2. In the user’s application, SysTick is used, and there is its own initialization process. In this case, we need to ensure one thing: whether the BIT2 of the SysTick’s CTRL register (SysTick_CTRL_CLKSOURCE_Msk) is set—if its value is 1, it indicates that SysTick uses the same working frequency as the CPU, then the measurement result of SysTick is the number of CPU cycles; if its value is 0, it indicates that SysTick uses a clock source from elsewhere, and the specific frequency of this clock source can only be found in the chip manual (for example, STM32 likes to provide SysTick with a clock source that is divided by 1/8 of the system frequency), at this time, the measurement result of SysTick is not the number of CPU cycles.
After ensuring that the CTRL register’s BIT2 is correctly set, and that the SysTick interrupt is enabled (set BIT1, SysTick_CTRL_TICKINT_Msk), we can simply tell the perf_counter module that SysTick has been occupied by the user—passing true here achieves this function.
#include <stdbool.h>...
void main(void){    system_clock_update();       //! Update CPU working frequency    SystemCoreClock = 72000000ul //! Assume the updated system frequency is 72MHz    init_cycle_counter(true);    ...}
About Library Matching Issues
The perf_counter.lib library has enabled Short enums/wchar (corresponding to the command line -fshort-enum -fshort-wchar) during compilation. There is no particular reason for doing this, but if your project uses a different configuration, for example:
In the project configuration shown below, “Short enums/wchar” is not checked
You will definitely see such a compilation error:
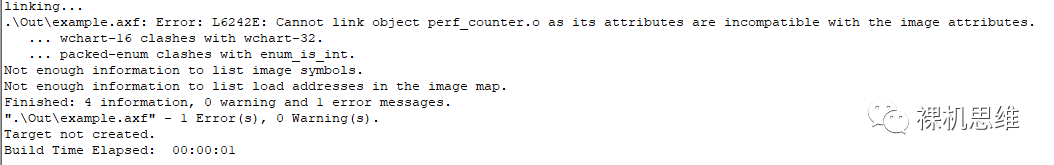
.
Out
e example.axf: Error: L6242E: Cannot link object perf_counter.o as its attributes are incompatible with the image attributes.   ... wchart-16 clashes with wchart-32.   ... packed-enum clashes with enum_is_int.
Now that we know the reason, the solution is simple: either check this option in the project configuration; or use the source code compilation mode.
Time Class Services
Microsecond Blocking Delay
perf_counter provides a us-level blocking delay function delay_us(), whose function prototype is as follows:
extern void delay_us(int32_t iUs);In fact, due to the overhead of function calls, delay_us will have a “non-accumulating” error in time judgment—depending on the optimization level, the specific number of CPU cycles varies. When we deploy using the Library method, this error is about +/-25 CPU cycles—this information actually tells us:
●When using the Library, if your CPU frequency exceeds 50MHz, delay_us() can provide a minimum <1us delay error;
●When your system frequency does not meet the above conditions, taking a system frequency of 12MHz as a reference, the delay_us error can be considered to be non-accumulating +/- 2us.
For specific evaluation methods, please refer to my previous article “[Real-time Myths] How Fast Does the CPU Actually Run?”, I will not elaborate here.
Global System Time
perf_counter provides the API function get_system_ticks(), which is used to conveniently obtain the total number of cycles the system has experienced since SysTick was enabled, its function prototype is as follows:
__attribute__((nothrow)) extern int64_t get_system_ticks(void);As you can see, its return value is a 64-bit signed integer, and even disregarding the sign bit, we can be quite sure: No matter what the chip frequency is, there will be no overflow issue before the extinction of humanity.

Considering that SystemCoreClock records the current system frequency, we can use it to convert the number of cycles obtained from get_system_ticks() into physical time. For example, we can define the following macros ourselves:
#define get_system_ms()    \
    (get_system_ticks() / (SystemCoreClock / 1000ul))#define get_system_us()    \
    (get_system_ticks() / (SystemCoreClock / 1000000ul))
For example, the get_system_ms() here can tell us how many milliseconds have passed since SysTick was enabled (generally equivalent to the start of system reset). Isn’t it particularly convenient?
Non-blocking Multiple Delays
In state machines, non-blocking delays are often an essential function, including but not limited to:
● Mechanism control delays;
● Circuit timing control;
● Communication protocol timeout handling;
● …
The following diagram is a state machine that supports multiple instances of non-blocking delays. Even if you have not read my state machine series articles, the corresponding logic should be quite straightforward.
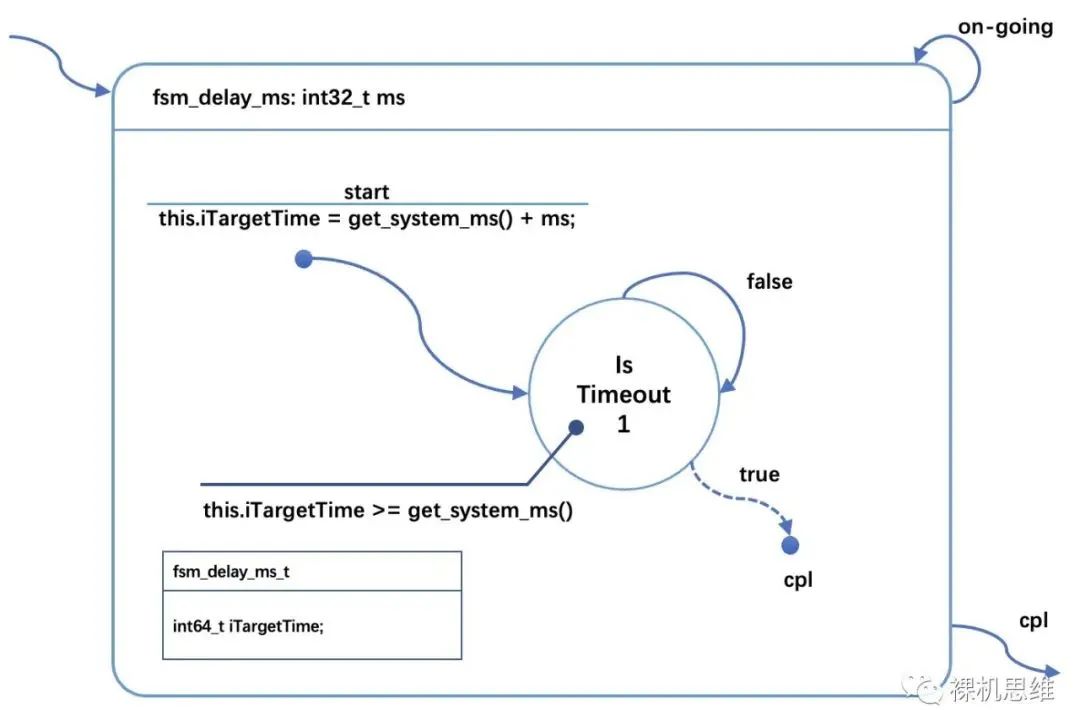
The core idea here is:
● At the start of the delay, use the derived method of get_system_ticks() to get the current system timestamp;
● Calculate the target timestamp and store it in the state machine class (stored in iTargetTime);
● In the subsequent state, poll get_system_ms() in a non-blocking manner to check whether the agreed time has arrived.
The state diagram below shows how to perform timeout checks while executing certain actions (or sub-state machines):
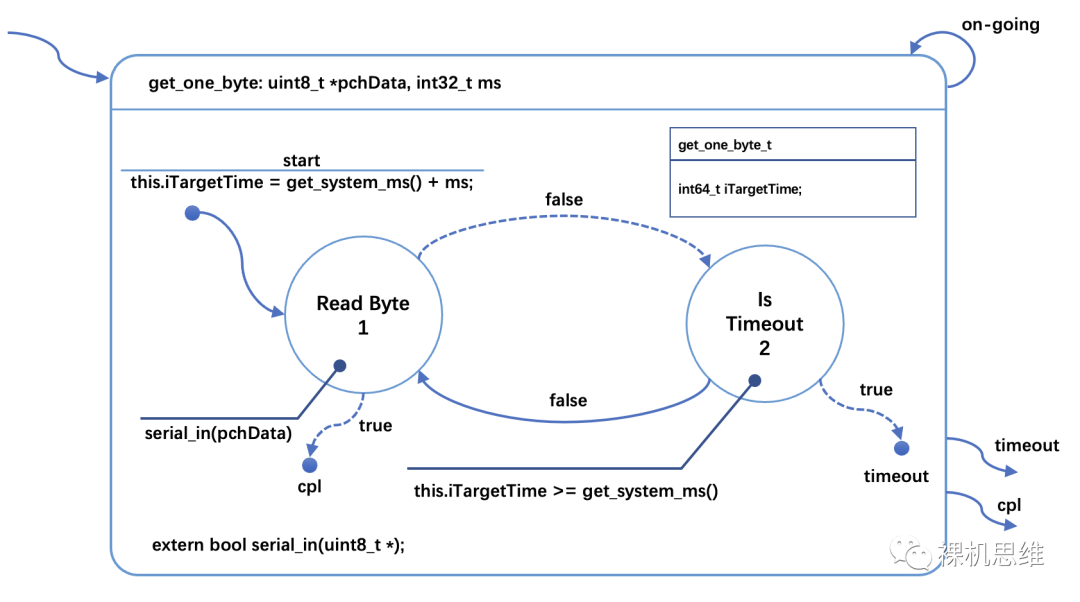
It is worth noting the details here:
● At the start of the delay, use the derived method of get_system_ticks() to get the current system timestamp;
● Calculate the target timestamp and store it in the state machine class (stored in iTargetTime);
● When reading characters fails, compare the current system timestamp to determine whether it has timed out.
For specific interpretation and translation of the state diagram, friends who are not familiar can click here to read the state machine series articles, I will not elaborate further.
Random Number Generation
Almost all C language tutorials introduce random number generation, for example:
#include <stdio.h>#include <stdlib.h>
int main (void) {   int i, n;   time_t t;      n = 5;      /* Intializes random number generator */   srand((unsigned) time(&t));
   /* Print 5 random numbers from 0 to 49 */   for( i = 0 ; i < n ; i++ ) {      printf("%d\n", rand() % 50);   }      return(0);}
Since rand() is actually a pseudo-random number generator, to achieve ideal results, without exception, all textbooks recommend using time as the seed for random numbers. With the help of get_system_ticks(), our pseudo-random generation function can almost certainly get closer to a true random number generator:
#include "perf_counter.h"#include <stdlib.h>
srand((unsigned)get_system_ticks());
Embedded C Language Extensions
perf_counter not only provides some services related to system performance measurement and time but also extends the embedded C language to a certain extent. Interested friends may want to give it a try.
Global Interrupt Masking __IRQ_SAFE
perf_counter provides a keyword __IRQ_SAFE, which can temporarily disable global interrupt responses while executing the immediately following statement or the code snippet within the following braces, and restore it after completing the corresponding operation.
//! Temporarily disable global interrupts while executing the following printf statement__IRQ_SAFE printf("hello world!");
//! Temporarily disable global interrupts while executing the code within braces__IRQ_SAFE {    ...}
//! If you want to end early, you can use continue;__IRQ_SAFE {    ...    if (some condition) {        //! We need to end early        continue;    }    //! Conditional skipping operation    ...}
__IRQ_SAFE has the following precautions when used:
● It can only be used inside functions and cannot be used to modify functions or variables.
● It supports nesting.
Compiler Type Detection
Some friends in software development may need to reliably detect the current compiler being used for various reasons, such as Arm Compiler 5, Arm Compiler 6, GCC, etc.
perf_counter provides a series of uniformly formatted macros that effectively solve the above problem. They are:
__IS_COMPILER_ARM_COMPILER_5____IS_COMPILER_ARM_COMPILER_6____IS_COMPILER_GCC____IS_COMPILER_LLVM____IS_COMPILER_IAR__These macros will only be defined when the corresponding compiler is detected. A typical usage is as follows:
#if defined(__IS_COMPILER_IAR__)__attribute__((constructor))#else__attribute__((constructor(255)))#endifvoid __perf_counter_init(void){ init_cycle_counter(true);}Here, __attribute__((constructor)) tells the compiler “please execute the function modified by it before executing the main function”. This is a GCC extension widely accepted and supported by most compilers, but since IAR does not support the syntax for queuing multiple functions, it needs to be handled differently from other compilers.
Pre-compiled Glue Macros
In many scenarios, we need to “paste” multiple “text snippets” together at compile time to generate new names, such as macros, enumerations, variable names, function names, etc. Generally speaking, we have seen similar practices:
#define TPASTE(a,b) a##bHowever, there are actually some problems with this approach, which I have detailed in my article “[Correcting the Name of Macros] The ‘World Setting’ That Should Be Written in Textbooks”, and I will not elaborate here. Purely from a functional perspective, TPASTE can only complete the “pasting” of 2 names; what if there are multiple? What if the number of names to be pasted is not fixed? perf_counter provides a solution called CONNECT(), which has the following advantages:
● The number of pasted items can vary.
● Supports pasting up to 9 snippets.
For example, if we want to generate a safe temporary name, we can try to paste the line number __LINE__, an underscore, and a user-specified suffix together:
#define __SAFE_NAME(__NAME)    \
    CONNECT(__,__LINE__,_,__NAME)
For example, the following code:
#define measure_time(...)                                   \
    ({                                                      \
        int64_t __SAFE_NAME(StartTime) = get_system_ticks();\
        __VA_ARGS__;                                        \
        get_system_ticks() - __SAFE_NAME(StartTime);        \
     })     int32_t iCycleUsed =     measure_time(        printf("Hello world!\r\n");    );
If the line number where measure_time is located is 123, then the actual corresponding code is:
int32_t iCycleUsed = ({ int64_t __123_StartTime = get_system_ticks(); __VA_ARGS__; get_system_ticks() - __123_StartTime; });The purpose of this code is to measure the time used by the code block within measure_time() and return it as the value of the expression. This uses a GCC syntax extension known as Statements and Declarations in Expressions, interested friends can refer to the link below:
https://gcc.gnu.org/onlinedocs/gcc/Statement-Exprs.html#Statement-Exprs
Array Element Enumerator
In C language, we often use for statements to access data elements. For example, the following code:
static volatile int16_t s_iADCBuffer[ADC_BUFFER_SIZE];
int16_t get_average_voltage(void){    int32_t nTotal = 0;    for (int32_t n = 0; n < ADC_BUFFER_SIZE; n++) {        n += s_iADCBuffer[n];    }    return nTotal / ADC_BUFFER_SIZE;}
In this simple example, the for loop serves to enumerate each element in the array s_iADCBuffer. Many high-level languages (even Linux kernel code) have introduced a dedicated foreach keyword to achieve such data enumeration functionality, and perf_counter is no exception, with the syntax:
foreach (<array element type>,<array name>) { ...}With the help of foreach, the above code can be simplified as follows:
static volatile int16_t s_iADCBuffer[ADC_BUFFER_SIZE];
int16_t get_average_voltage(void){    int32_t nTotal = 0;    foreach (volatile int16_t, s_iADCBuffer) {        nTotal += *_;    }    return nTotal / ADC_BUFFER_SIZE;}
Note that “_” is a pointer to the current element during enumeration, simply put, it is equivalent to (s_iADCBuffer+n) in the previous code. Since it is a pointer, it needs to be dereferenced to obtain the content of the element. Using “_” to refer to the current element in the loop is borrowed from scripting languages like Perl. If you really hate this usage and find it incomprehensible, you can also use the following method:
static volatile int16_t s_iADCBuffer[ADC_BUFFER_SIZE];
int16_t get_average_voltage(void){    int32_t nTotal = 0;    foreach (volatile int16_t, s_iADCBuffer, piItem) {        nTotal += *piItem;    }    return nTotal / ADC_BUFFER_SIZE;}
Note that foreach introduces a third parameter piItem based on the original two parameters, allowing the user to specify the variable name for the enumerated element. Isn’t it much clearer?
How to Measure How Much CPU Resources a Code Snippet Occupies
Nested __cycleof__()
Often, we care about how much CPU cycles a certain piece of code or function uses. For example, if we write an algorithm, you may be worried about “how much CPU resources does this algorithm actually use”. To solve this problem, we need to use the following formula:
CPU resource usage (percentage) = (time required for function execution) ➗ (minimum interval of algorithm execution) ✖️ 100%
For both [time required for function execution] and [minimum interval of algorithm execution], although they are both time units, considering that the CPU frequency is given (constant), the time units here can be converted into CPU cycles after multiplying by the CPU working frequency. For example, if the [minimum interval of algorithm execution] is 20ms and the CPU frequency is 72MHz, then the corresponding number of cycles is 72000000*(20ms/1000ms)=1440000 cycles. It seems that the only thing we need to measure in the above formula is [the number of cycles used by the function].
perf_counter provides a very simple operator: __cycleof__(). Assuming the code snippet we want to measure is as follows:
...my_algorithm_step_a();my_algorithm_step_b();...my_algorithm_step_c();...Then we can easily measure the result through the __cycleof__() operation:
...__cycleof__("my algorithm") { my_algorithm_step_a(); my_algorithm_step_b(); ... my_algorithm_step_c();}...If your system supports printf(), you will see output similar to the following:
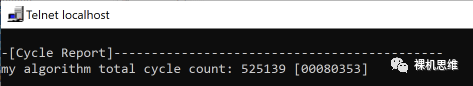
Substituting into the above formula:
525139/14400000 * 100%≈36.5% calculates that this algorithm occupies about 36.5% of CPU resources. It is worth mentioning that this method is effective for both bare metal and RTOS from a theoretical standpoint.
Some friends may quickly say, my system does not allow me to call printf, can I still use __cycleof__()? Of course! Just continue with the above code example:
int32_t nCycleUsed = 0;
...__cycleof__("my algorithm", {    nCycleUsed = _;    }) {    my_algorithm_step_a();    my_algorithm_step_b();    ...    my_algorithm_step_c();}...
The functionality of this code is:
● It measures the number of cycles used by the user function my_algorithm_step_xxx();
● The measurement result is stored in a variable called nCycleUsed;
● __cycleof__() will not call printf() to output any content.
I believe many friends will rub their eyes, look carefully again, and then turn back with a puzzled expression:

Is this C language?
What kind of syntax is this?
Don’t doubt, this is C language, just using a little GCC syntax extension (interested friends can copy the link https://gcc.gnu.org/onlinedocs/gcc/Statement-Exprs.html#Statement-Exprs). Considering that this article only introduces how to use perf_counter and does not care about how it is implemented, we can skip the part about GCC extension syntax and specifically look at the usage details of the above code:
● First, to facilitate observation, we can ignore the part inside the parentheses:
...__cycleof__(...) { my_algorithm_step_a(); my_algorithm_step_b(); ... my_algorithm_step_c();}...We can see that there is no difference from before: the part surrounded by braces is the code snippet we want to measure;
● Next, let’s specifically look at the part inside the parentheses of __cycleof__():
int32_t nCycleUsed = 0;
...__cycleof__("my algorithm", {    nCycleUsed = _;    }){...}...
It is easy to find that if we use “,” as a separator, then what is actually passed to __cycleof__() are two parts:
1. A string marking the measurement name
"my algorithm"2. A code snippet enclosed in braces:
{nCycleUsed = _;}Where nCycleUsed is a variable that has been initialized in advance.
Here, for the string representing the measurement name “my algorithm”, in this usage, it will not occupy any RAM or ROM in the final compiled result, but it is a necessary syntax structure.
For the code snippet enclosed in braces, you can almost do whatever you want:
● You can write any number of codes
● You can call functions
● You can define variables (of course, the variables defined here are local variables)
But what we generally want to do is to use the local variable “_” defined by __cycleof__() to obtain the measurement result—this is also the intention of the following code:
nCycleUsed = _;It should be noted that the local variable “_” has a lifecycle limited to this brace, so it will not affect the part outside the __cycleof__() structure—otherwise, the following code is meaningless:
int32_t nCycleUsed = 0;
...__cycleof__("my algorithm", {        nCycleUsed = _;    }) {    my_algorithm_step_a();    my_algorithm_step_b();    ...    my_algorithm_step_c();}
printf("Cycle Used %d", _);
The compiler will tell you without hesitation that “_” is an undefined variable. Conversely, if you do it like this:
int32_t nCycleUsed = 0;
...__cycleof__("my algorithm", {        nCycleUsed = _;        printf("Cycle Used %d", _);    }) {    my_algorithm_step_a();    my_algorithm_step_b();    ...    my_algorithm_step_c();}
You will see the output result you desire:
System Timestamp get_system_ticks()
If you are curious about the equivalent form (expanded form) of the above example, there is actually no need to worry. The above code is logically equivalent to the following form:
int32_t nCycleUsed = 0;
...do {    int64_t _ = get_system_ticks();    {        my_algorithm_step_a();        my_algorithm_step_b();        ...        my_algorithm_step_c();    }    _ = get_system_ticks() - _;
    //! The code we added    nCycleUsed = _;    printf("Cycle Used %d", _);} while(0);
Isn’t it suddenly less mysterious? By expanding the “logically equivalent” form, we can easily find some interesting content:
● The core function is a function called get_system_ticks(). In fact, it returns the number of CPU cycles experienced since SysTick was enabled after reset—since it is of type int64_t, there is no need to worry about exceeding the range of the 24-bit SysTick counter, nor the possibility of overflow within the scope of human history. Knowing this, clever friends can get creative.
● Since “_” is a local variable, we can conclude that __cycleof__() supports nesting.
It should be noted that get_system_tick() itself also incurs CPU clock overhead, so if you want to obtain more accurate results, it is recommended to obtain calibration values through the following method:
static int64_t s_lPerfCalib;
void calib_perf_counter(void) {    int64_t lTemp = get_system_tick();    s_lPerfCalib = get_system_tick() - lTemp;}
int64_t get_perf_counter_calib(void){    return s_lPerfCalib;}
How to use this, I will not elaborate here.
Continuous Timing Mode
To facilitate testing needs in certain special circumstances, perf_counter also provides a continuous timing function similar to the stopwatch used by physical education teachers through the combination of start_cycle_counter() and stop_cycle_counter(), that is: after the start, you can record the time used by each student. Specifically manifested as:
int32_t nCycles = 0;start_cycle_counter(); //!< Start total timing...nCycles = stop_cycle_counter(); //!< Get the time used since the start for the first time...nCycles = stop_cycle_counter(); //!< Get the time used since the start for the second time...nCycles = stop_cycle_counter(); //!< Get the time used since the start for the third time...It is worth emphasizing that although start_cycle_counter() and stop_cycle_counter() have start and stop in their names, this only has logical significance and will not actually interfere with the functionality of SysTick (that is, it will not turn SysTick on or off). This is also the reason why this library dares to claim that it will not affect the existing SysTick functionality of users.
Final Thoughts
perf_counter was originally born out of my daily work—when I found that I needed to repeatedly copy performance testing-related code between different projects, creating a module to save my time became the best excuse to be lazy.
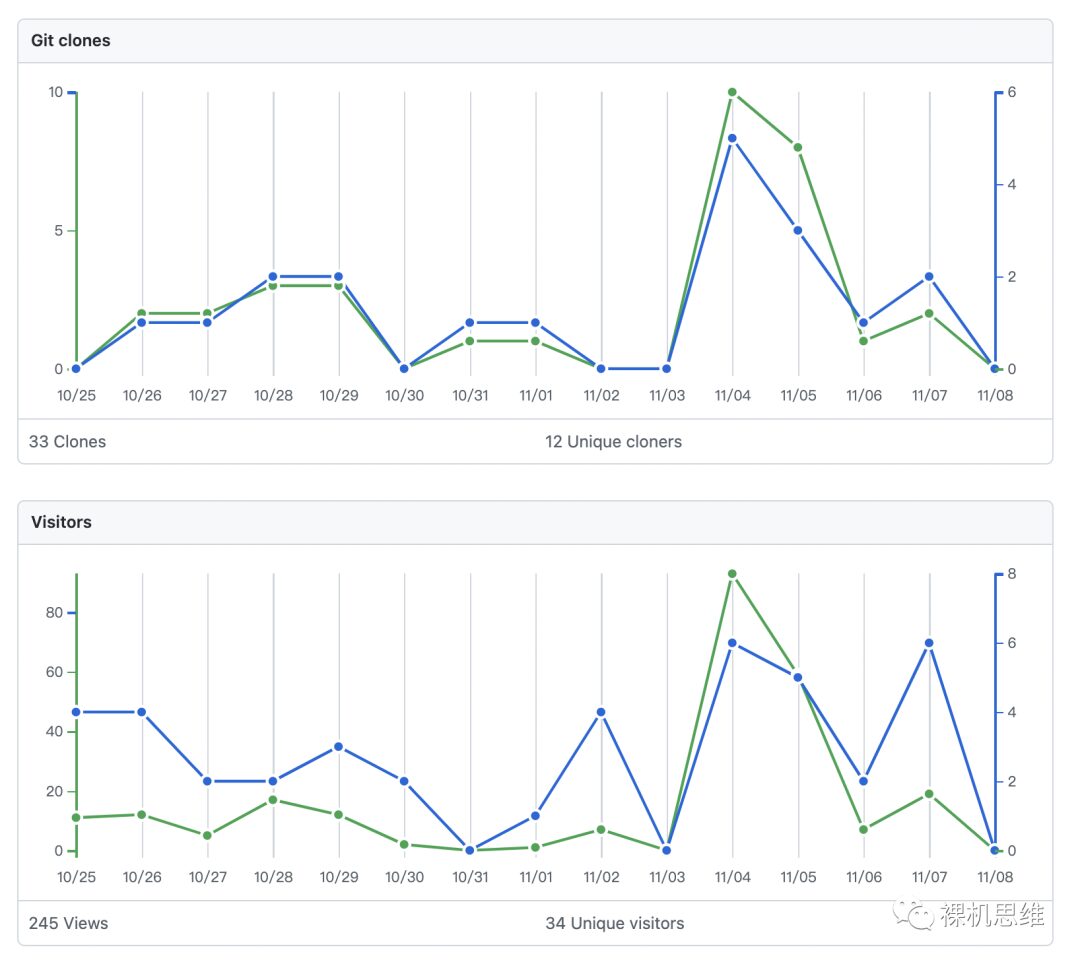
On the Chinese internet, measuring system performance in embedded projects is not a popular topic. In daily application development, compared to quantitative analysis, everyone may prefer to evaluate system performance based on intuition. I have already complained about this in my article “[Real-time Myths] How Fast Does the CPU Actually Run?”. In contrast, how to achieve us-level delays is more popular. I have seen many people using debugging peripherals like DWT that are limited to certain processors and not recommended for users as delays, and seeing that there are better and more universal solutions in hand, I really can’t bear to keep it to myself—this also became the opportunity for perf_counter to become an open-source project on github. Compared to the initial crude code, looking at the now semi-professional cmsis-pack, I find it hard to suppress the feeling of self-moved within me. Although I haven’t put much effort into promoting it, seeing the almost uninterrupted visits on GitHub, it’s hard to say that there isn’t a sense of pride in my heart:
Copyright belongs to the original author, if there is any infringement, please contact to delete
END


关于安芯教育


安芯教育是聚焦AIoT(人工智能+物联网)的创新教育平台,提供从中小学到高等院校的贯通式AIoT教育解决方案。
安芯教育依托Arm技术,开发了ASC(Arm智能互联)课程及人才培养体系。已广泛应用于高等院校产学研合作及中小学STEM教育,致力于为学校和企业培养适应时代需求的智能互联领域人才。