4.4
Opening the FSP Configuration Interface
If the target project is a new project, it can be compiled and run directly. However, if it is an imported project, you need to first open the FSP configuration interface to regenerate the FSP library-related code before compiling; otherwise, a compilation error will occur. The specific steps are as follows.
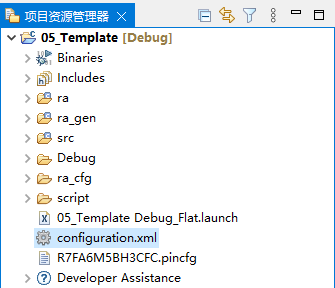
In the left project explorer, expand the project folder and find the “configuration.xml” file. Double-click this file to open the project’s “FSP Configuration” page, as shown in the figure below.
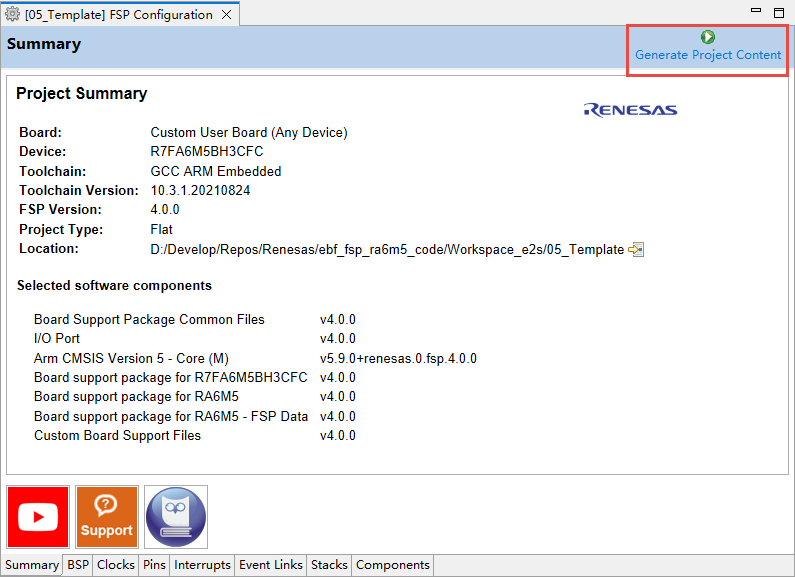
The opened FSP configuration page is shown in the figure below. Next, click the “Generate Project Content” button in the upper right corner, and the software will automatically generate the FSP library code based on the existing FSP configuration of the project.
Finally, compile the project.
4.5
Compiling the e2s Project
After installing the e2studio software, the necessary compiler is already installed, as the e2studio installer includes a GCC ARM compiler. Of course, users can also install and integrate the latest stable version of the GCC compiler or the official ARM compiler.
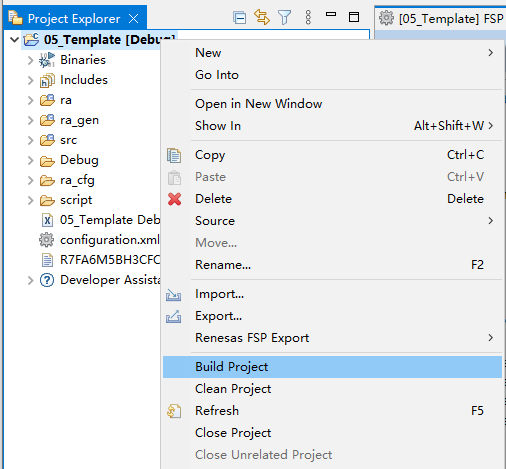
In the left project explorer, right-click the project you want to compile, and select “Build Project” from the context menu to start compiling the project.
4.6
Using the Debugger to Download the Program
Due to tool limitations, currently only J-Link and E2 / E2-Lite debuggers are supported:
-
Currently, when developing in e2studio software, you can use J-Link and Renesas E2 / E2-Lite for debugging and downloading programs. If you need to download the program using J-Link, there are generally two methods:
-
First, start the J-Link debugger, and once the download button lights up, click the download button to automatically download the program;
-
Second, use the additional J-Flash Lite software to program Hex, srec, and other files.
-
Currently, the Wildfire DAP debugger cannot be used for debugging and downloading programs in e2studio software.
To start debugging in e2s, follow these general steps:
-
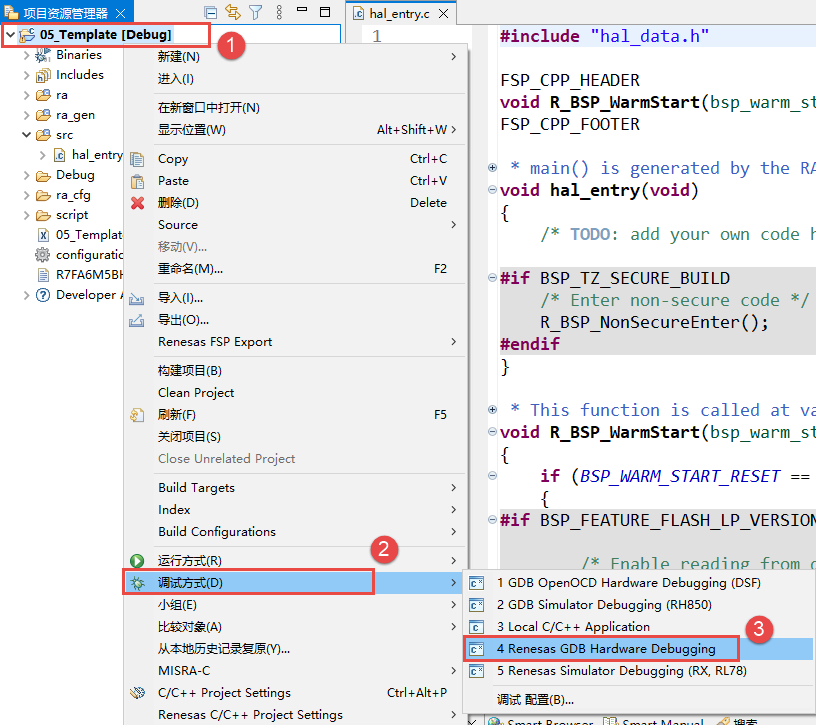
①: Right-click the project that has been successfully compiled and needs debugging to bring up the context menu;
-
②: Click to select “Debug Method”;
-
③: Click to select “Renesas GDB Hardware Debugging” to start debugging.
As shown in the figure below:
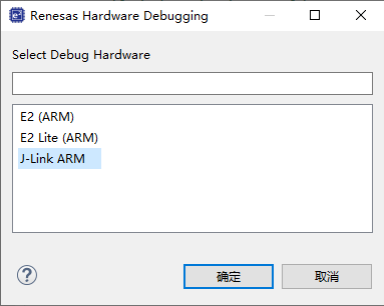
It is important to note that if there is no debugger configuration information under the project, further configuration is required.
First, select the debugger. Here, select J-Link and then click OK:
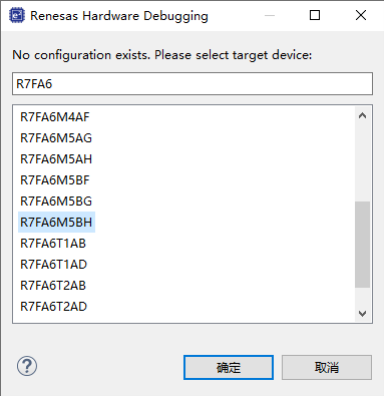
Next, select the target chip model. For example, the MCU chip model on the Qiming 6M5 development board is R7FA6M5BH3CFC, so select R7FA6M5BH and then click OK:
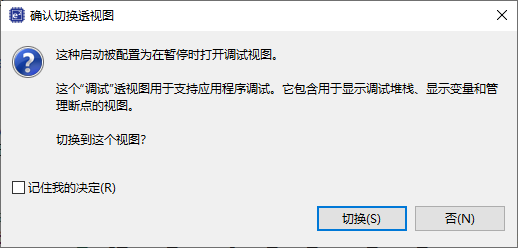
Finally, start debugging and enter the debugging interface. We can switch to the “Debug” perspective to facilitate debugging:


Need Technical Support?
If you have any questions while using Renesas MCU/MPU products, you can scan the QR code below or copy the URL into your browser to access the Renesas Technical Forum to find answers or get online technical support.

https://community-ja.renesas.com/zh/forums-groups/mcu-mpu/
To be continued
Recommended Reading

How to Operate Registers with C Language – Practical Guide for Renesas RA Series FSP Library Development (10)

Creating a New Project with e²studio – Practical Guide for Renesas RA Series FSP Library Development (11)
Deleting Project from Workspace – Practical Guide for Renesas RA Series FSP Library Development (12)