In classification, there are many different evaluation metrics. The most commonly used is accuracy, which measures the frequency of correct predictions made by the model. Accuracy is a good metric because it is easy to understand, and we generally want to achieve the most correct guesses. In some cases, you may need to consider using other evaluation metrics.
Another common metric is AUC, which stands for the Area Under the Receiver Operating Characteristic (ROC) Curve. The ROC curve plots the true positive (TP) rate against the false positive (FP) rate at different classification thresholds. The threshold is a different probability cutoff used to distinguish between two classes in binary classification. It uses probabilities to tell us how well the model can differentiate between categories.
Imbalanced Data
Suppose we have an imbalanced dataset where the majority of the data belongs to one value. We can improve the model’s accuracy by predicting the majority class.
import numpy as np
from sklearn.metrics import accuracy_score, confusion_matrix, roc_auc_score, roc_curve
n = 10000
ratio = .95
n_0 = int((1-ratio) * n)
n_1 = int(ratio * n)
y = np.array([0] * n_0 + [1] * n_1)
# below are the probabilities obtained from a hypothetical model that always predicts the majority class
# probability of predicting class 1 is going to be 100%
y_proba = np.array([1]*n)
y_pred = y_proba > .5
print(f'accuracy score: {accuracy_score(y, y_pred)}')
cf_mat = confusion_matrix(y, y_pred)
print('Confusion matrix')
print(cf_mat)
print(f'class 0 accuracy: {cf_mat[0][0]/n_0}')
print(f'class 1 accuracy: {cf_mat[1][1]/n_1}')
Results: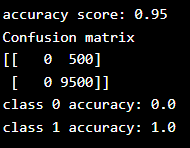 Although we achieved a very high accuracy, the model did not provide any information about the data, making it useless. We predicted class 1 with 100% accuracy, while the prediction for class 0 was 0% inaccurate. To lower the accuracy, it might be better to build a model that can distinguish between the two classes to some extent.Example:
import numpy as np
from sklearn.metrics import accuracy_score, confusion_matrix, roc_auc_score, roc_curve
n = 10000
ratio = .95
n_0 = int((1-ratio) * n)
n_1 = int(ratio * n)
y = np.array([0] * n_0 + [1] * n_1)
# below are the probabilities obtained from a hypothetical model that doesn't always predict the mode
y_proba_2 = np.array(
    np.random.uniform(0, .7, n_0).tolist() +
    np.random.uniform(.3, 1,  n_1).tolist())
y_pred_2 = y_proba_2 > .5
print(f'accuracy score: {accuracy_score(y, y_pred_2)}')
cf_mat = confusion_matrix(y, y_pred_2)
print('Confusion matrix')
print(cf_mat)
print(f'class 0 accuracy: {cf_mat[0][0]/n_0}')
print(f'class 1 accuracy: {cf_mat[1][1]/n_1}')
Results: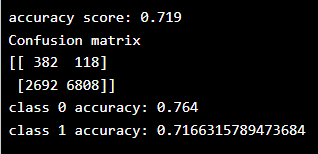
For the second set of predictions, our accuracy score is not as high as the first set, but the accuracy for each class is more balanced. Using accuracy as an evaluation metric, we would rate the first model’s score higher than the second model, even though it does not provide any information about the data.
In this case, it is better to use other evaluation metrics, such as AUC.
import matplotlib.pyplot as plt
def plot_roc_curve(true_y, y_prob):    """    plots the roc curve based of the probabilities    """
    fpr, tpr, thresholds = roc_curve(true_y, y_prob)    plt.plot(fpr, tpr)    plt.xlabel('False Positive Rate')    plt.ylabel('True Positive Rate')
Model One:
plot_roc_curve(y, y_proba)
print(f'model 1 AUC score: {roc_auc_score(y, y_proba)}')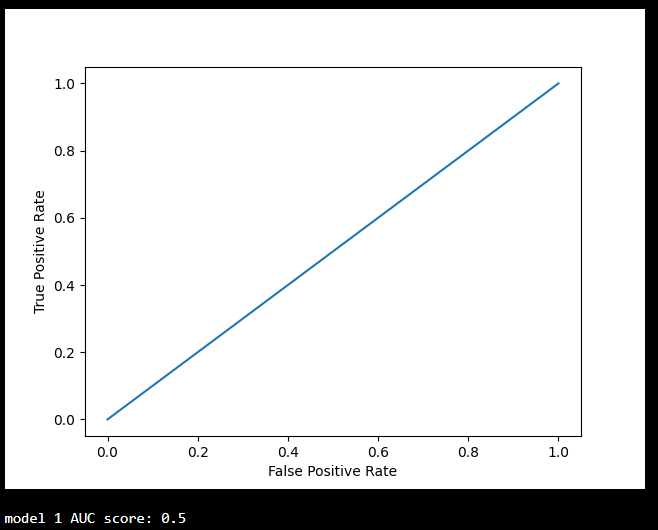 Model Two:
plot_roc_curve(y, y_proba_2)
print(f'model 2 AUC score: {roc_auc_score(y, y_proba_2)}')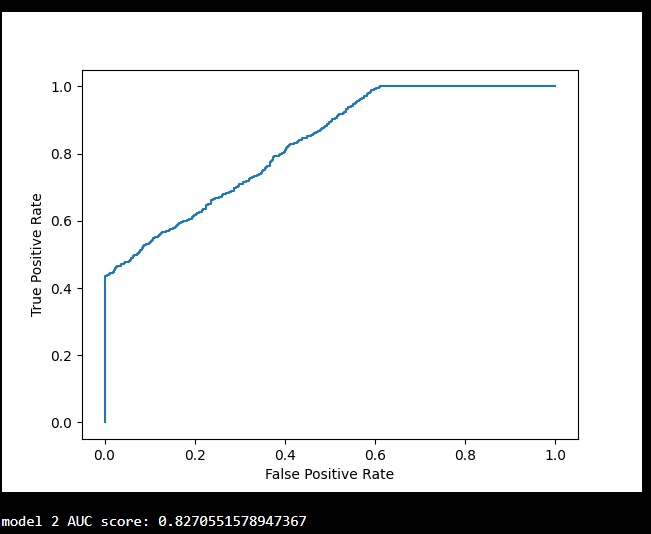 An AUC score of approximately 0.5 means that the model cannot distinguish between the two classes, and the curve looks like a line with a slope of 1. The closer the AUC score is to 1, the better the model can separate the two classes, and the curve will be closer to the top left corner of the graph.
Probabilities
Since AUC is a metric that utilizes class prediction probabilities, we can have more confidence in a model with a higher AUC score compared to one with a lower score, even if their accuracies are similar.
In the data below, we have two sets of probabilities from hypothetical models. The first set of probabilities is less “confident” when predicting the two classes (probabilities close to 0.5). The second set of probabilities is more “confident” when predicting the two classes (probabilities close to the extremes of 0 or 1).
import numpy as np
from sklearn.metrics import accuracy_score, confusion_matrix, roc_auc_score, roc_curve
n = 10000
y = np.array([0] * n + [1] * n)
# y_prob_1 = np.array(    np.random.uniform(.25, .5, n//2).tolist() +     np.random.uniform(.3, .7, n).tolist() +     np.random.uniform(.5, .75, n//2).tolist())
y_prob_2 = np.array(    np.random.uniform(0, .4, n//2).tolist() +     np.random.uniform(.3, .7, n).tolist() +     np.random.uniform(.6, 1, n//2).tolist())
print(f'model 1 accuracy score: {accuracy_score(y, y_prob_1>.5)}')
print(f'model 2 accuracy score: {accuracy_score(y, y_prob_2>.5)}')
print(f'model 1 AUC score: {roc_auc_score(y, y_prob_1)}')
print(f'model 2 AUC score: {roc_auc_score(y, y_prob_2)}')
Results: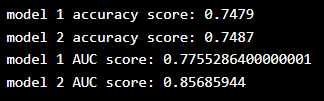 Display Model One Curve:
plot_roc_curve(y, y_prob_1)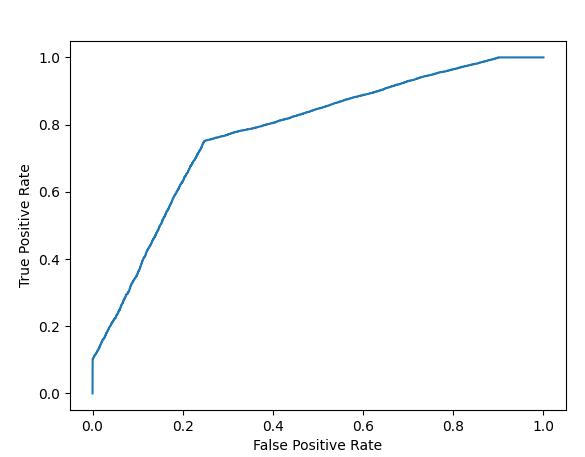 Display Model Two Curve:
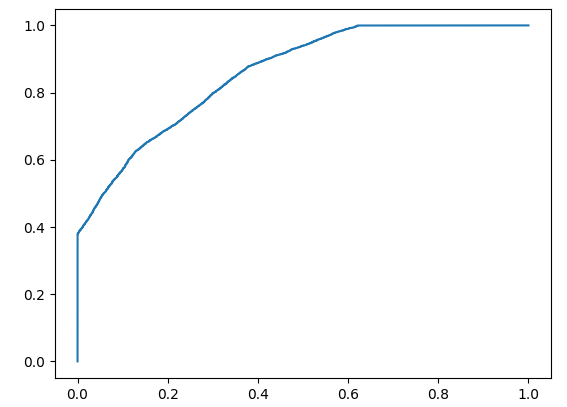 Even though both models have similar accuracy, the model with the higher AUC score is more reliable because it takes into account the predicted probabilities. It is more likely to provide higher accuracy when predicting future data.