This article is reprinted with permission from the WeChat public account “Big Data Digest | bigdatadigest”
Compiled by: Aileen, Xu Lingxiao
Using Python to draw famous mathematical images or animations,
showcasing the charm of algorithms in mathematics.
Mandelbrot Set

Code: 46 lines (34 sloc) 1.01 KB
| ”’ |
| A fast Mandelbrot set wallpaper renderer |
| reddit discussion: https://www.reddit.com/r/math/comments/2abwyt/smooth_colour_mandelbrot/ |
| ”’ |
| import numpy as np |
| from PIL import Image |
| from numba import jit |
| MAXITERS = 200 |
| RADIUS = 100 |
| @jit |
| def color(z, i): |
| v = np.log2(i + 1 – np.log2(np.log2(abs(z)))) / 5 |
| if v < 1.0: |
| return v**4, v**2.5, v |
| else: |
| v = max(0, 2–v) |
| return v, v**1.5, v**3 |
| @jit |
| def iterate(c): |
| z = 0j |
| for i in range(MAXITERS): |
| if z.real*z.real + z.imag*z.imag > RADIUS: |
| return color(z, i) |
| z = z*z + c |
| return 0, 0 ,0 |
| def main(xmin, xmax, ymin, ymax, width, height): |
| x = np.linspace(xmin, xmax, width) |
| y = np.linspace(ymax, ymin, height) |
| z = x[None, :] + y[:, None]*1j |
| red, green, blue = np.asarray(np.frompyfunc(iterate, 1, 3)(z)).astype(np.float) |
| img = np.dstack((red, green, blue)) |
| Image.fromarray(np.uint8(img*255)).save(‘mandelbrot.png‘) |
| if __name__ == ‘__main__‘: |
| main(–2.1, 0.8, –1.16, 1.16, 1200, 960) |
Domino Shuffle Algorithm
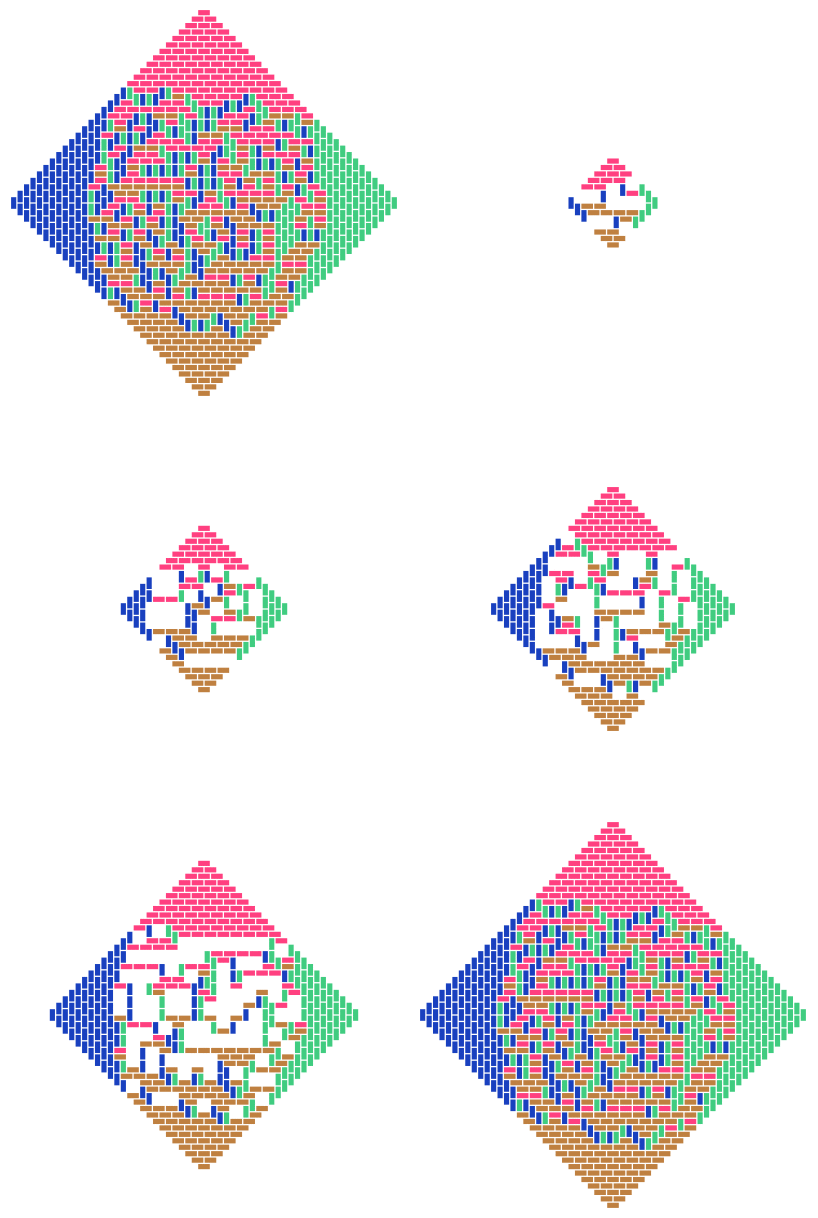
Code link: https://github.com/neozhaoliang/pywonderland/tree/master/src/domino
Regular Icosahedron Kaleidoscope
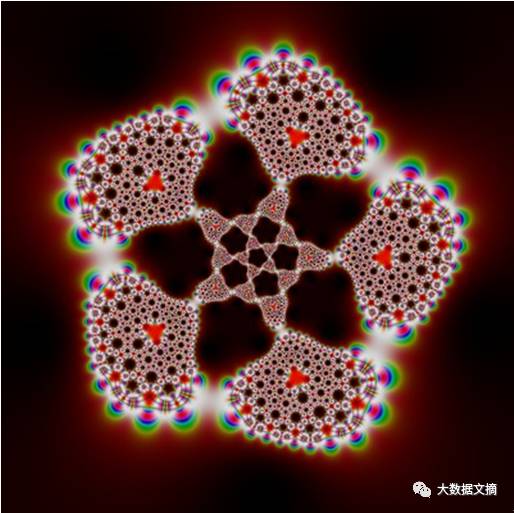
Code: 53 lines (40 sloc) 1.24 KB
| ”’ |
| A kaleidoscope pattern with icosahedral symmetry. |
| ”’ |
| import numpy as np |
| from PIL import Image |
| from matplotlib.colors import hsv_to_rgb |
| def Klein(z): |
| ”’Klein’s j-function”’ |
| return 1728 * (z * (z**10 + 11 * z**5 – 1))**5 / \ |
| (–(z**20 + 1) + 228 * (z**15 – z**5) – 494 * z**10)**3 |
| def RiemannSphere(z): |
| ”’ |
| map the complex plane to Riemann’s sphere via stereographic projection |
| ”’ |
| t = 1 + z.real*z.real + z.imag*z.imag |
| return 2*z.real/t, 2*z.imag/t, 2/t–1 |
| def Mobius(z): |
| ”’ |
| distort the result image by a mobius transformation |
| ”’ |
| return (z – 20)/(3*z + 1j) |
| def main(imgsize): |
| x = np.linspace(–6, 6, imgsize) |
| y = np.linspace(6, –6, imgsize) |
| z = x[None, :] + y[:, None]*1j |
| z = RiemannSphere(Klein(Mobius(Klein(z)))) |
| # define colors in hsv space |
| H = np.sin(z[0]*np.pi)**2 |
| S = np.cos(z[1]*np.pi)**2 |
| V = abs(np.sin(z[2]*np.pi) * np.cos(z[2]*np.pi))**0.2 |
| HSV = np.dstack((H, S, V)) |
| # transform to rgb space |
| img = hsv_to_rgb(HSV) |
| Image.fromarray(np.uint8(img*255)).save(‘kaleidoscope.png‘) |
| if __name__ == ‘__main__‘: |
| import time |
| start = time.time() |
| main(imgsize=800) |
| end = time.time() |
| print(‘runtime: {:3f} seconds‘.format(end – start)) |
Newton Iteration Fractal

Code: 46 lines (35 sloc) 1.05 KB
| import numpy as np |
| import matplotlib.pyplot as plt |
| from numba import jit |
| # define functions manually, do not use numpy’s poly1d function! |
| @jit(‘complex64(complex64)‘, nopython=True) |
| def f(z): |
| # z*z*z is faster than z**3 |
| return z*z*z – 1 |
| @jit(‘complex64(complex64)‘, nopython=True) |
| def df(z): |
| return 3*z*z |
| @jit(‘float64(complex64)‘, nopython=True) |
| def iterate(z): |
| num = 0 |
| while abs(f(z)) > 1e-4: |
| w = z – f(z)/df(z) |
| num += np.exp(–1/abs(w–z)) |
| z = w |
| return num |
| def render(imgsize): |
| x = np.linspace(–1, 1, imgsize) |
| y = np.linspace(1, –1, imgsize) |
| z = x[None, :] + y[:, None] * 1j |
| img = np.frompyfunc(iterate, 1, 1)(z).astype(np.float) |
| fig = plt.figure(figsize=(imgsize/100.0, imgsize/100.0), dpi=100) |
| ax = fig.add_axes([0, 0, 1, 1], aspect=1) |
| ax.axis(‘off‘) |
| ax.imshow(img, cmap=‘hot‘) |
| fig.savefig(‘newton.png‘) |
| if __name__ == ‘__main__‘: |
| import time |
| start = time.time() |
| render(imgsize=400) |
| end = time.time() |
| print(‘runtime: {:03f} seconds‘.format(end – start)) |
Root System of Lie Algebra E8
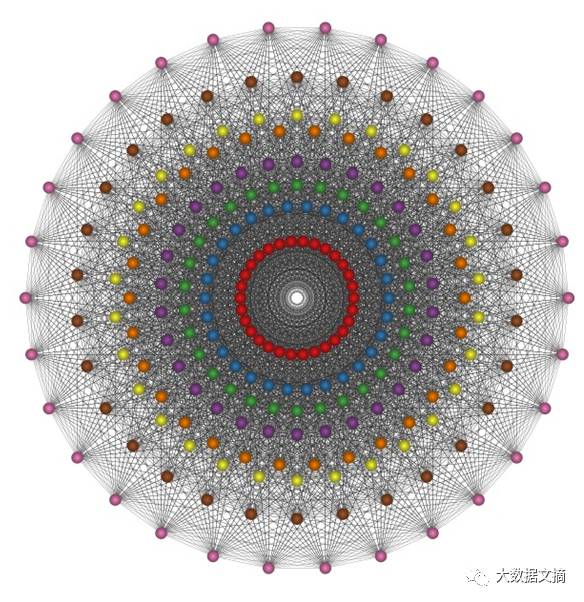
Code link: https://github.com/neozhaoliang/pywonderland/blob/master/src/misc/e8.py
Fundamental Domain of Modular Group
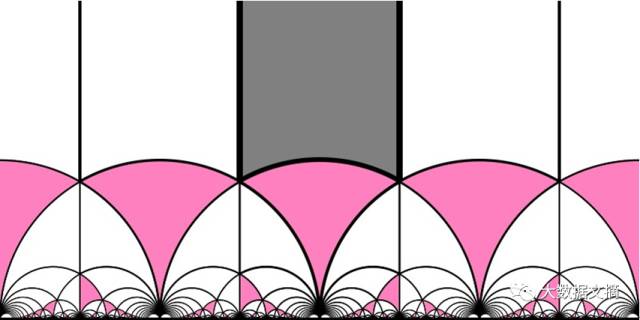
Code link:
https://github.com/neozhaoliang/pywonderland/blob/master/src/misc/modulargroup.py
Penrose Tiling
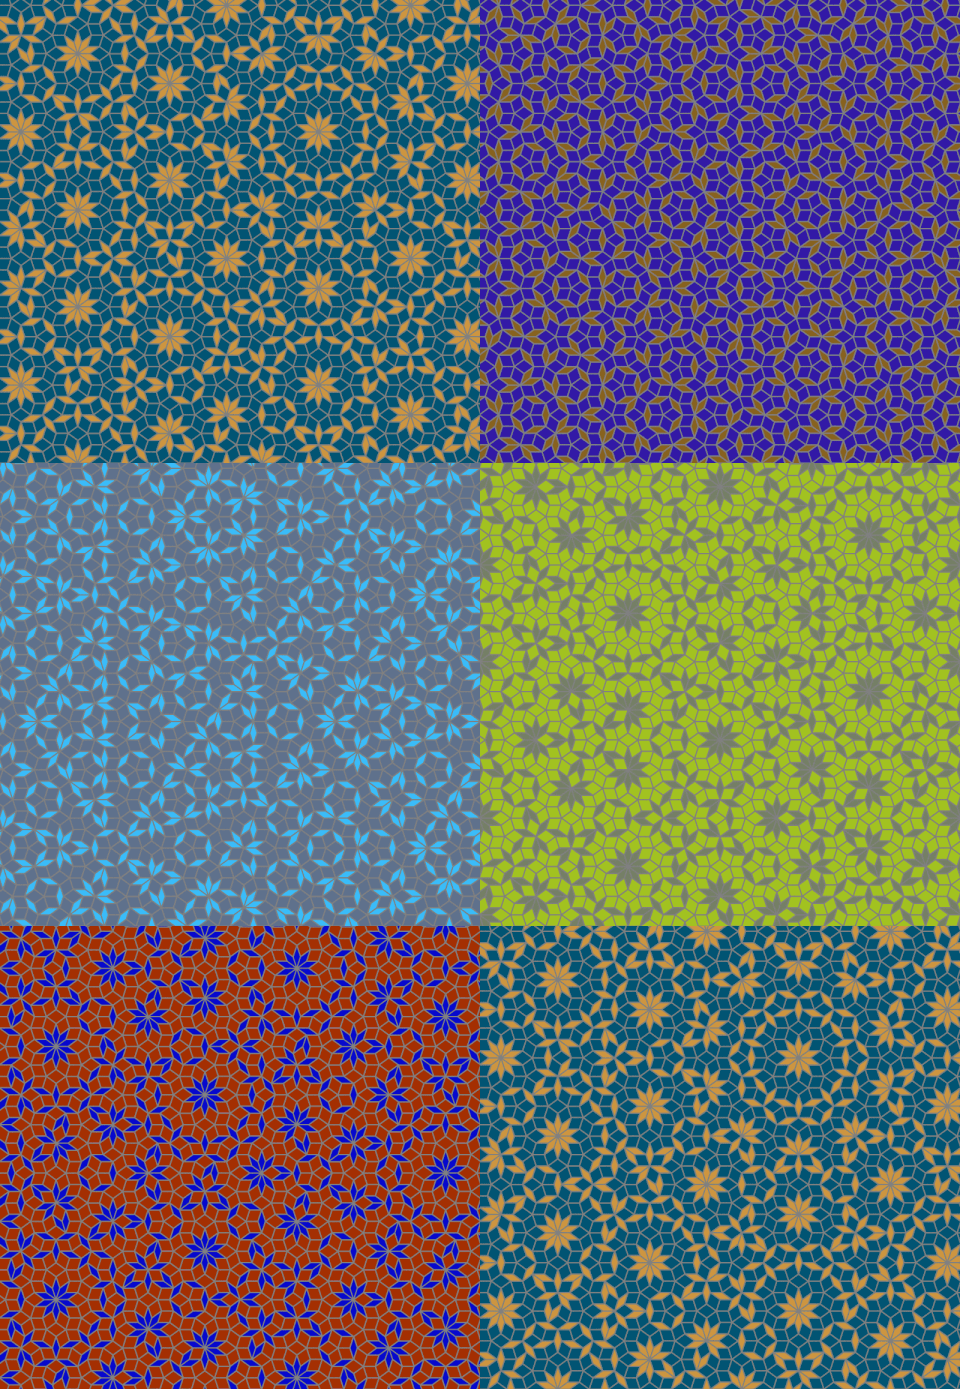
Code link:
https://github.com/neozhaoliang/pywonderland/blob/master/src/misc/penrose.py
Wilson Algorithm
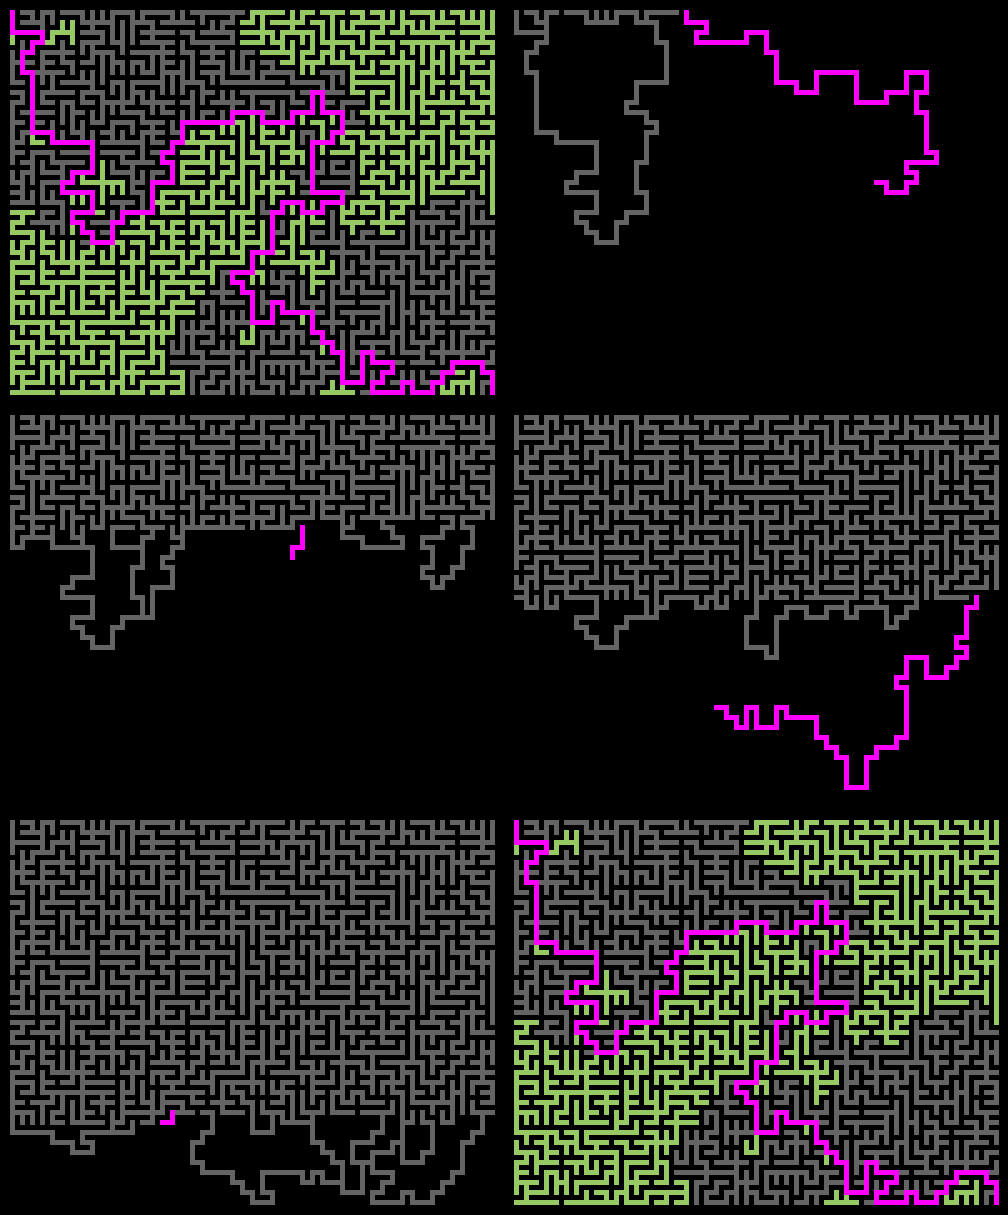
Code link: https://github.com/neozhaoliang/pywonderland/tree/master/src/wilson
Reaction-Diffusion Equation Simulation
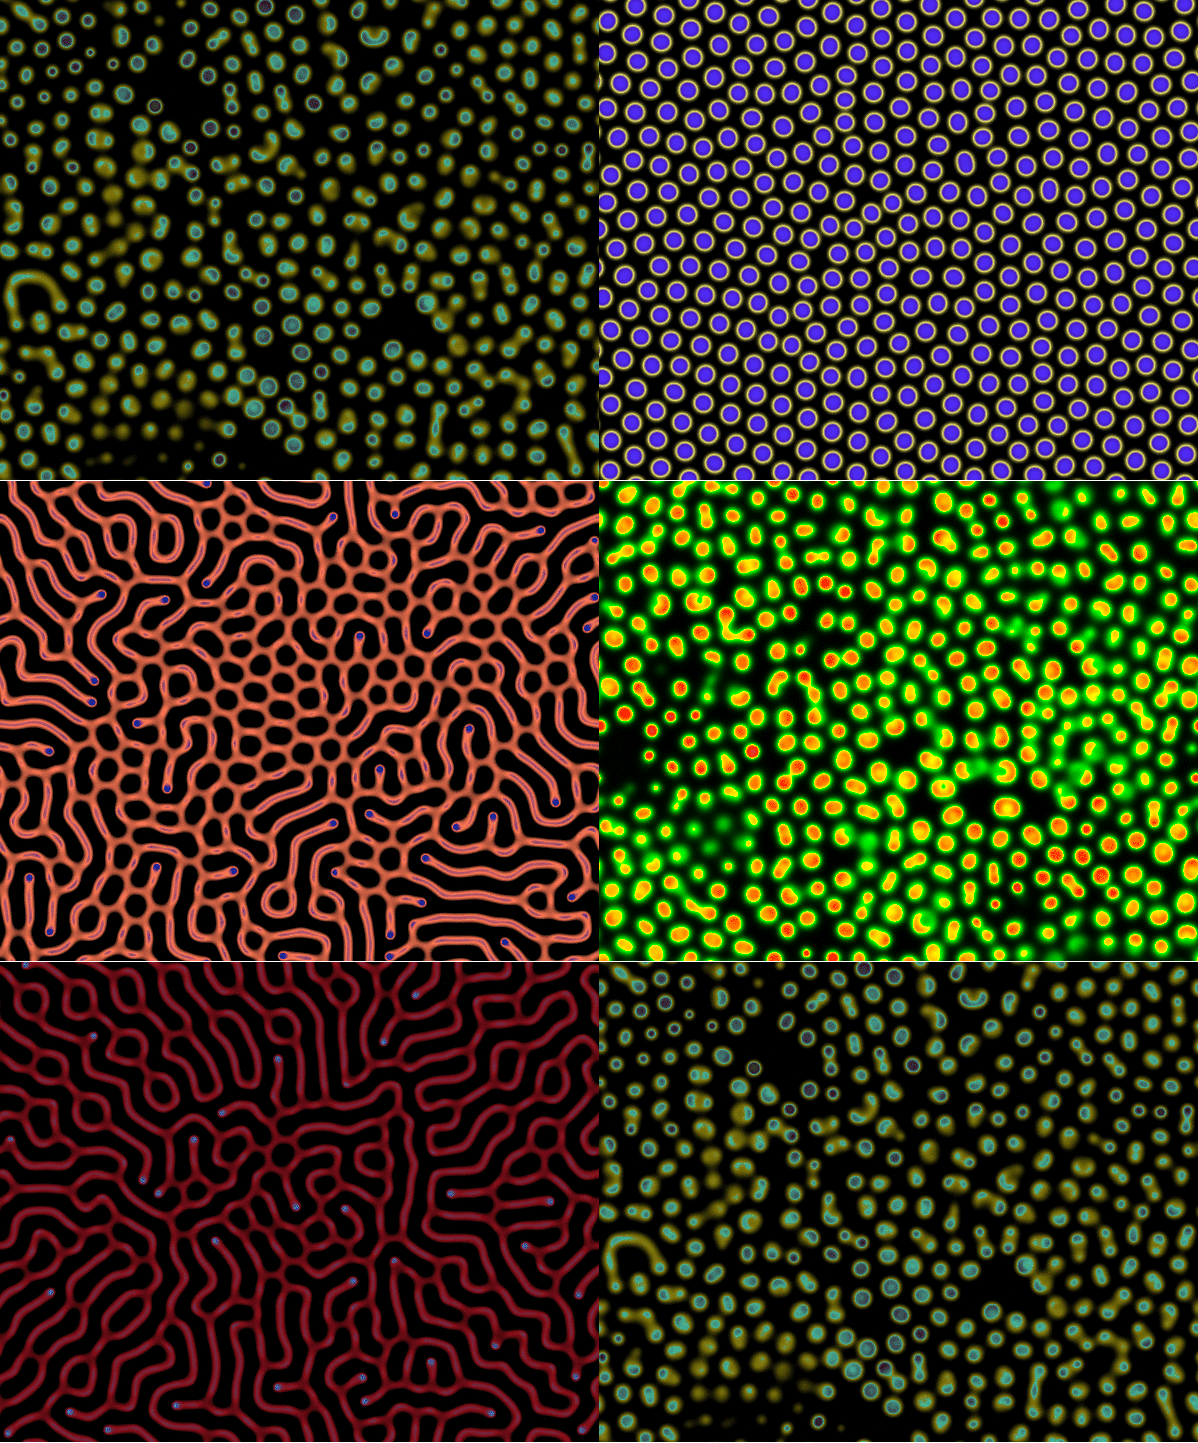
Code link: https://github.com/neozhaoliang/pywonderland/tree/master/src/grayscott
120 Cells
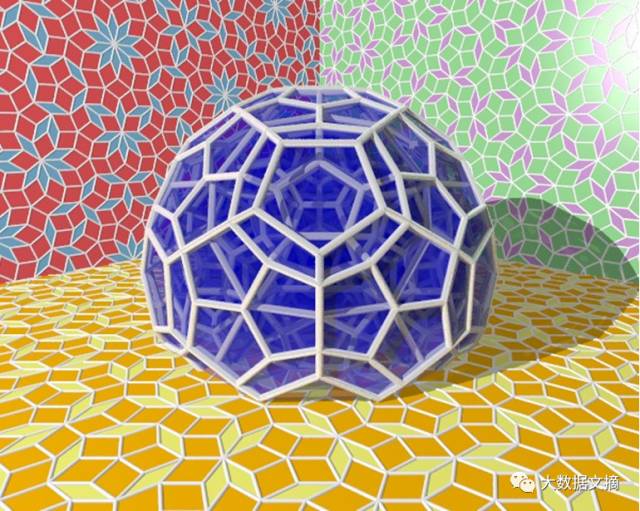
Code: 69 lines (48 sloc) 2.18 KB
| # pylint: disable=unused-import |
| # pylint: disable=undefined-variable |
| from itertools import combinations, product |
| import numpy as np |
| from vapory import * |
| class Penrose(object): |
| GRIDS = [np.exp(2j * np.pi * i / 5) for i in range(5)] |
| def __init__(self, num_lines, shift, thin_color, fat_color, **config): |
| self.num_lines = num_lines |
| self.shift = shift |
| self.thin_color = thin_color |
| self.fat_color = fat_color |
| self.objs = self.compute_pov_objs(**config) |
| def compute_pov_objs(self, **config): |
| objects_pool = [] |
| for rhombi, color in self.tile(): |
| p1, p2, p3, p4 = rhombi |
| polygon = Polygon(5, p1, p2, p3, p4, p1, |
| Texture(Pigment(‘color‘, color), config[‘default‘])) |
| objects_pool.append(polygon) |
| for p, q in zip(rhombi, [p2, p3, p4, p1]): |
| cylinder = Cylinder(p, q, config[‘edge_thickness‘], config[‘edge_texture‘]) |
| objects_pool.append(cylinder) |
| for point in rhombi: |
| x, y = point |
| sphere = Sphere((x, y, 0), config[‘vertex_size‘], config[‘vertex_texture‘]) |
| objects_pool.append(sphere) |
| return Object(Union(*objects_pool)) |
| def rhombus(self, r, s, kr, ks): |
| if (s – r)**2 % 5 == 1: |
| color = self.thin_color |
| else: |
| color = self.fat_color |
| point = (Penrose.GRIDS[r] * (ks – self.shift[s]) |
| – Penrose.GRIDS[s] * (kr – self.shift[r])) *1j / Penrose.GRIDS[s–r].imag |
| index = [np.ceil((point/grid).real + shift) |
| for grid, shift in zip(Penrose.GRIDS, self.shift)] |
| vertices = [] |
| for index[r], index[s] in [(kr, ks), (kr+1, ks), (kr+1, ks+1), (kr, ks+1)]: |
| vertices.append(np.dot(index, Penrose.GRIDS)) |
| vertices_real = [(z.real, z.imag) for z in vertices] |
| return vertices_real, color |
| def tile(self): |
| for r, s in combinations(range(5), 2): |
| for kr, ks in product(range(–self.num_lines, self.num_lines+1), repeat=2): |
| yield self.rhombus(r, s, kr, ks) |
| def put_objs(self, *args): |
| return Object(self.objs, *args) |
Original link: https://github.com/neozhaoliang/pywonderland/blob/master/README.md
This article is reprinted with permission fromBig Data Digest

Editor: yangfz
Recent Popular Articles Top 10
↓ Click the title to view ↓
1. What is Mathematics?
2. Comic | How did Li Zhengdao and Yang Zhenning win the Nobel Prize?
3. Does a laser pointer emit laser? No?
4. What is the essence of flame?
5. Seven things you don’t know about Schrödinger
6. Review of famous academic fraud incidents | 315 Special
7. As an older master’s or doctoral student, can you still purely like someone?
8. The universe is constantly expanding, why are you not affected and getting fat?
9. 14 numerical pattern problems you can’t guess even if you die
10. Is the world really deterministic?
Click here to view all past popular articles
