Skip to content
Recently, I have been deeply researching the “Do It” experiments in the new textbook section on “Electromagnetic Induction” to explore the relationship between the drop height of a magnet and the maximum value of the induced current in a coil. When using the maximum reading of a DC meter as the peak value of the induced current, I obtained a conclusion that was completely contrary to the experimental expectations.
This time, I used the combination of Phyphox, ESP32, and ADS1115 to explore the relationship between the maximum induced current and the drop height of the magnet, achieving quite satisfactory results.
2 Early Research by the WeChat Public Account “Yujian Physics”
It is not advisable to use a DC meter to verify or explore Faraday’s law of electromagnetic induction.
Experiments on Lenz’s Law Using Phyphox, ESP32, and ADS1115
Experimental Exploration on Lenz’s Law Using Phyphox and ESP32 Bluetooth
3 Experimental Exploration
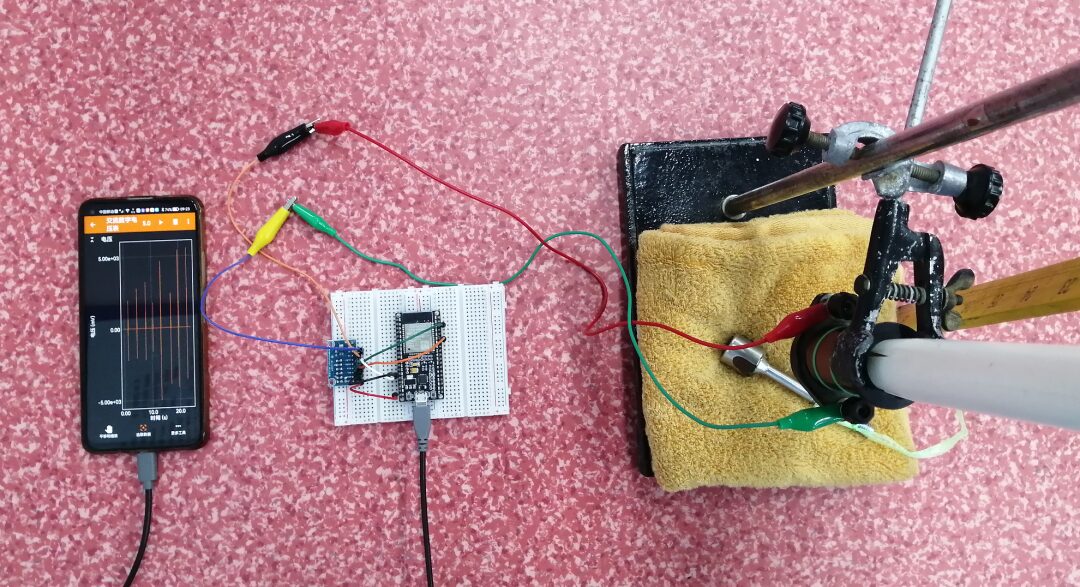
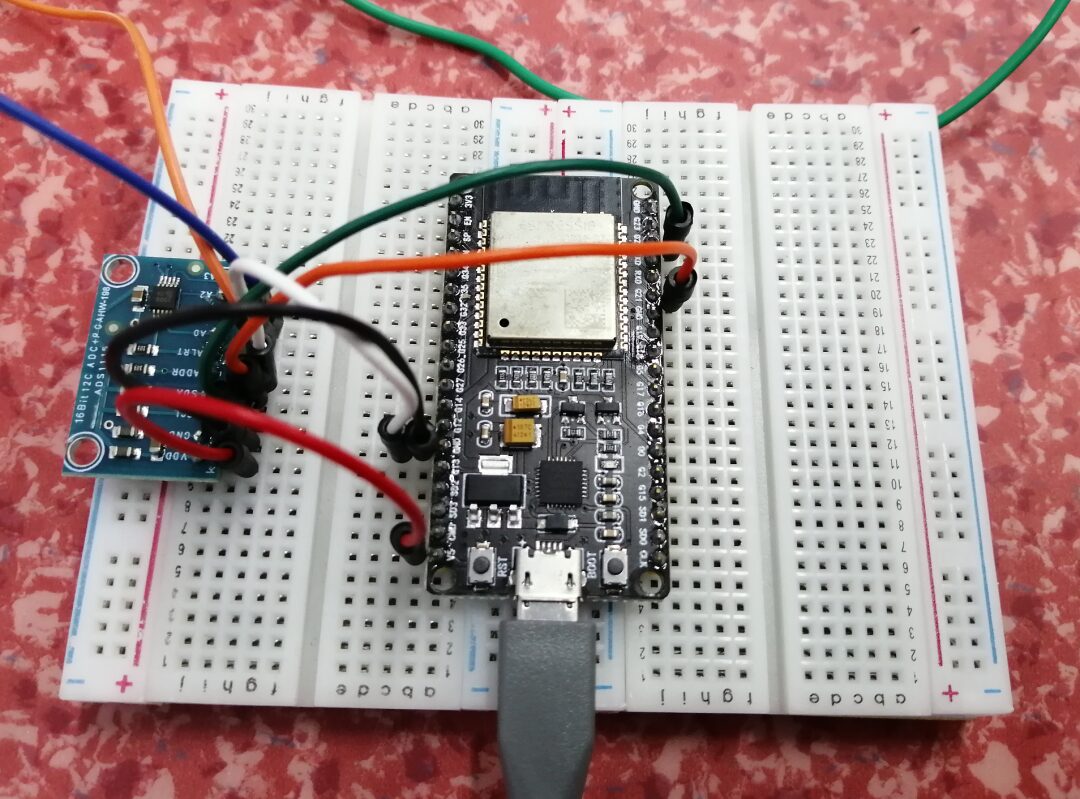
The equipment used in this experiment includes a tube, coil, iron frame, ruler, towel, magnet, fine string, breadboard, ESP32 IoT development board, ADS1115 AC module, and a smartphone loaded with Phyphox.
In the experiment, I adopted a timed running mode, with a 5-second delay before starting each experiment, and the program runs for 3 seconds before automatically pausing to allow time for locating, measuring, and releasing the magnet’s height. Then, I gradually increased the height from which the magnet is released in increments of 10 centimeters, using the combination of Phyphox, ESP32, and ADS1115 to capture the peak value of the induced current.
As the experiment progressed, a very interesting curve gradually appeared on the smartphone screen, which closely matched the experimental expectations. However, two sets of data were clearly deviating, which was due to the sampling frequency of the Phyphox, ESP32, and ADS1115 combination being insufficient to capture the true peak values of the induced current.
After the experiment, I tapped the “Data Acquisition” button on the smartphone screen to obtain the peak values of the induced current in the coil when the magnet was released from different heights, and plotted a scatter plot with the drop height of the magnet on the x-axis and the peak value of the induced current on the y-axis to obtain the relationship curve.
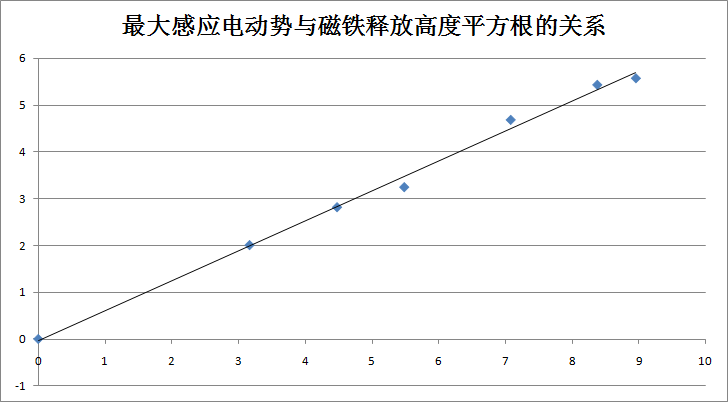
It was observed that the overall distribution of the data points was very regular, resembling a parabola opening to the right. Following the principle of transforming curves into straight lines in data processing, I removed two data points that deviated too much from the overall trend. By taking the square root of the drop height of the magnet as the x-axis and the peak value of the induced current as the y-axis, I plotted a scatter plot to obtain the relationship curve between the peak value of the induced current and the square root of the drop height of the magnet.
Performing linear fitting on this curve revealed a very obvious proportional relationship. The experimental conclusion closely matched the experimental expectations.
Although this curve represents the relationship between the peak value of the induced current and the square root of the drop height of the magnet, it also reflects the relationship between the peak value of the induced current and the speed of the magnet passing through the coil, as well as the relationship between the peak value of the induced current and the maximum rate of change of the magnetic flux in the coil.
4 Experimental Conclusion
With the aid of a current sensor, IoT development board, and smartphone, the method of dropping a magnet was used to obtain a proportional relationship between the peak value of the induced current and the maximum rate of change of the magnetic flux in the coil.
For such fleeting AC signals, it is almost impossible to capture them using traditional DC meters, as the maximum value of a DC meter is not the peak value of an AC signal.
The best method for such fleeting AC signals is to use a current (or voltage) sensor with a relatively high sampling frequency to dynamically plot the image of the AC signal and measure the peak value of the AC signal.
Pursuing perfection is a kind of affliction, and having this affliction is quite beneficial. I am troubled by the two data points that deviated significantly from the overall trend during the experiment, and I must find a way to eliminate them quickly.