Abstract: In order to solve the problem of difficulty in obtaining braking parameters of vehicles during driving, an automotive braking parameter acquisition and monitoring system has been developed based on a hardware detection unit and LabVIEW virtual instruments. The hardware part of the system consists of a Global Positioning System (GPS) navigation module and a designated parameter detection device. The software part developed based on LabVIEW consists of three parts: data acquisition terminal, server, and client. Using the Transmission Control Protocol (TCP) network communication protocol, real-time collection, storage, remote monitoring, and online analysis of vehicle location information, operating speed, braking behavior data, and vehicle longitudinal deceleration data during driving are achieved. The results of real vehicle tests indicate that the system is easy to program and operate, cost-effective, highly extensible, and safe and reliable. This system can achieve data acquisition and remote monitoring of braking parameters during vehicle driving, providing data support for related research.
The braking parameters of vehicles during driving hold significant theoretical research significance. The braking system plays an important role in the driving safety of vehicles[1]. Collecting braking parameters during vehicle operation and studying the braking behavior characteristics of drivers can effectively reduce the occurrence of rear-end collisions[2,3]. In terms of braking intention recognition, real-time monitoring of vehicle braking parameters can effectively identify the driver’s braking intention[4]. In emergency braking situations, shortening the response time of the vehicle’s braking assistance system ensures the application of maximum braking deceleration to reduce the braking distance during emergencies[5]. Timely recognition and information transmission of braking intention and intensity can effectively reduce the safety distance between vehicles[6], improve road operation efficiency, and effectively reduce the braking reaction time of following vehicles, enhancing driving safety[7]. Analyzing the variation characteristics of braking parameters on normal roads and different icy and snowy roads, based on the changes of various parameters to infer road conditions, combined with vehicle positioning information, can achieve high-precision urban road condition determination[8,9]. Therefore, developing an automotive braking parameter acquisition and information release system that is easy to program and operate, cost-effective, highly extensible, safe, and reliable, and conducting mathematical model research on relevant algorithms combined with real vehicle data can theoretically establish a relatively accurate, simple, applicable, and complete mathematical model. The intelligent control system can then align with the actual situation of the vehicle, ultimately better integrating real-time vehicle conditions into applications.
However, the difficulty in obtaining braking parameters of vehicles during driving is mainly due to the fact that most onboard diagnostics (OBD) data packets from manufacturers do not include brake pedal data. Moreover, obtaining brake pedal displacement through contact sensors can affect the driver’s operation. On the upper computer side, data acquisition cards or other data acquisition software are expensive and not easy to redevelop. Therefore, developing an automotive braking parameter acquisition and monitoring system that is easy to program and operate, cost-effective, highly extensible, and safe and reliable holds significant scientific and commercial value.
This paper proposes a set of automotive braking parameter acquisition and monitoring systems based on hardware detection units and LabVIEW virtual instruments to address the difficulty in obtaining braking parameters during vehicle driving. The hardware part of the system consists of a GPS navigation module and a designated parameter detection device. The software part developed based on LabVIEW consists of three parts: data acquisition terminal, server, and client, which can achieve real-time collection, storage, and online analysis of vehicle location information, operating speed, braking behavior data, and vehicle longitudinal deceleration data during driving. The system also enables remote data transmission based on TCP network communication technology, allowing for remote monitoring on the client side.
Figure 1 System Structure
1 System Structure and Requirements
The overall structure of the system is shown in Figure 1. The hardware part of the platform consists of a GPS navigation module and a designated parameter detection device. The software part developed based on LabVIEW consists of three parts: data acquisition terminal, server, and client, which can achieve real-time collection, storage, and online analysis of vehicle location information, operating speed, braking behavior data, and vehicle longitudinal deceleration data during driving. The system also enables remote data transmission based on TCP network communication technology, allowing for remote monitoring on the client side, providing data support for related research.
2 Hardware Platform Composition
The hardware platform of the system consists of a braking parameter acquisition device and a NEO-6M UBLOX GPS receiver, as shown in Figure 2.
Figure 2 Hardware Platform
The braking parameter acquisition device consists of a control unit, GP2Y0A51SK0F photoelectric distance sensor, acceleration sensor, power supply unit, and other auxiliary circuits. The control unit is composed of an AVR microcontroller and peripheral circuits such as crystal oscillator circuits and reset circuits, and the power supply unit consists of a DC/DC converter PS5101 and a linear voltage regulator chip AMS1117-3.3, which can provide two voltages of 5V and 3.3V.
The GP2Y0A02YKOF distance sensor is placed under the brake pedal. The microcontroller reads the changes in the light intensity signal reflected from the brake pedal through the A/D conversion circuit, converting it into changes in electrical signals to measure the displacement and rate of displacement of the brake pedal. Since this sensor is a non-contact sensor, the entire measurement process does not affect the driver’s operation.
The acceleration sensor uses a high-precision inertial navigation module JY-901, with an acceleration detection range of ±16g, a resolution of 6.1×10^-5 g, stability of 0.01g, and a data output frequency of 0.1–200 Hz, offering good stability and data transmission rates. The module communicates with the control unit via I²C bus. Finally, the control unit transmits the data from the acquisition device to the PC for subsequent processing via USART communication mode.
3 Software Implementation of the Measurement and Control System
3.1 LabVIEW Serial Communication
LabVIEW communicates with serial interface instruments through VISA (Virtual Instrument Software Architecture). VISA is a standard I/O application programming interface (API) used for instrument programming[10]. VISA automatically calls the corresponding interface driver routine according to the actual interface type[11], facilitating communication between the upper-level application program and the bus instruments.
The complete communication process is as follows: First, configure the serial port resources such as serial port number, baud rate, stop bits, data bits, and parity using the “VISA Configure Serial Port” function. Next, use the “VISA Write” function to send commands to the serial port or the “VISA Read” function to receive data from the serial port. Finally, use the “VISA Close” function to close the serial port resources, completing the serial communication (Figure 3).
Figure 3 VISA Communication Process
3.2 Braking Parameter Analysis
The structure of the brake pedal is shown in Figure 4. Let the length from the center of rotation of the brake pedal to the upper edge of the pedal be the radius of rotation R, and choose the direction of the radius R when the brake pedal is stationary without external force as the initial direction. The moved radius R intersects the upper edge of the pedal reflection surface at point A, and then the projection point B on the car floor perpendicular to the direction of R is made through this point. The installation plate for the distance sensor is installed at point A. During the actual vehicle installation, the overall device will be mounted on the vehicle chassis with a mounting plate that has a bracket. The bracket has a certain height so that when the brake pedal is pressed to its maximum displacement, the distance sensor is 3-5 cm away from the pedal position, and the inclination of the plate must ensure that the emitted light from the distance sensor is perpendicular to the direction of radius R when the pedal is stationary, meaning the mounting plate is parallel to the direction of radius R when the pedal is stationary, and point B is the projection point on the mounting plate for the sensor’s position.
 Figure 4 Brake Pedal Structure
In the unloaded state, the direction of the signal emitted by the distance sensor is perpendicular to the axis radius direction of the pedal. During braking, when the brake pedal moves from its initial position to a certain position, as indicated by the dashed line in Figure 4, the measurement direction of the sensor remains unchanged, allowing for specific calculations of the brake pedal displacement and rate of displacement as follows.
Let the distance detected by the distance sensor at the initial position of the brake pedal be xmax, and the distance detected when the brake pedal is fully loaded be xmin. The angle between the direction of the brake pedal’s rotation radius and the initial rotation radius direction is θ0. When the distance measured by the distance sensor is x, the angle between the direction of the brake pedal’s rotation radius and the initial rotation radius direction is θ. The angle bisector OB of ∠OAC forms an angle α with OA. According to geometric principles, we have:
From equations (1) to (3), we can obtain:
In the formulas, R, xmax, and xmin can be directly obtained as known quantities in practical applications. By using equation (5), the displacement of the brake pedal can be expressed in terms of the rotation angle of the pedal.
The rate of displacement S1 of the brake pedal can be expressed as
The data acquisition time interval ΔT for the sensor is 50 ms, thus the change rate S2 of pedal displacement can be expressed as
Let the longitudinal deceleration detected by the acceleration sensor be a, and the longitudinal deceleration of the vehicle in a non-powered, non-braking state be ax0. Then the braking deceleration as during the braking process can be expressed as
Figure 4 Brake Pedal Structure
In the unloaded state, the direction of the signal emitted by the distance sensor is perpendicular to the axis radius direction of the pedal. During braking, when the brake pedal moves from its initial position to a certain position, as indicated by the dashed line in Figure 4, the measurement direction of the sensor remains unchanged, allowing for specific calculations of the brake pedal displacement and rate of displacement as follows.
Let the distance detected by the distance sensor at the initial position of the brake pedal be xmax, and the distance detected when the brake pedal is fully loaded be xmin. The angle between the direction of the brake pedal’s rotation radius and the initial rotation radius direction is θ0. When the distance measured by the distance sensor is x, the angle between the direction of the brake pedal’s rotation radius and the initial rotation radius direction is θ. The angle bisector OB of ∠OAC forms an angle α with OA. According to geometric principles, we have:
From equations (1) to (3), we can obtain:
In the formulas, R, xmax, and xmin can be directly obtained as known quantities in practical applications. By using equation (5), the displacement of the brake pedal can be expressed in terms of the rotation angle of the pedal.
The rate of displacement S1 of the brake pedal can be expressed as
The data acquisition time interval ΔT for the sensor is 50 ms, thus the change rate S2 of pedal displacement can be expressed as
Let the longitudinal deceleration detected by the acceleration sensor be a, and the longitudinal deceleration of the vehicle in a non-powered, non-braking state be ax0. Then the braking deceleration as during the braking process can be expressed as
3.3 GPS Data Analysis
The Global Positioning System (GPS) consists of three elements: GPS terminal, transmission network, and monitoring platform, which can provide users with vehicle positioning, anti-theft, anti-hijacking, driving route monitoring, and command calling functions[12]. This system uses the GPRMC positioning statement to obtain positioning and speed information. The structure of the “$GPRMC” positioning statement is as follows: $GPRMC, hhmmss.sss, A/V, mmmm.mmmm, N/S, nnnn.nnnn, W/E, XXX.X, YYY.Y, DDMMYY,,, A/D/E/N*60. Among them, “hhmmss.sss” is the UTC time; “A/V” indicates valid/invalid positioning; “mmmm.mmmm” is latitude; “nnnn.nnnn” is longitude; “XXX.X” is speed; “DDMMYY” is the UTC date.
The program collects 1 Hz “$GPRMC” data, and the data processing module uses string functions provided by LabVIEW to determine the “$GPRMC” string, then parses the NMEA positioning statement sentence by sentence, including time, latitude, longitude, and speed. The GPS data parsing process is shown in Figure 5, and the parsing program is shown in Figure 6.
Figure 5 GPS Data Parsing Process
3.4 Data Storage Unit
The data storage program uses an electronic spreadsheet file to record the monitored data in real time, as shown in Figure 7.
Figure 7 Data Storage Process
The basic flow of the data storage unit is to open an existing file in “.csv” format or create a new “.csv” format file, storing the data uploaded from the GPS receiver and the braking parameter acquisition device in pre-set arrays. Once a set of data is fully stored in the array, the data is written to the spreadsheet. This subroutine is placed in a while loop with a 200 ms delay, achieving data listening every 200 ms. By changing the preset delay time, the data recording frequency can be adjusted. The data storage program is shown in Figure 8.
Figure 8 Data Storage Program
3.5 TCP Network Communication
TCP (Transmission Control Protocol) is a connection-oriented, reliable, byte-stream-based transport layer communication protocol. A complete TCP transmission system consists of a server and a client[13]. The server listens via an IP address and port number or hostname, waiting for the client to connect with the server. The client requests a connection based on the host’s IP address and port number. After establishing a connection between the server and client, TCP data communication is performed through read and write functions.
The TCP communication process based on LabVIEW starts with the server establishing listening through the “TCP Listen” function, setting the timeout, port number, and IP address, allowing for subsequent TCP function connections. The “Write TCP Data” function is used to send the data frame to the client program. First, the byte count of the message content is sent, followed by the actual content string data. The TCP server program is shown in Figure 9.
In the client, the “Open TCP Connection” function is called to connect with the server, setting the same IP address and port number as the server, then using the “Read TCP Data” function to read the data sent by the server program. Once the data is read, the “Close TCP Connection” function is called to exit the program. The TCP client program is shown in Figure 10.
Figure 9 TCP Server Program
Figure 10 TCP Client Program
Figure 11 Upper Computer Interface
4 Real Vehicle Test
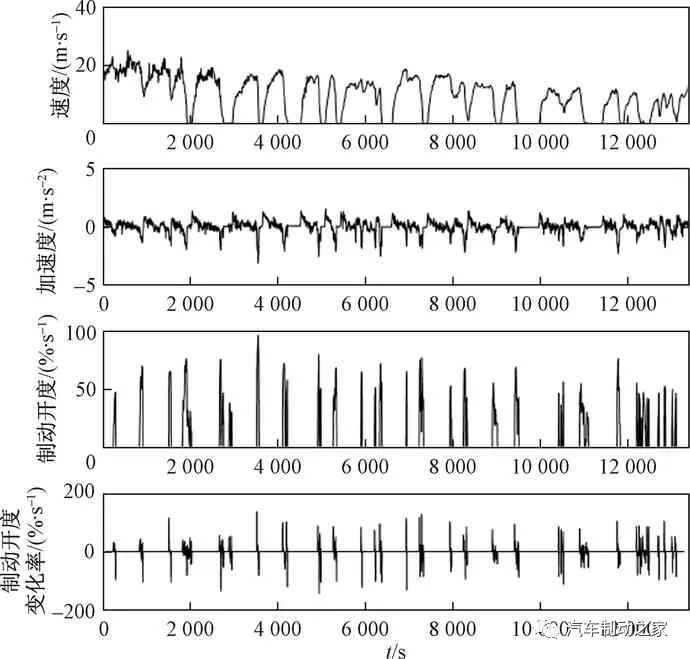
The real vehicle test was conducted on the section from Baibohang to Daqing West Station along Tieren Avenue in Daqing City, with a total of 34 braking actions throughout the test. The data sampling frequency was set to 10 Hz, and the collected data included latitude and longitude, operating speed, braking deceleration, brake pedal displacement, and brake pedal rate.
The upper computer interface is shown in Figure 11, where Figure 11(a) is the server and Figure 11(b) is the client. The installation positions of the test vehicle and test instruments are shown in Figure 12, where Figure 12(a) is the test vehicle, Figure 12(b) is the braking parameter detection device, and Figure 12(c) is the GPS receiver. The parameters related to the braking process are shown in Figure 13.
Figure 12 Real Vehicle Test
Figure 13 Braking Parameter
5 Conclusion
This paper proposes a set of automotive braking parameter acquisition and monitoring systems based on hardware detection units and LabVIEW virtual instruments to address the difficulty in obtaining braking parameters during vehicle driving. The hardware part of the system consists of a GPS navigation module and a designated parameter detection device. The software part developed based on LabVIEW consists of three parts: data acquisition terminal, server, and client, which can achieve real-time collection, storage, and online analysis of vehicle location information, operating speed, braking behavior data, and vehicle longitudinal deceleration data during driving. The system also enables remote data transmission based on TCP network communication technology, allowing for remote monitoring on the client side. Due to the use of virtual instruments for data acquisition, the system is easy to program and operate, cost-effective, highly extensible, and safe and reliable. The results of real vehicle tests indicate that the system can achieve data acquisition and remote monitoring of braking parameters during vehicle driving, providing data support for related research.
Authors: Li Hongtao, Ba Xingqiang
Northeast Forestry University, College of Transportation