
1.
In my previous article, I wrote an introduction to the ESP32, and I think it is necessary to write this article, which mainly focuses on analyzing core dumps. This is similar to crash analysis in Android and Linux systems; it is interesting yet challenging. When we write code, we inevitably encounter some core dump issues, and at that point, we need to analyze the reasons for the core dump. The same applies to the Linux kernel, where core dumps primarily print stack calls. By examining these stack call details, we can pinpoint the cause of the problem.
There are many articles online about analyzing core dumps, but they are mostly translations of official documentation without practical testing.
I believe the ESP32 has another advantage: it is incredibly convenient for beginners. A Linux development board might cost several hundred yuan, but an ESP32 module only costs about 40 yuan. It also runs the FreeRTOS system and is very portable. Debugging, programming, and powering can all be done with a single USB cable. Honestly, I am not being paid to promote this; it is genuinely suitable for students who are short on funds and want to get started with embedded systems. However, this is just the starting point; I believe that learning Linux is essential for embedded development later on.
2.
Core Dump Official Documentation
https://esp-idf-zh.readthedocs.io/zh_CN/latest/api-guides/core_dump.html
Save the Core Dump Log
sC4AAA4AAABkAQAA
fLr8P1Dx/T8U8/0/
gPH9P7Dy/T+suvw/xD/8P7jl/T98uvw/vD/8PxQAAAAAAAAAOGD8P3y6/D8AAAAA
BQAAABjn/T9wdGhyZWFkAAcAAFEFNFQA////fxTz/T8AAAAAIAsGAAUAAAAAAAAA
AAAAAAAAAAAAAAAAAJj8P2iY/D/QmPw/AAAAAAAAAAABAAAAAAAAAAhCQD8AAAAA
SB0AQAAAAAAAAAAAAAAAAAAAAAAAAAAAAAAAAAAAAAAAAAAAAAAAAAAAAAAAAAAA
AAAAAAAAAAAAAAAAAAAAAAAAAAAAAAAAAAAAAAAAAAAAAAAAAAAAAAAAAAAAAAAA
AAAAAAAAAAAAAAAAAAAAAAAAAAAAAAAAAAAAAAAAAAAAAAAAAAAAAAAAAAAAAAAA
AAAAAAAAAAAAAAAAAAAAAAAAAAAAAAAAAAAAAAAAAAAAAAAAAAAAAAAAAAAAAAAA
AAAAAAAAAAAAAAAAAAAAAAAAAAA=
hOkRgEoVDkAwBwYAsggOgBDy/T/ku/w/fLr8PwAAAAD/////AAAAAAAAAAAAAAAA
8PH9P+S7/D/ku/w/3OUTQAEAAAAhAAYABAAAAAgAAAAcAAAAAAAAAP0UAEANFQBA
........
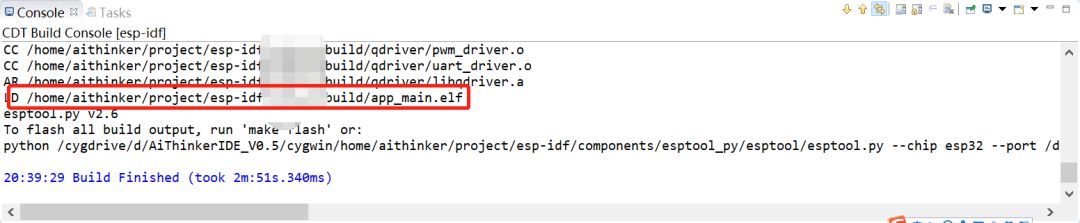
Flash the Corresponding ELF File to the Device
The ELF file is similar to the Vmlinux file on Linux. With this file, the dump information, and GDB, we can find the context code near the crash location. With the context code, as a diligent programmer, you will surely not miss any clues to find the bug.
The ELF file is generated during compilation, and each time we compile, we will have a different symbol table. Of course, when analyzing the core dump, the binary file flashed to the device and the ELF file must correspond; otherwise, the analysis results will be vastly different.
3. Execute the following command
The official website also has another command, but it always returns an error when run. If anyone knows the reason, please leave a comment to let me know. Thank you very much.
<span><span>./components/espcoredump/espcoredump.py dbg_corefile cat-wc/build/app_main.elf -c cat-wc/build/coredump.bin -t b64</span></span><span><span>espcoredump.py v0.1-dev</span></span>
$ ./components/espcoredump/espcoredump.py dbg_corefile cat-wc/build/app_main.elf -c cat-wc/build/coredump.bin -t b64espcoredump.py v0.1-devGNU gdb (crosstool-NG crosstool-ng-1.22.0-61-gab8375a) 7.10Copyright (C) 2015 Free Software Foundation, Inc.License GPLv3+: GNU GPL version 3 or later <http://gnu.org/licenses/gpl.html>This is free software: you are free to change and redistribute it.There is NO WARRANTY, to the extent permitted by law. Type "show copying"and "show warranty" for details.This GDB was configured as "--host=i686-build_pc-cygwin --target=xtensa-esp32-elf".Type "show configuration" for configuration details.For bug reporting instructions, please see:<http://www.gnu.org/software/gdb/bugs/>.Find the GDB manual and other documentation resources online at:<http://www.gnu.org/software/gdb/documentation/>.For help, type "help".Type "apropos word" to search for commands related to "word"...Reading symbols from cat-wc/build/app_main.elf...done.[New <main task>][New process 1][New process 2][New process 3][New process 4][New process 5][New process 6][New process 7][New process 8][New process 9][New process 10][New process 11][New process 12][New process 13][New process 14]#0 0x4012cbc3 in ledc_channel_config (ledc_conf=<optimized out>) at /cygdrive/e/AiThinkerIDE_V0.5/cygwin/home/aithinker/project/esp-idf/components/driver/ledc.c:328328 return ret;[Current thread is 1 (<main task>)](gdb)
Recommended Reading
I recommend a book by Mr. Zhou Lijun
A friend who left Huawei
Shares a very nice tool