Advanced Linux Operations: In-Depth Analysis from Basic Commands to System Optimization
Introduction: Have You Encountered These Crashing Moments?
At 2 AM, you are abruptly awakened by a phone call: “Online service response timeout, widespread user complaints!” You hurriedly open your computer, SSH into the server, and face a screen full of processes and logs, your mind blank—Where to start troubleshooting? What commands to use? How to quickly locate the problem?
If you have had similar experiences, or are struggling with “too many Linux commands to remember” or “not knowing where to start with system optimization,” then this article is prepared for you.
By the end of this article, you will gain:
- • 🔧 Advanced usage of 20 high-frequency operation commands (not just ls, cd, but practical tools like top -Hp, strace -c)
- • 📊 Optimization plans for 5 major system performance indicators (covering CPU, memory, disk I/O, network, and process management)
- • 🚀 3 real-world case studies from production environments (including complete troubleshooting processes and reusable scripts)
- • 💡 A system optimization checklist (directly usable for daily inspections and fault prevention)
1. Advanced Command Usage: From “Knowing How” to “Using Well”
1.1 The Three Musketeers of CPU Troubleshooting: top, htop, pidstat
Many people use <span>top</span> only to check CPU usage, but true experts use it like this:
Key Command 1: Locate the specific thread of a high CPU process
# First, find the PID of the high CPU process (assume it's 12345)
top -c

# View all thread CPU usage of that process
top -Hp 12345

# Convert thread ID to hexadecimal (for matching jstack output)
printf "%x\n" 12356  # Assume high CPU thread ID is 12356
Pitfall Experience: I once only looked at process-level CPU, and as a result, a Java application’s GC thread was consuming CPU crazily without me noticing, leading to 3 hours of troubleshooting.Correct Approach: always use <span>-Hp</span> to view thread-level details.
Key Command 2: Real-time monitoring of resource consumption for a specified process
# Refresh detailed resource usage of PID 12345 every 2 seconds
pidstat -u -r -d -t -p 12345 2

# Parameter explanation:
# -u: CPU usage statistics
# -r: memory usage statistics
# -d: disk I/O statistics
# -t: display thread-level information
1.2 Advanced Memory Troubleshooting: Not Just free -h
Key Command 3: Accurately locate memory leak processes
# View process memory mapping to find abnormal memory growth segments
pmap -x 12345 | tail -5

# Continuously monitor memory growth trend (record every 5 seconds)
while true; do
    date >> mem_monitor.log
    ps aux | grep 12345 | grep -v grep >> mem_monitor.log
    sleep 5
done
Blood and Tears Lesson: Once, a Node.js application had a slow memory leak, and using <span>free -h</span> only showed total memory decreasing, but I didn’t know which process was causing it. Later, I used <span>smem -rs swap -p</span> to sort by swap usage, and immediately located the problematic process.
1.3 In-Depth Analysis of Disk I/O: Advanced Usage of iotop
Key Command 4: Identify hidden I/O killers
# Real-time display of disk read/write speed for each process
iotop -oP -d 2

# Parameter explanation:
# -o: only show processes with I/O activity
# -P: only show processes, not threads
# -d 2: refresh every 2 seconds

# View detailed I/O information of a specific process
cat /proc/12345/io
Practical Tip: MySQL database suddenly slowed down, CPU and memory were normal, and finally found that log file writing caused disk I/O saturation.Solution: Change <span>innodb_flush_log_at_trx_commit</span> from 1 to 2, improving write performance by 5 times.
2. System Optimization in Practice: From Principles to Implementation
2.1 CPU Optimization: Not Just Adjusting Nice Values
Optimization Plan 1: CPU Affinity Binding
# Bind nginx worker processes to specified CPU cores
# Add to nginx.conf:
worker_processes 4;
worker_cpu_affinity 0001 0010 0100 1000;

# Verify binding effect
taskset -cp $(pgrep nginx)
Why Do This: To avoid frequent switching of processes between CPU cores, reducing L1/L2 cache misses, which can improve performance by 15% in practice.
Optimization Plan 2: Interrupt Load Balancing
# Check current interrupt distribution
cat /proc/interrupts

# Bind network card interrupts to specific CPU
echo 2 > /proc/irq/24/smp_affinity  # 24 is the network card interrupt number
2.2 Memory Optimization: Scientific Configuration is Key
Optimization Plan 3: Reasonable Swappiness Setting
# Check current value
cat /proc/sys/vm/swappiness

# Temporarily modify (will not persist after reboot)
echo 10 > /proc/sys/vm/swappiness

# Permanent modification
echo "vm.swappiness = 10" >> /etc/sysctl.conf
sysctl -p
Parameter Selection Experience:
- • Database Server: Set to 1-10 (prefer physical memory)
- • Application Server: Set to 30-60 (balance memory and swap)
- • Personal Desktop: Keep default 60
Pitfall Reminder: Do not set to 0! Once, in an attempt to “optimize performance,” I set it to 0, resulting in OOM killing core processes when memory was insufficient.
2.3 Network Optimization: Enhancing Concurrent Connection Capacity
Optimization Plan 4: TCP Parameter Tuning
# Optimize TCP connection queue
echo 'net.core.somaxconn = 65535' >> /etc/sysctl.conf
echo 'net.ipv4.tcp_max_syn_backlog = 8192' >> /etc/sysctl.conf

# Optimize TIME_WAIT state handling
echo 'net.ipv4.tcp_tw_reuse = 1' >> /etc/sysctl.conf
echo 'net.ipv4.tcp_tw_recycle = 0' >> /etc/sysctl.conf  # Note: Do not enable!

# Take effect immediately
sysctl -pNotes:<span>tcp_tw_recycle</span><span> will cause connection issues in NAT environments, </span><strong><span>absolutely do not enable in production environments!</span></strong>
3. Real-World Case Studies: Complete Fault Troubleshooting Process
Case 1: Mysterious 100% CPU Usage with No High CPU Process Found
Fault Phenomenon: Monitoring shows CPU usage at 100%, but the top command does not show any high CPU process.
Troubleshooting Process:
# Step 1: Check for hidden processes
ps aux | awk '{print $3}' | sort -rn | head -10

# Step 2: Check kernel threads
ps aux | grep "\[.*\]"

# Step 3: Check I/O wait (found wa value abnormally high)
top
# Display: Cpu(s): 2.0%us, 3.0%sy, 0.0%ni, 0.0%id, 94.0%wa

# Step 4: Locate I/O bottleneck process
iotop -oP
# Found that the rsync backup process was causing it
Root Cause: A scheduled backup script using rsync to sync a large number of small files caused high I/O wait, making CPU appear at 100% but actually waiting for I/O.
Solution:
- 1. Change rsync to incremental backup:
<span>rsync -avz --delete</span> - 2. Limit rsync bandwidth:
<span>--bwlimit=10240</span>(limit to 10MB/s) - 3. Adjust backup time to off-peak business hours
Case 2: Chain Reaction Caused by Memory Leak
Complete Troubleshooting Script (can be used directly):
#!/bin/bash
# File name: check_memory_leak.sh
# Function: Automatically detect processes that may have memory leaks

echo "=== Memory Leak Detection Script ==="
echo "Monitoring memory usage for 60 seconds..."

# Create temporary file
tmpfile=$(mktemp)

# First sampling
ps aux --sort=-%mem | head -20 | awk '{print $2,$4,$11}' > $tmpfile.1

# Wait for 60 seconds
sleep 60

# Second sampling
ps aux --sort=-%mem | head -20 | awk '{print $2,$4,$11}' > $tmpfile.2

echo -e "\n=== Processes with significant memory growth ==="
echo "PID    MEM_BEFORE  MEM_AFTER  GROWTH  COMMAND"

# Compare the results of the two samplings
while read pid mem1 cmd1; do
    mem2=$(grep "^$pid " $tmpfile.2 | awk '{print $2}')
    if [ ! -z "$mem2" ]; then
        growth=$(echo "$mem2 - $mem1" | bc)
        if (( $(echo "$growth > 0.5" | bc -l) )); then
            printf "%-6s %-10s %-10s %-7s %s\n" \
                   "$pid" "$mem1%" "$mem2%" "+$growth%" "$cmd1"
        fi
    fi
done < $tmpfile.1

# Clean up temporary files
rm -f $tmpfile*

echo -e "\n=== Recommendation ==="
echo "For suspicious processes, use: pmap -x PID"
echo "Or check memory maps: cat /proc/PID/smaps
Usage Instructions:
chmod +x check_memory_leak.sh
./check_memory_leak.sh
4. System Optimization Checklist (Directly Usable for Daily Inspections)
Daily Check Items
- • CPU Load:
<span>uptime</span>Check 1/5/15 minute load, not exceeding 0.7 times the number of CPUs - • Memory Usage:
<span>free -h</span>Ensure available memory > 20% - • Disk Space:
<span>df -h</span>Ensure all partitions usage < 80% - • Key Processes:
<span>systemctl status nginx/mysql/redis</span>Ensure services are running normally
Weekly Optimization Items
- • Log Cleanup:
<span>find /var/log -name "*.log" -mtime +30 -exec rm {} \;</span> - • Check Zombie Processes:
<span>ps aux | grep defunct</span> - • Analyze Slow Queries: Check MySQL slow query log
- • Update System:
<span>yum update --security</span>or<span>apt-get upgrade</span>
Monthly Deep Optimization
- • Disk Defragmentation:
<span>e4defrag /dev/sda1</span>(ext4 file system) - • TCP Connection Analysis:
<span>ss -s</span>Check connection status distribution - • Kernel Parameter Review: Check against best practices in
<span>/etc/sysctl.conf</span>
Conclusion: From Passive Firefighting to Proactive Defense
By mastering this set of **”Command Advancement + Optimization Plans + Troubleshooting Scripts”** combination, you can transform from a passive “firefighter” to a proactive “system architect.” Remember:Excellent operations do not mean no faults, but the ability to detect signs before faults occur and quickly recover when they do.
💬 Interactive Topic: What is the most challenging performance issue you have encountered in a production environment? How long did it take to resolve? Feel free to share your “operations horror story” in the comments!
End of Article Benefits
Currently, the traditional operations transformation direction that impacts an annual salary of 300,000+ is SRE & DevOps positions. To help everyone get rid of tedious grassroots operations work as soon as possible, I have compiled a set of essential skills resource package for senior operations engineers, see the image for detailed content! It includes 20 modules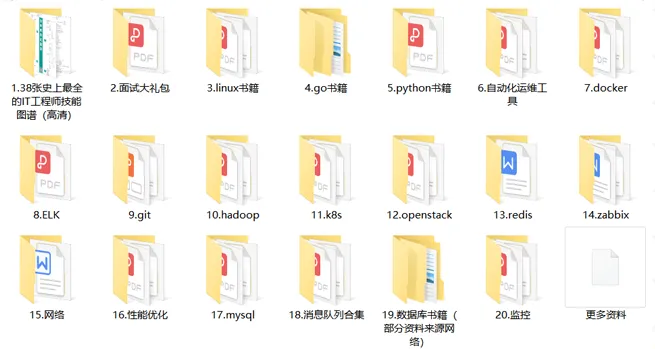 1.38 Most Comprehensive Engineer Skill Map
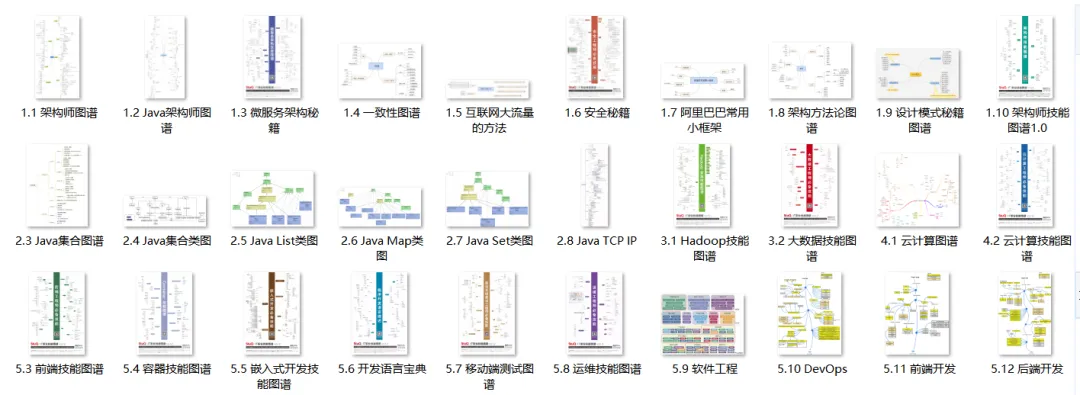 2. Interview Gift Package
 3. Linux Books
 4. Go Books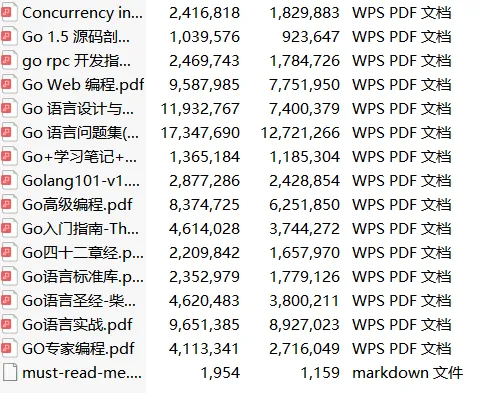
······
6. Automation Operations Tools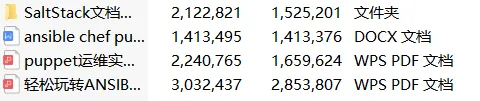 18. Message Queue Collection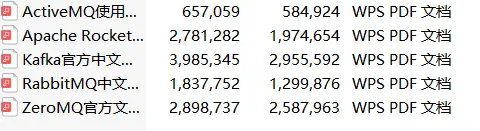

All materials can be obtained by scanning the code
Note: Latest Operations Materials
100% Free to Claim
(No further replies in the background, scan to claim with one click)