CLion Tutorial – Debugger Console & Attach to Process

CLion Tutorial - Debugger Console & Attach to Process

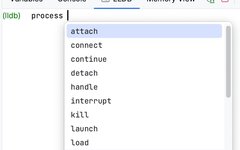
The debugger console allows you to directly access the GDB/LLDB console from CLion during a debugging session. The debugger console is only available when the program is paused. Open the tab marked LLDB or GDB in the debugging tool window: This tab shows the debugger's output/error stream and allows you to run GDB/LLDB commands. 👇 … Read more

Microcontroller Running Abnormally? Check These Items

Microcontroller Running Abnormally? Check These Items

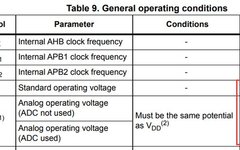
Power Supply: If the microcontroller is having issues, first check the power supply. There may be a problem with the power supply. Use a multimeter to check the power supply voltage of the microcontroller; it is best to use an oscilloscope to capture the voltage waveform because the voltage may be unstable (for example, voltage … Read more

Differences Between SWD and JTAG Debug Interfaces

Differences Between SWD and JTAG Debug Interfaces

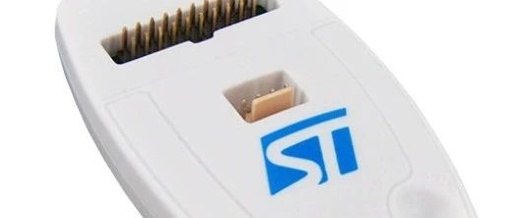
As an embedded engineer, you should know about download debuggers, but do you really understand the meaning and differences between the SWD and JTAG interfaces? 01 What is a Download Debugger In simple terms, a download debugger is a device that converts commands sent from a PC (for example, via USB protocol) into a language … Read more