Problem Statement
Hello, Teacher Zhuo. I observed a strange phenomenon while testing my new motor driver with the oscilloscope:
1. When I set the oscilloscope to a time base on the same order of magnitude as the PWM period, I could measure a standard PWM waveform. However, when I increased the time base, I noticed a magical waveform appearing every 25ms, which resembled the PWM waveform (the image shows a 40% duty cycle) with a period of 7.5ms.
2. Moreover, when I changed the duty cycle and PWM frequency, this 7.5ms signal persisted with a constant period. Why is that?
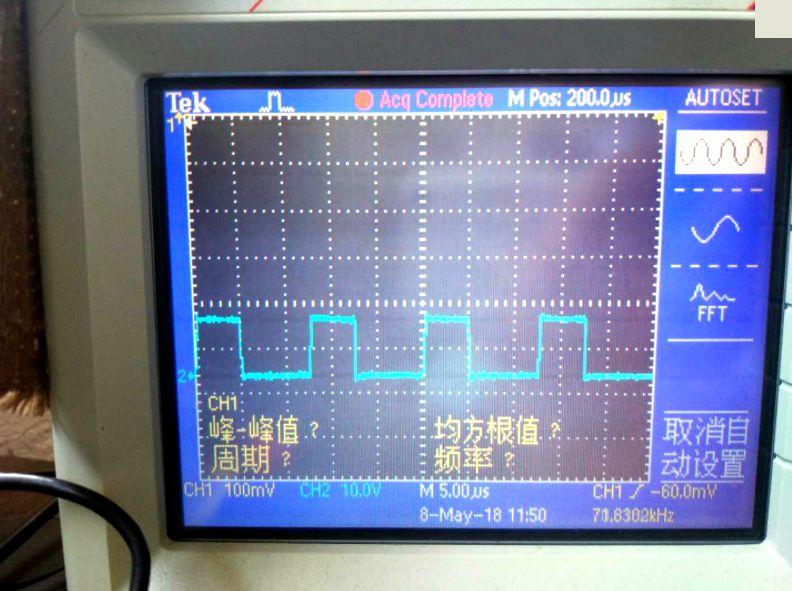
Oscilloscope scanning speed set to 5us/div to display waveform | Image from WeChat Official Account
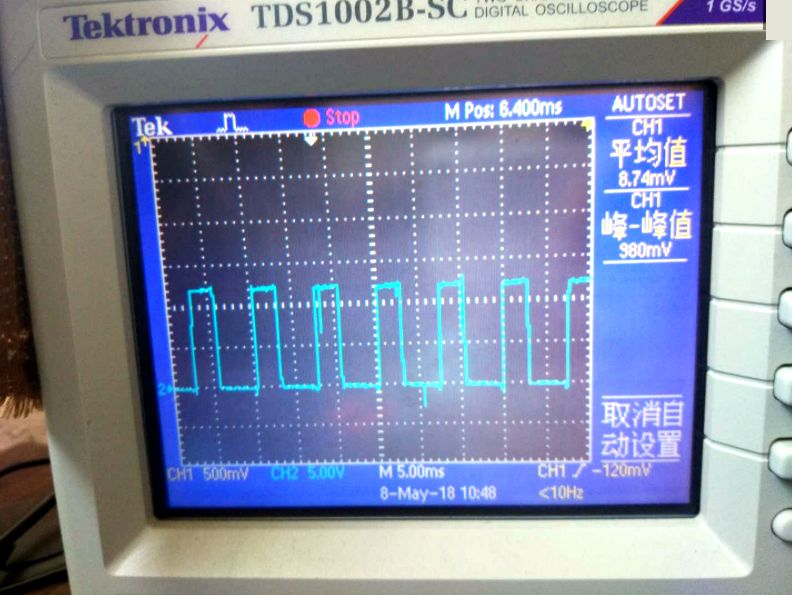
Oscilloscope scanning speed set to 5ms/div to display waveform | Image from WeChat Official Account
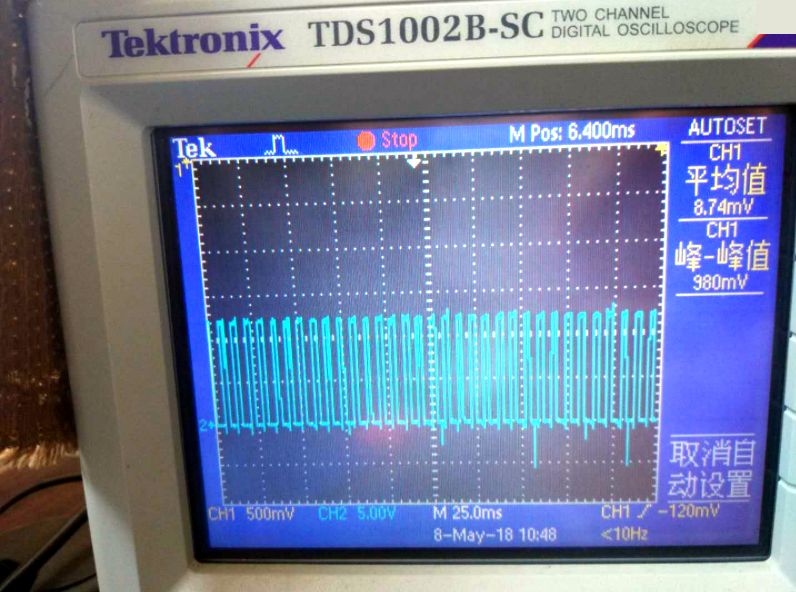
Oscilloscope scanning speed set to 25ms/div to display waveform | Image from WeChat Official Account
During the process of making and debugging electronic modules, one might encounter some strange situations, which can baffle some students. There might be two reasons behind this: one is that the new knowledge hidden behind complex phenomena has not been learned yet; the other is carelessness.
Principle Analysis
1. Digital Oscilloscope
The oscilloscope is a powerful device for observing one-dimensional dynamic signals. It can vividly illustrate the time-domain waveform characteristics of signals. Compared to data recorders that use mechanical structures to record signal waveforms, oscilloscopes that use electronic systems to display signals can accurately show waveforms over a wide frequency range.
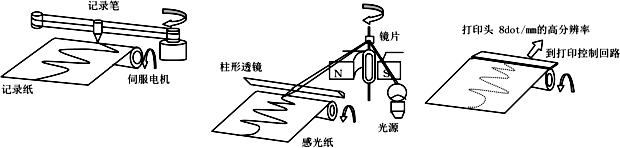
Mechanical data recorder | Image from the internet
Oscilloscopes have evolved from early analog oscilloscopes using cathode ray tubes (CRT) to modern digital oscilloscopes, greatly enhancing their functionality and performance. However, one issue introduced by digital oscilloscopes is the phenomenon of undersampling.

Analog oscilloscope | Image from the internet
Digital oscilloscopes use high-speed ADCs to convert the amplified observed electrical signals from analog to digital, and then plot them on the LCD screen. Because of the added signal sampling stage, this not only may cause loss of signal information but, more importantly, can introduce false information. This will be discussed in more detail in the subsequent signal sampling section.
False signals can lead observers to confusion and misjudgment. To avoid this situation, one must choose the fastest possible scanning speed and enable the anti-aliasing filter in the oscilloscope to eliminate it.
2. Signal Sampling and Frequency Aliasing
Sampling signals is a necessary step for processing analog signals with digital computers, resulting in discrete waveforms. When periodic signals are sampled, a special sequence waveform appears that changes periodically as the frequency of the sampled signal increases. The following diagram shows the sequence waveform formed by sampling a cosine signal at an interval of 1. As the frequency of the cosine signal changes from 0 to 2π, the captured sequence waveform completes a cycle. This indicates that high-frequency signals, after discretization, can actually form low-frequency sequence waveforms.
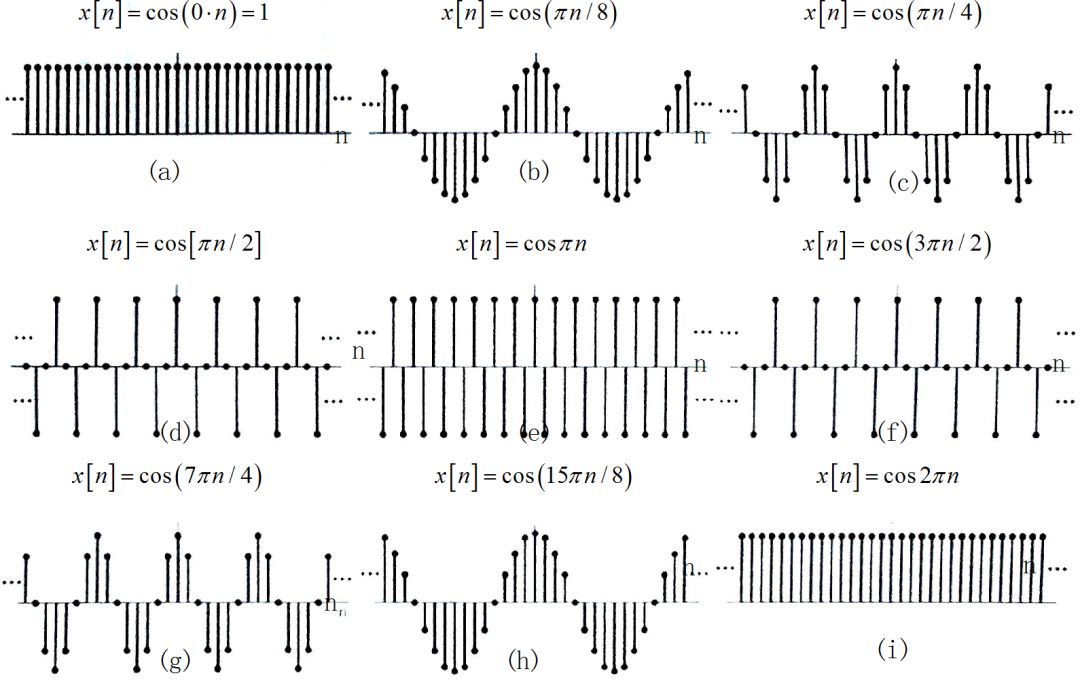
The periodic change of the discrete sequence waveform as frequency increases
The description of the above phenomenon can also be explained using Fourier transform analysis of the frequency spectrum of discrete signals. That is, after discretization, the corresponding frequency spectrum undergoes periodic extension. As the sampling frequency varies, the frequency components that were originally in the high-frequency band appear in the low-frequency band due to spectrum shifting. This situation is known as frequency aliasing. The corresponding time-domain waveform is a high-frequency signal that, after sampling, forms a low-frequency sequence waveform, which is the false aliased signal that appears.
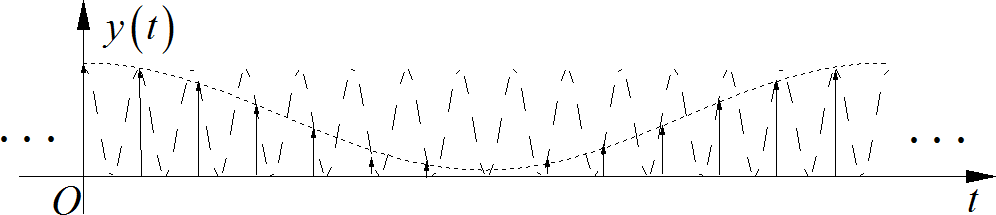
High-frequency signal forming a low-frequency sequence after sampling
Avoiding the generation of such aliased signals requires that the sampling frequency is greater than twice the highest frequency of the signal. If the sampling frequency is less than twice the highest frequency of the signal, it is termed undersampling.
3. Video and 2D Signal Acquisition
Whether it is film-recorded video or digitally captured video, both sample two-dimensional image information at a certain frame rate, forming a sequence of discrete time images. Thus, frequency aliasing can also occur during this process, which can produce some unexpected effects: objects that are originally in high-speed periodic motion (rotation, vibration) may appear stationary or slowly moving at a certain shooting frequency. This phenomenon allows for easy observation of the details of high-speed periodic motion.
At the end of this article, we have compiled some dynamic images related to this aspect, focusing on the experimental demonstration section.
Film recording video | Image from the internet
Problem Explanation
So far, it can be seen that the oscilloscope displays the same PWM waveform at different scanning speeds, resulting in two different frequency signals. This phenomenon arises because of the frequency aliasing that occurs during the signal sampling stage of the digital oscilloscope, which means that the originally high-frequency PWM signal has been captured as a low-frequency PWM signal.
Frequency aliasing phenomena often occur in regular signal measurements. It has also been introduced in previous articles:
A. Is the signal normal?
B. About the smart car competition – the beacon task.
The following video is from students participating in the beacon group competition, showing the actual measured video. The originally 10Hz blinking beacon light appears to blink very slowly to the camera, which is also a false signal formed by signal sampling.
Video recorded by beacon group students | Video from participating team members
Experimental Demonstration
The principle of frequency aliasing in signal sampling – undersampling is very simple. To leave a deeper impression on everyone and help them recognize this phenomenon in the future, we have compiled some dynamic images reflecting signal undersampling:
Fast blinking digital tube appears to blink slowly in the video

High-speed rotating helicopter blades appear stationary in the video
Strobe lights are devices that can emit periodic pulse light. Through this periodic pulsed light, the human eye perceives the illuminated scene as a sampled two-dimensional signal. The following dynamic images show the periodic motion observed under strobe lights.

Water droplets suspended in the air
Slowly falling water droplets
Drill bits rotating in both directions
Fan illuminated by iPhone strobe light
The following shows the periodic motion phenomenon observed in the video.
With varying rotation speeds of the ring, the video shows alternating images of clockwise and counterclockwise rotation
High-speed rotating drill bits appear to rotate slowly in the video
High-frequency vibrating liquid surface appears to change slowly in the video
Continuously scanned waveforms appear as slowly moving spots in the video

The same disc captured shows both clockwise and counterclockwise rotation simultaneously
Extended Discussion
Many phenomena may share the same principles of signal processing. By continuously summarizing and accumulating knowledge, one can draw parallels and easily identify the causes behind future occurrences of phenomena.
Is there a principle behind every strange phenomenon? This is the second question raised by students at the beginning of this article:
Moreover, when I changed the duty cycle and PWM frequency, this 7.5ms signal persisted with a constant period. Why is that?
What could be the reasoning behind this? Let’s revisit the images shared by students earlier in the article to find the answer.