We are honored to invite several well-known companies and institutions from the TOP20 list, including ARM, Huawei, ZTE, Keysight Technologies, and Alibaba, to attend the ET2018 IoT Forum (Shenzhen Station) to give wonderful speeches.
Including: IoT security chip-level solutions, IoT security, latest applications of NB-IoT, IoT + blockchain, IoT + AI, and other exciting topics!
Click to see details
Source: China Low Power IoT Alliance
Author: LoRa Alliance™ Strategy Committee
Translated by: Zhu Zhixing
Table of Contents
1
Introduction to the White Paper
2
Target Audience
3
Comparison of Positioning Technologies
4
LoRaWAN Positioning Capabilities
Architecture
Impact of Propagation Errors
Impact of Deployment Strategy
Impact of Timing Errors
Filtering to Improve Positioning Accuracy
5
Deployment Case Studies
Port of Barcelona
Isle-Moulin/Bren
Neuchâtel
Mkoma Z National Park
Bouygues Construction
Paris
Torin de Fuyral
6
Summary of LoRaWAN Positioning
Introduction to the White Paper
LoRaWAN™ can provide positioning solutions for low-power wide-area networks, supplying necessary location information for a range of battery-powered application terminals. Any operational LoRaWAN terminal supports positioning functionality without incurring additional BOM costs or requiring extra processing power.
Target Audience
The readers of this white paper are LoRaWAN service providers, enterprises, and terminal equipment manufacturers intending to develop applications with positioning capabilities. This paper will elucidate the technical points of LoRaWAN positioning, highlighting application cases suitable for LoRaWAN positioning, and provide several deployment case studies.
Comparison of Positioning Technologies
LoRaWAN TDOA/RSSI
• The lowest cost solution, any LoRaWAN terminal inherently possesses;
• Cases where LoRaWAN supports long battery life applications;
• TDOA: positioning accuracy of 20-200m depending on the situation;
• RSSI: positioning accuracy of 1000-2000m;
WiFi Positioning
• An efficient solution for indoor and outdoor positioning
• Accuracy improves with increased hotspot density
BLE
• Requires a BLE beacon system
• Indoor positioning solution
GPS/AGPS
• A GPS BOM cost is $5-10
• The most accurate but most power-consuming solution
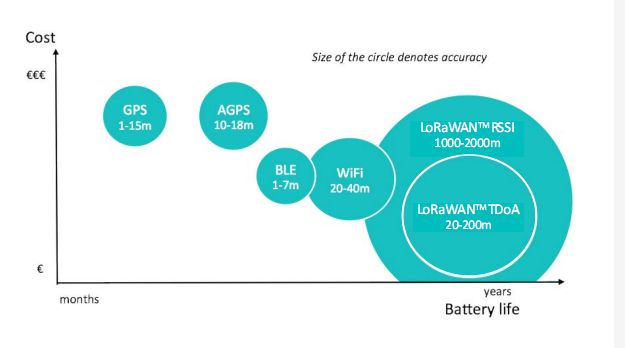
(Figure 3.1 Comparison of Positioning Technologies)
The image above visually presents the comparison of several positioning technologies in terms of cost, accuracy, power consumption, etc.
As shown in the figure, the LoRaWAN protocol provides two positioning methods: positioning based on Received Signal Strength Indicator (RSSI) for coarse positioning; Time Difference of Arrival (TDOA) positioning for precise positioning. This paper will discuss TDOA positioning, as this solution is more suitable for scenarios requiring low-power, battery-operated devices, with positioning accuracy ranging from 20-200 meters.
Deployments in suburban areas with clear line of sight and recommended gateway deployment strategies will achieve high accuracy under low deployment scales. In urban and densely populated environments, multipath issues will affect positioning accuracy. Therefore, generally, positioning accuracy will improve with increased gateway network density.
Typically, terminals that do not require frequent positioning can achieve optimal power efficiency. These devices are usually set as fixed or infrequently moving Class A terminals.
The positioning information for these terminals does not require additional hardware costs. Mobile terminals that require more frequent location information will transmit more data frames, consume more power, and increase hardware costs (such as batteries); these terminals are typically set as Class B or Class C. Using higher data rates (e.g., SF7) helps limit the increased power demand.
The focus of this paper is on outdoor, wide-area positioning. It should be noted that various solutions are being used within the LoRaWAN ecosystem to provide indoor accuracy of 10 meters or even better (gateway density of 100 meters, improved clock sources, etc.). This can be compared to indoor WiFi Angle of Arrival (AOA) positioning technology with accuracy of 1-3 meters.
We are honored to invite several well-known companies and institutions from the TOP20 list, including ARM, Huawei, ZTE, Keysight Technologies, and Alibaba, to attend the ET2018 IoT Forum (Shenzhen Station) to give wonderful speeches.
Including: IoT security chip-level solutions, IoT security, latest applications of NB-IoT, IoT + blockchain, IoT + AI, and other exciting topics!
Click to see details
LoRaWAN Positioning Capabilities
This section will provide a theoretical overview of LoRaWAN TDOA positioning and the factors affecting accuracy errors.
1
Architecture
When the uplink data of a LoRaWAN terminal is received by three or more base stations, it can be positioned. This uplink data does not need to be specific location information; they can be ordinary LoRaWAN data frame structures. If multiple base stations receive the same uplink data simultaneously, the terminal’s location information can be obtained through multipoint positioning technology. The following diagram is a schematic of the multipoint positioning process.
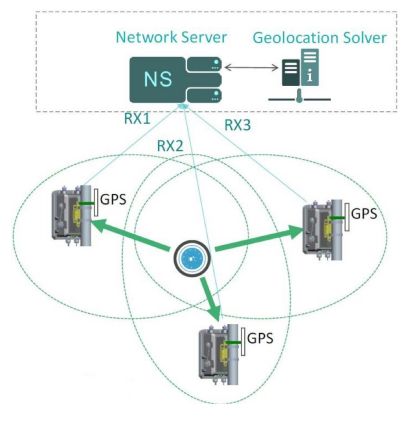
(Figure 4.1 Positioning Architecture Diagram)
No additional hardware support is required here. However, base stations do need precise time synchronization, which is currently achieved through internal GPS in the base stations (or any means that can synchronize with the base station clock within tens of nanoseconds). Each received uplink frame will obtain an accurate timestamp from the gateway. This timestamp will be forwarded to the network server as part of the frame structure, which also includes signal level, signal-to-noise ratio, and frequency error.
The network server will sort multiple receptions of the same data frame, group all metadata containing the timestamp of that frame data, and request a positioning calculation from the positioning solver. In a given frame structure, the basic positioning solving function will calculate the time differences received by different base stations, and from this time difference, the distance from the terminal device to the different base stations can be calculated.
Once the TDOA of two base stations is known, the terminal’s location can be placed on a hyperbola. Through multiple time difference calculations, the terminal’s location information can be presented on multiple hyperbolas, and then the final position of this terminal should be at the intersection of these hyperbolas.
The accuracy of positioning is related to the following factors:
Propagation environment and paths
Gateway deployment strategy and density
Algorithms used for positioning
Accuracy of gateway time synchronization
Dynamics and structure of terminal devices
2
Impact of Propagation Errors
In a multipath environment, the performance of LoRaWAN positioning is limited by the accuracy of the gateway clock. When the signal sensitivity is 25dB, positioning tests can typically achieve accuracy of over 3m. At sensitivity levels, noise can cause accuracy to drop to 60m.
Under these constraints, accuracy rarely depends on the received signal level. In multipath cases, since the system bandwidth is limited to 125 KHz, distinguishing signal paths is usually difficult, and only average channel delay can be estimated. In some cases, the direct signal path does not exist, and only reflected paths can be seen, so the delay offset is introduced into the frame timestamp.
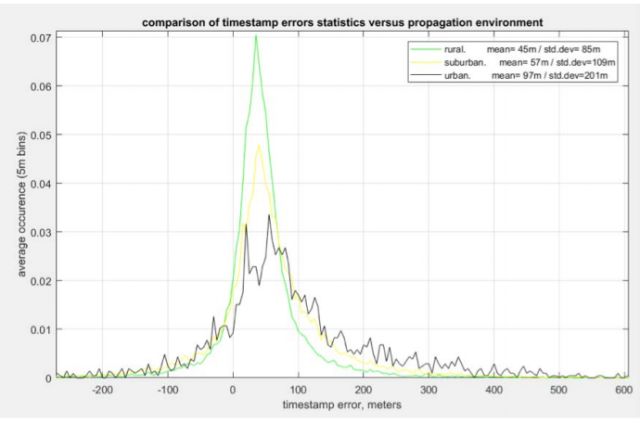
(Figure 4.2 Statistical Error of Timestamps)
Figure 4-2 shows statistical data of timestamp errors under different propagation scenarios. These measurements were obtained from tests with moving vehicles and used GPS to estimate timestamp errors. Urban scenarios have fewer data points compared to other scenarios (2000 versus 10000), which also explains why the curve representing urban areas appears “less favorable.” The average distance from vehicles to gateways is 1.5km.
Overall, timestamps are always delayed. It should be noted that timestamp errors can be negative, but they will never be less than -1/bandwidth (never below the system’s fundamental resolution). We can classify timestamp errors using deviations, which is the average error, and spread around this average value. As the propagation environment worsens, the deviation increases, and the propagation widens.
There are several methods to reduce timestamp errors:
• Repeat frames at different frequency points
• Increase the number of base station antennas (usually two)
• Increase gateway deployment density to increase the number of available samples and opportunities for line-of-sight measurements, thus improving TDOA accuracy
• Reduce the timestamp of delayed frames at the base station
• Introduce out-of-band propagation error correction to alleviate multipath (simulation, prediction, calibration, or fingerprinting)
The design of positioning solvers aims to reduce multipath. The solver will select a queue of timestamps to process and ignore the rest. Then, the solver obtains the location of the terminal device through data solving. Multipath propagation fundamentally limits the system’s accuracy, but the deployment strategy of base stations also plays an important role.
We are honored to invite several well-known companies and institutions from the TOP20 list, including ARM, Huawei, ZTE, Keysight Technologies, and Alibaba, to attend the ET2018 IoT Forum (Shenzhen Station) to give wonderful speeches.
Including: IoT security chip-level solutions, IoT security, latest applications of NB-IoT, IoT + blockchain, IoT + AI, and other exciting topics!
Click to see details
3
Impact of Deployment Strategy
Like other radio systems (e.g., GPS, LORAN), the accuracy of LoRaWAN positioning depends on the positional relationship between the gateway and the terminal device. The indicator used to determine the quality of gateway deployment is the Geometric Dilution Of Precision (GDOP), which is a measure of the “advantage” of the relative geometry of receiving gateways.
Each difference calculated by the positioning solver defines a hyperbolic curve. Hyperbolas are open curves, so when the terminal device is in an unsuitable position relative to the base stations, the crossing of hyperbolas can lead to error amplification.
GDOP can capture this error amplification factor, which only depends on the geometric relationship between the base stations and the terminal device. For positioning within two-dimensional coordinates, we introduce the Horizontal DOP (HDOP). When HDOP is 1, it represents no error amplification; if the base station shows a timestamp uncertainty of 60m (i.e., 200ns), then the final positioning uncertainty is 60m. When HDOP is 2, the final uncertainty is 120m. When the density of base stations is high, HDOP can also be less than 1.
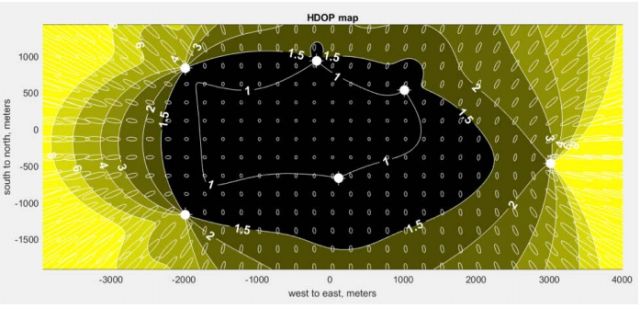
(Figure 4.3 HDOP Map)
Figure 4-3 simulates the HDOP map of six base stations deployed. The points in the figure represent gateways, and the contour areas show HDOP displays.
In the middle area, HDOP is greater than 1 and increases to greater than 8 on either side. Outside the polygon composed of gateways, HDOP increases very quickly. High HDOP significantly reduces positioning accuracy.
In the white uncertain area of conventional space, it describes both the amplitude of location errors and the direction of errors (pointing radially towards the center of the polygon). Note that on the east side of the map, even within the polygon area of gateways, HDOP can reach 2 with significant errors along the north-south axis due to lower gateway density along that axis.
It should be mentioned that the closer the base stations are, the better the positioning effect is not necessarily true; the most important factor is the layout strategy of the base station positions. Compared to the center of a rectangle, positioning accuracy will be better in the center of a square formed by four gateways.
Poor performance outside the coverage polygon should be a deployment strategy issue. Therefore, for small-scale or pilot positioning deployments, it is strongly recommended to introduce HDOP and optimize gateway location selection.
4
Impact of Timing Errors
The quality of GPS reception will also affect accuracy. For mobile service providers, base stations close to mobile sites may experience periodic GPS blockage, so special antennas must be used.
Base stations installed on low rooftops or billboards in urban areas will also be affected by the “urban canyon” effect, where fewer satellites are available. When GPS reception quality is good, the time base error is about 25ns (<10m). GPS is not the main source of error, as deployment accuracy cannot reach 10m. However, in densely deployed LoRaWAN networks, improving the accuracy of gateway clocks can further enhance positioning accuracy.
We are honored to invite several well-known companies and institutions from the TOP20 list, including ARM, Huawei, ZTE, Keysight Technologies, and Alibaba, to attend the ET2018 IoT Forum (Shenzhen Station) to give wonderful speeches.
Including: IoT security chip-level solutions, IoT security, latest applications of NB-IoT, IoT + blockchain, IoT + AI, and other exciting topics!
Click to see details
5
Filtering to Improve Positioning Accuracy
Depending on the application, the output results of the positioning solver can be filtered to achieve better accuracy. For example, if the terminal device’s location is known to be fixed, the average position over time can be used to infer the location. Kalman filtering is a general technique that estimates position and speed from noisy observations (most positioning systems use the Kalman model).
Returning to LoRaWAN positioning, since the pre-filtered position estimates are sparse and noisy, filtering has a significant impact on positioning performance. If the filter can utilize a specific terminal device’s speed profile, it can improve positioning accuracy. This configuration information comes from the terminal itself (fixed, moving, etc.) and is directed towards specific applications.
Another specific application is matched filtering. For instance, if the terminal device moves between warehouses, the filter first categorizes the terminal device as stationary or moving. If it is stationary, it can be determined to be located within a particular warehouse. If it is moving, it is on a certain path.
For low-power optimization, the duty cycle of LoRaWAN may be limited in certain areas, resulting in terminal devices being able to transmit a limited number of frames per day. This limitation is an aspect of LoRaWAN communication restrictions and is not specific to positioning scenarios. In practice, fixed devices are easier to position than moving ones, as some frame data can be utilized more easily to filter location estimates.
Deployment Case Studies
1
Port of Barcelona (Actility/Cisco)
An example of LoRaWAN positioning is vehicle positioning. GPS has been used for vehicle positioning for many years. However, due to installation complexity and cost issues, it has not been widely adopted. Since GPS positioning is very power-consuming and requires connection to a battery, the new generation of low-power positioning solutions based on LoRaWAN TDOA positioning is now available.
At the 2017 Mobile World Congress, Actility and Cisco installed six IR829/IXM LoRaWAN gateways at ZAL Port, achieving dedicated LoRaWAN network coverage for ZAL Port. The ZAL management system provides security, operations, and daily services for companies within the port.
The network covers an area of 0.43 square kilometers within the port, with six gateways spaced 400-600 meters apart to ensure good network coverage. There were no specific high points to place antennas within the three-story metal building area, so antennas were directly installed on the roof (suboptimal configuration).
Abeeway positioning terminals were installed on management vehicles. The positioning terminal operates in LoRaWAN TDOA mode, which is the most energy-efficient positioning method. If power consumption is less of a concern, using LoRaWAN uplink to assist GPS in reporting positioning data can be used for scenarios requiring higher accuracy (within 10m).
Compared to typical AGPS/GSM positioning terminals, LoRaWAN positioning terminals save over 50% of energy. Additionally, since they are battery-powered and do not require additional power sources, the terminals are very easy to install, requiring only adhesive, screws, or other simple means to secure them to the vehicle. An app is also used to monitor the online vehicle operation status at ZAL Port in real-time.
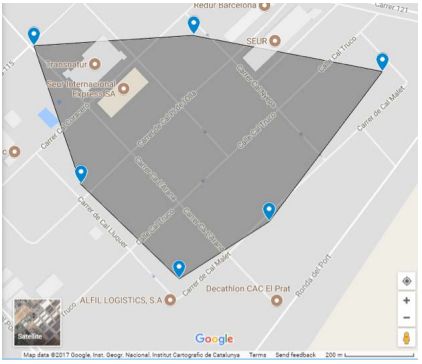
(Figure 5.1 Schematic of Gateway Locations at ZAL Port)
In the case of ZAL Port, the application calculates the time each vehicle spends passing each building (e.g., how long it stopped). The buildings in the logistics area are usually sparse, and the parking positions of vehicles are more than 80 meters away from the buildings, with most vehicles parked for 20 minutes to 12 hours. Tracking parked vehicles is a major application of TDOA positioning, with positioning terminals reporting location information every 10 minutes, achieving positioning accuracy of 60-80m. When vehicles are stationary, the positioning solver averages multiple frames of data, and when vehicles start moving again, they can be monitored in real-time. Figure 5-2 shows the positional accuracy of parked vehicles.
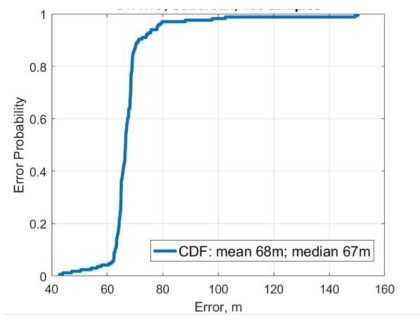
(Figure 5.2 TDOA Positioning Accuracy at ZAL Port: Parked Vehicles)
The approximate real-time location of moving vehicles can also be positioned via TDOA. Through our tests, the average accuracy at which a moving vehicle can be positioned is 171 meters. This is sufficient to determine the general direction of the vehicle’s travel, whether it is heading to the next location or returning to the parking point at the end of the day.
In this case, positioning accuracy is not as critical, as the positioning information is primarily used to trigger alerts when vehicles enter or exit designated areas. Figure 5-3 shows the positioning accuracy of moving vehicles.
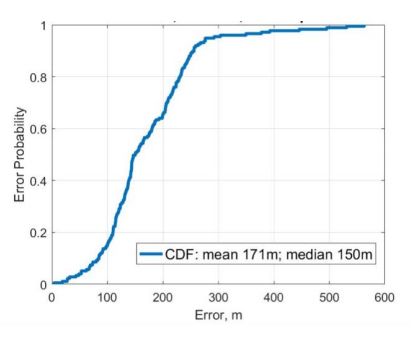
(Figure 5.3 TDOA Positioning Accuracy at ZAL Port: Moving Vehicles)
2
Isle-Moulin/Bren (Actility/Cisco)
Cisco and Actility deployed five IXM LoRaWAN gateways in the Paris region to validate LoRaWAN positioning capabilities. The network covers the urban areas of Isle-Moulin and Bren. The base stations use Ethernet or mobile networks for data backhaul, and the testing system operates 24 hours, generating messages for positioning application development from both stationary and moving test nodes.
The network covers an area of approximately 1.6 square kilometers, with four base stations spaced 900 to 1300 meters apart, forming a pentagonal area. The fifth base station deployed in Bren will be used in future tests. The area includes commercial, municipal, and residential zones, as well as more open spaces like the Seine River, parks, and stadiums. Antennas are installed at heights ranging from 60m to 126m.
High-point deployment (as shown in Figure 5-4) can provide long-distance coverage, but ground coverage may sometimes be affected. Due to the mountainous terrain, additional base station deployment will be needed to ensure optimal positioning capabilities (each positioning terminal’s data must be received by at least three base stations).
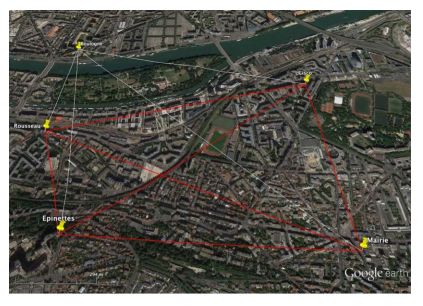
(Figure 5.4 Schematic of Gateway Deployment in Isle-Moulin/Bren)
Fixed asset positioning is tested using Adeunis V2 testing devices that send uplink data every 20 seconds. Every eight uplink data frames constitute a positioning “frame.” The positioning terminal is configured with a “fixed” profile, supporting adaptive data rates.
In areas composed of interconnected gateways (with good HDOP), positioning accuracy can reach 75-115m (approximate standard deviation of 25m). In peripheral areas, positioning accuracy is 400m (poor HDOP). These results are consistent with the findings from the Barcelona ZAL Port tests. Figure 5-5 provides a typical positioning map. Other gateway deployment strategies and tests for fixed and moving terminals are ongoing.
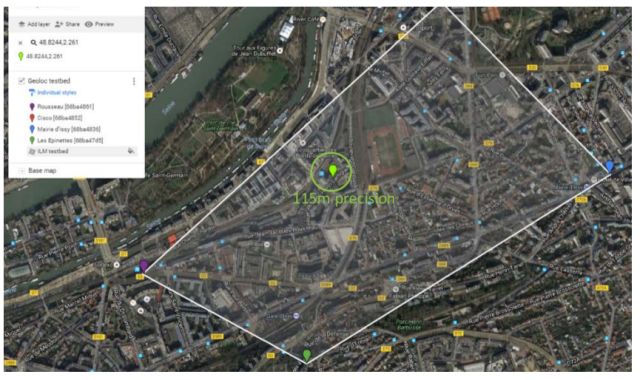
(Figure 5.5 Typical Positioning Map in Paris)
In the Paris region, various tests are being conducted to optimize positioning accuracy and validate the performance of different deployment strategies.
6
Neuchâtel (Semtech)
Semtech is conducting LoRaWAN positioning tests in the urban environment of Neuchâtel, Switzerland. The city is situated between a lake and a mountain and has many hills. Therefore, from the perspective of GDOP, this is a challenging case. The long delays caused by the mountainous terrain can affect positioning accuracy.
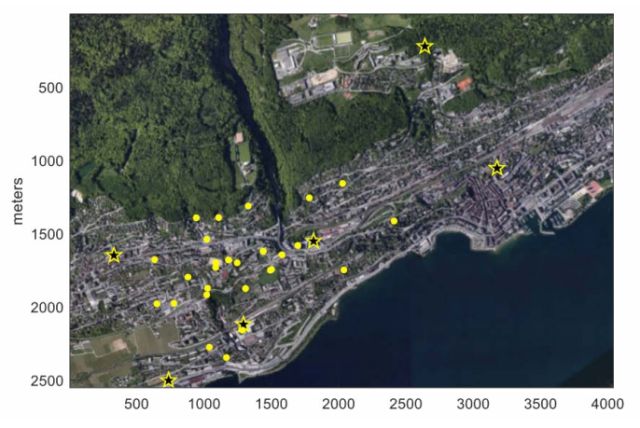
(Figure 5.6 Schematic of Neuchâtel Positioning Example)
Figure 5-7 shows the cumulative distribution function of positioning performance based on the different number of LoRaWAN frames received from 30 testing points. The average positioning accuracy in a single frame is approximately 150 meters, while the accuracy improves to 80 meters with 8 frames. No filtering was applied in this case.
Multiple tests were conducted at different data rates: SF7, SF10, and SF12. Their performance was identical, indicating that multipath and GDOP are the primary factors affecting performance. The worse the GDOP, the worse the positioning performance: with 8 frames, 90% of positioning accuracy is only 205 meters.
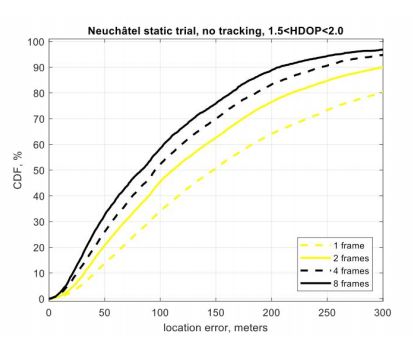
(Figure 5.7 Positioning Performance in Neuchâtel)
4
Mkoma Z National Park (Semtech/Kerlink)
The Internet of Life and ShadowView Foundation are developing trackers based on LoRaWAN to protect endangered black rhinos in Mkoma Z National Park, Tanzania, with the support of Semtech and Kerlink technologies. The GPS-free LoRaWAN trackers are smaller, cheaper, consume less power, and are not affected by poachers equipped with GPS jammers, while also being able to report geographic locations more frequently compared to GPS trackers.
In September last year, the first LoRaWAN tracker was implanted into a rhino’s horn, allowing park security personnel to locate and monitor the rhinos themselves.
The rhino reserve is a fenced area covering 50 square kilometers. Four Kerlink gateways supporting positioning have been deployed to achieve LoRaWAN coverage in this area. The distance between the gates ranges from 4 kilometers to 10 kilometers. Positioning accuracy exceeds 50m, and in some cases, exceeds 20m.
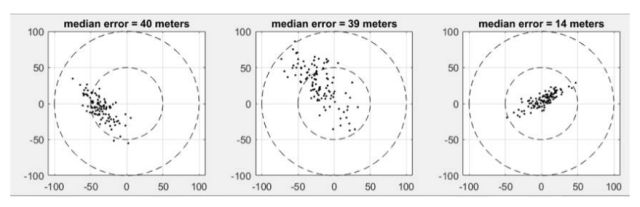
(Figure 5.8 Schematic of Mkoma Z Positioning Pilot (Four Frames))
Figure 5-8 shows an example of rhino positioning, where each point uses four frames to calculate a position. The average error in the first two figures is 40m, while the corresponding testing points are located in an area with HDOP greater than 2. In the third figure, HDOP is 1.5. The exact positions of the testing points and gateways cannot be disclosed. The network within the area will undergo better HDOP optimization, and network deployment in other areas of the national park has also been planned.
Other smart applications being used by the park management include solar trackers installed on vehicles to track personnel and visitors’ movements in high-risk areas. Figure 5-9 shows the positioning results of a single frame, with accuracy exceeding 50 meters, but with more variation compared to the four-frame scenario.
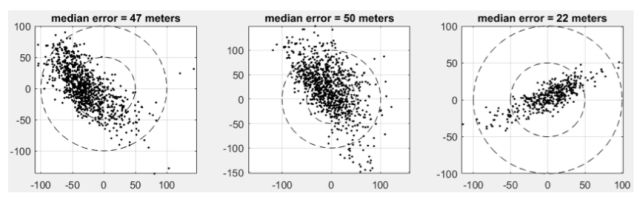
(Figure 5.9 Schematic of Mkoma Z Positioning Pilot (Single Frame))
5
Bouygues Construction (Objenious/Sagemcom)
Building logistics, fleet management, and waste management are potential markets for the Internet of Things. Objenious (Bouygues Telecom) and Sagemcom jointly developed the Ubysol solution for Bouygues Construction, which tracks construction waste while trucks transport goods between loading and unloading points.
The Ubysol solution supports the overall planning of the “Greater Paris” area, aiming to transform the urban area (the city of Paris and 130 surrounding suburbs and communities) into a 21st-century city. It is estimated that this project will generate over 43 million tons of construction waste. Each truck is equipped with a Siconia™ multi-sensor terminal device. The data transmission of the terminal device is triggered by motion sensors and uses gyroscopes to detect loading and unloading.
To benchmark the LoRaWAN positioning, some trucks were also equipped with GPS sensors. The paths of GPS and LoRaWAN positioning were compared, as shown in Figure 5-10, where the two paths align well.
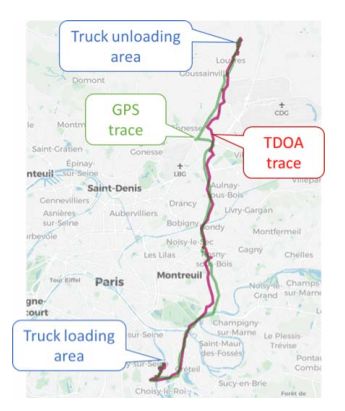
(Figure 5.10 Comparison of GPS and LoRaWAN TDOA Positioning Paths)
Statistical performance (CDF) obtained over several months shows that the positioning performance results of the Ubysol solution are illustrated in Figure 5-11, achieving an average positioning accuracy of 136m.
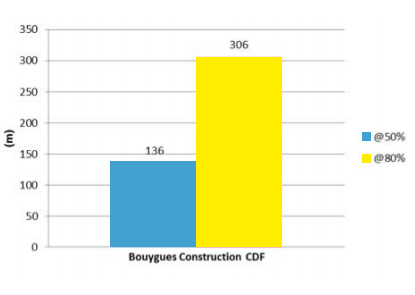
(Figure 5.11 Statistical Accuracy of Ubysol’s Solution)
6
Paris (Objenious/Sagemcom)
Asset management in urban environments faces several challenges: multipath environments, typical non-line-of-sight propagation. Objenious and Sagemcom deployed numerous Siconia™ positioning devices in downtown Paris to track trucks. Alarms are triggered when trucks leave designated areas. Figure 5-12 shows the positioning terminals and gateway locations in downtown Paris and the effectiveness of LoRaWAN positioning.
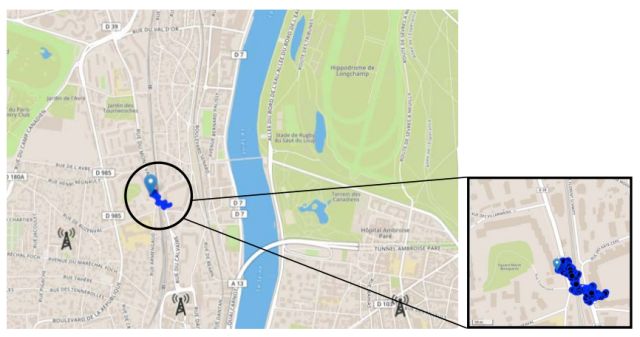
(Figure 5.12 Schematic of Truck Positioning in Downtown Paris)
The key performance indicators (KPIs) of these positioning terminals are shown in Figure 5-13. CDF (the first figure) and the probability distribution function of positioning accuracy (the second figure) (mean: 57m, std: 18m), as well as positioning errors (the third figure). The instantaneous site distance (ISD; fourth figure) is an indicator of network density.
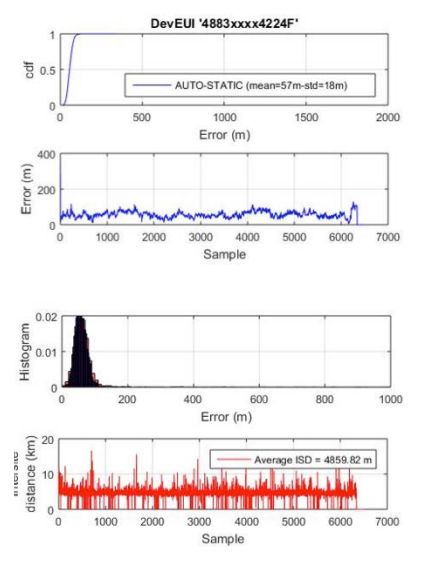
(Figure 5.13 Positioning Performance (CDF, ISD), Downtown Paris)
Figure 5-14 shows the instantaneous impact of HDOP on positioning accuracy in the deployment area. Before deploying gateways, static GDOP should be assessed according to the instructions in section 4.3 and consider the combinations of available gateways in the deployment area.
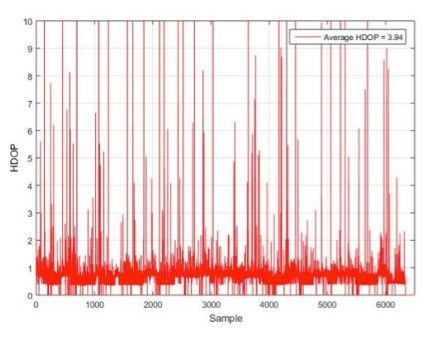
(Figure 5.14 Instantaneous HDOP Impact in Downtown Paris)
Figure 5-15 shows the GDOP obtained from a fixed terminal device (in red) under the deployment of gateways in the area.
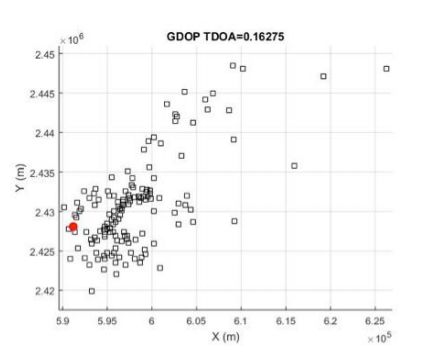
(Figure 5.15 GDOP Estimate for a Fixed Terminal Device (in Red) Under Gateway Deployment)
For the same stationary terminal device, Figure 5-16 shows the relationship between the radio measurement environment (average RSS) and the distance between the terminal device and the base station. Clearly, in areas outside of corridors formed by dense gateways, the values of HDOP are much higher than those aligned with the gateway corridor.
(Figure 5.16 HDOP Impact vs. Distance Between Terminal and Base Station)
7
Torin de Fuyral (Kerlink/Semtech)
Kerlink provides positioning base stations in its Wirnet IBTS series that support location-based services (LBS). These base stations can provide precise timestamps for positioning (using Semtech’s protocol). A TDOA positioning solver has been developed and integrated into proprietary LBS solutions.
Kerlink has established several testing platforms worldwide in various environments and conditions (rural, semi-urban, urban) to evaluate and optimize the performance of positioning solvers, particularly regarding computational accuracy and positioning accuracy. The testing platform deployed in Torin de Fuyral will continue to operate, with four base stations installed in the city and multiple positioning terminals placed at planned fixed locations. When the positioning solver receives a near-real-time message, it begins calculating the position information and then returns the results to the dashboard for display.
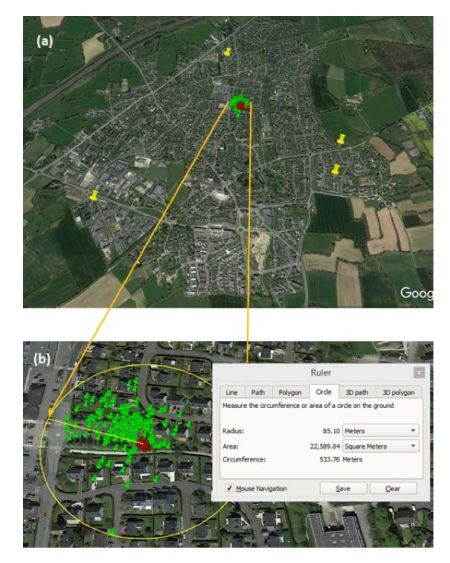
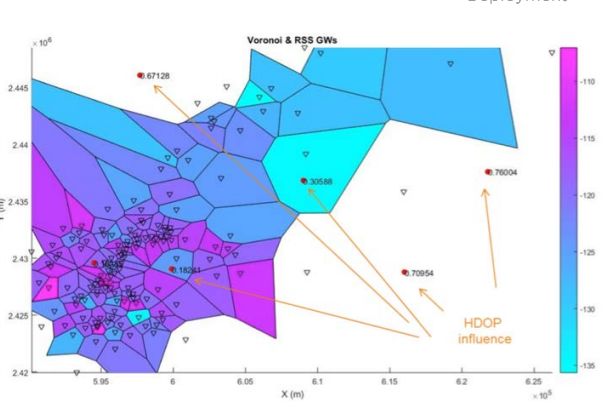
Figure 5.17 (a) Torin de Fuyral LoRaWAN Positioning Testing Platform (b) Estimated Position of Stationary Terminal
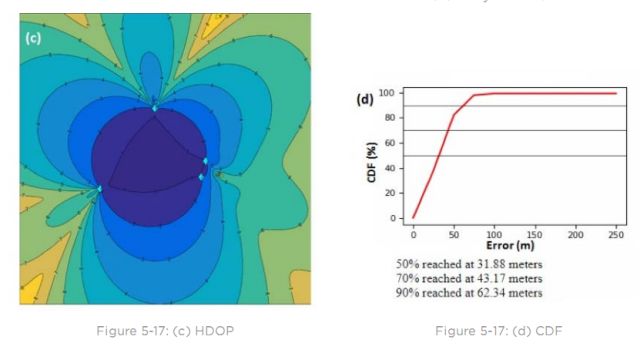
Figure 5.17 (c) HDOP (d) CDF
Figures 5.17(a) and (b) show the deployed network and the estimated positions of positioning terminals. Analysis of HDOP (Figure 5.17(c)) allows us to better understand positioning accuracy. Here it is worth noting that the positioning information is processed using a Kalman filter. For a terminal’s CDF, Figure 5.17(d) shows that the accuracy is 50% at 32 meters, 70% at 43 meters, and 90% at 62 meters.
Summary of LoRaWAN Positioning
In summary, the following conclusions can be drawn:
• LoRaWAN TDOA positioning can provide positioning accuracy of 20 to 200 meters.
• One of the benefits of LoRaWAN positioning is the realization of positioning functionality using Class A terminal devices that are long-lasting and battery-powered, thus not incurring any additional BOM costs.
• Reducing multipath errors and good gateway deployment planning can enhance positioning accuracy to 20 meters.
• LoRaWAN TDOA positioning is particularly suitable for the following scenarios:
• Area fencing. Is fixed assets being moved? (Theft prevention in construction sites, public areas, airports, campuses, etc.)
• Tracking slowly moving assets that do not require frequent location updates (people, pets, livestock, vehicles, etc.), especially suitable for certain cases in smart agriculture and smart cities.
LoRaWAN TDOA positioning may not be suitable for the following scenarios:
• Real-time tracking of mobile assets. Higher positioning frequency means more power consumption, Class C terminals, etc.
• High dynamic asset positioning.
• High precision positioning (sub-meter level, which cannot be achieved with the current base station clock).
• Use cases that require GPS functionality transmission.
We are honored to invite several well-known companies and institutions from the TOP20 list, including ARM, Huawei, ZTE, Keysight Technologies, and Alibaba, to attend the ET2018 IoT Forum (Shenzhen Station) to give wonderful speeches.
Including: IoT security chip-level solutions, IoT security, latest applications of NB-IoT, IoT + blockchain, IoT + AI, and other exciting topics!
Click to see details

Click to read the original text for more