Source: Internet
When optimizing a Linux system, physical memory is one of the most important aspects. Naturally, Linux provides many methods to monitor the usage of this precious memory resource. The following list details various methods to check memory usage in a Linux system through viewing tools or command line.
1. /proc/meminfo
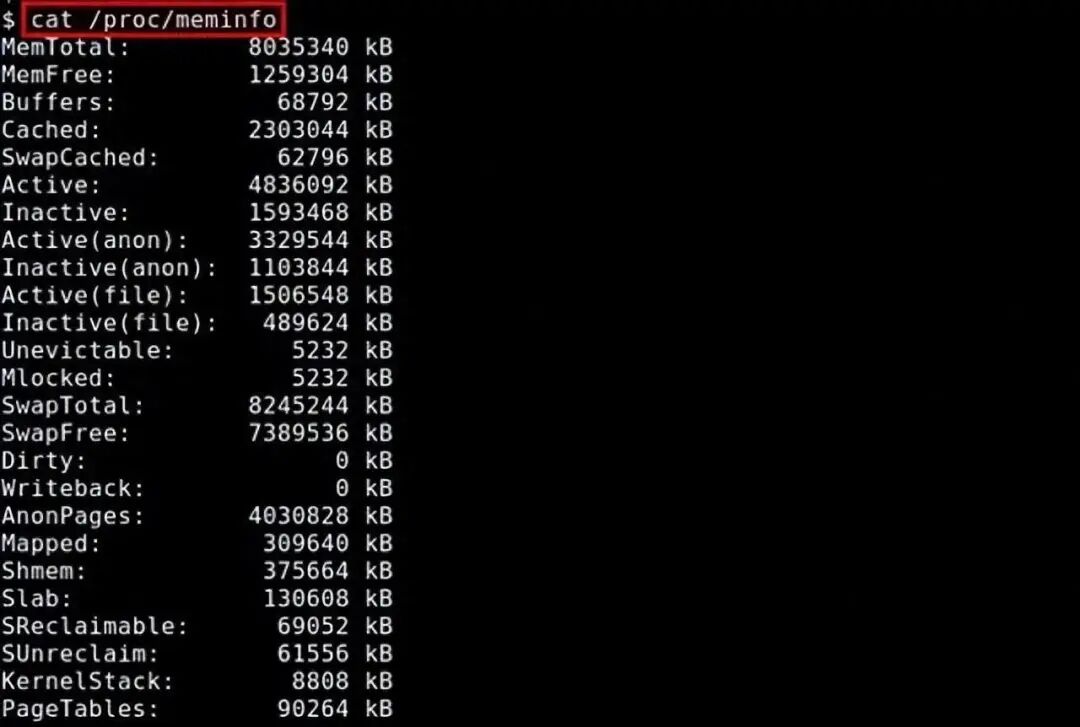
The simplest way to check RAM usage is through /proc/meminfo. This dynamically updated virtual file is actually a combination display of many other memory-related tools (such as: free / ps / top). /proc/meminfo lists all the memory usage information you want to know. Process memory usage information can also be viewed through /proc/<pid>/statm and /proc/<pid>/status.
$ cat /proc/meminfo
2. atop
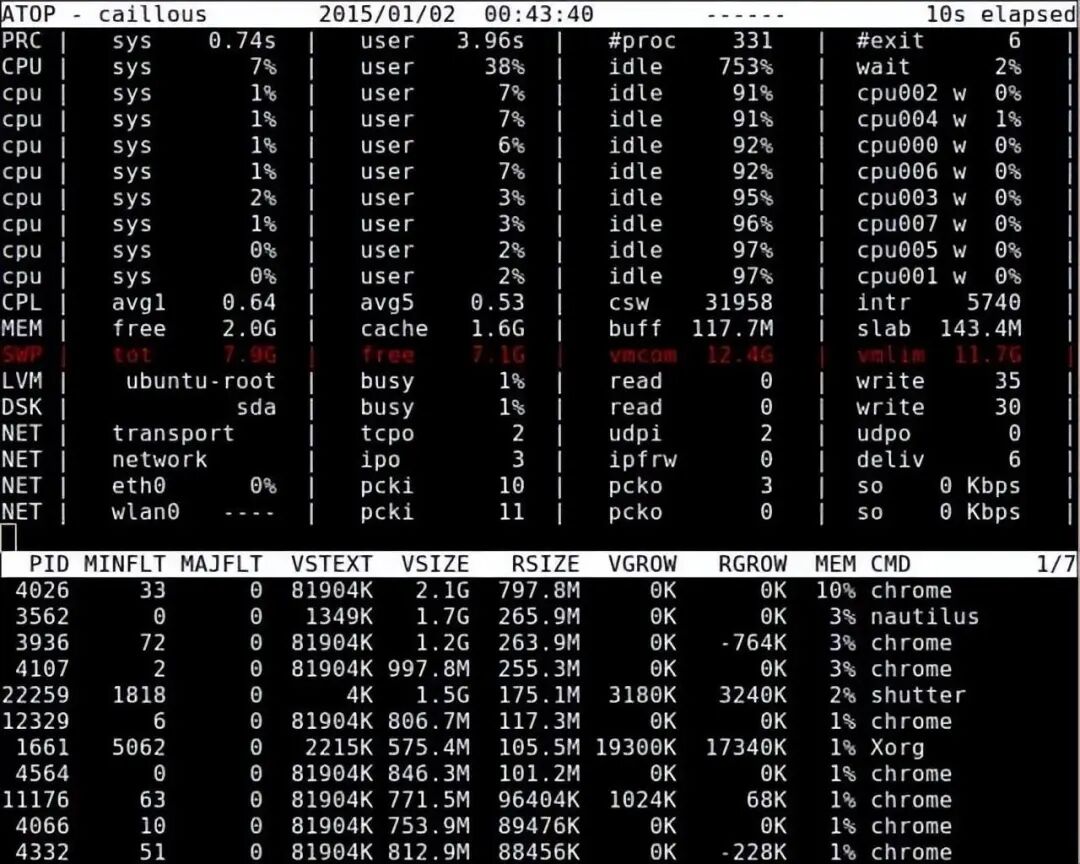
The atop command is a monitoring command for terminal environments. It displays a comprehensive view of various system resources (CPU, memory, network, I/O, kernel) and highlights them in color under high load conditions.
$ sudo atop
3. free
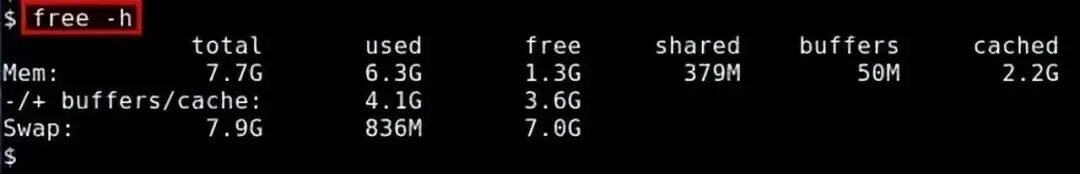
The free command is a quick way to view memory usage; it provides an overview of the information collected from /proc/meminfo.
$ free -h
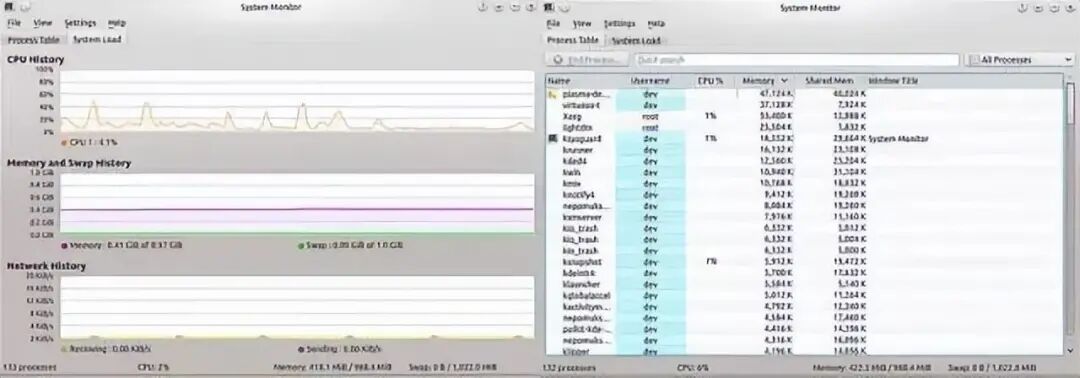
4. GNOME System Monitor
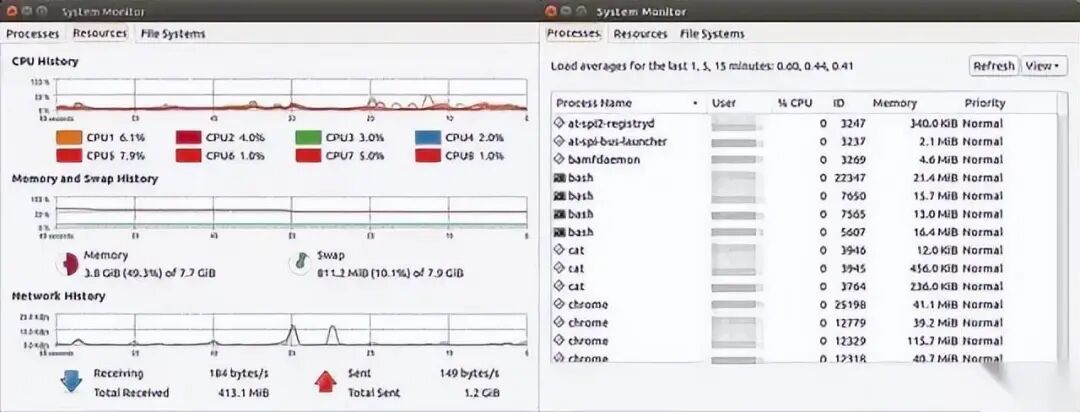
GNOME System Monitor is a viewing tool that displays the usage of CPU, memory, swap space, and network over a recent period. It also provides a way to view CPU and memory usage.
$ gnome-system-monitor
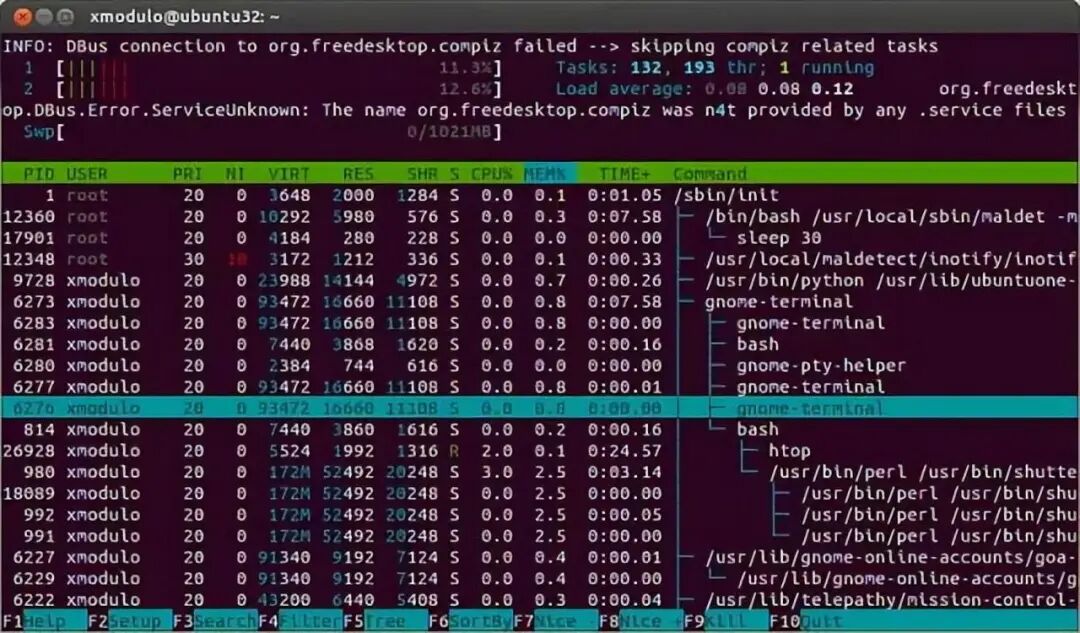
5. htop
The htop command displays the real-time memory usage of each process. It provides reports on the resident memory size of all processes, total memory size of programs, shared library size, etc. The list can be scrolled horizontally and vertically.
$ htop
6. KDE System Monitor
Functionally similar to the GNOME version described in section 4.
$ ksysguard
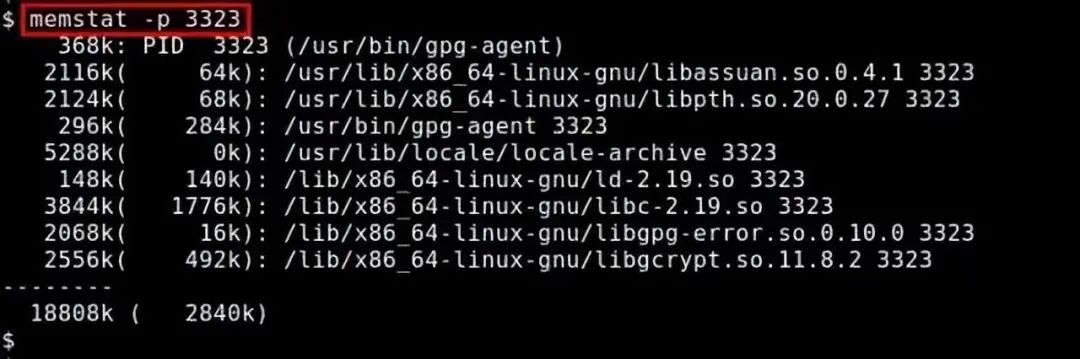
7. memstat
memstat is a command that effectively identifies the usage of virtual memory by executable(s), process(es), and shared libraries. Given a process ID, memstat can list the executable files, data, and shared libraries related to that process.
$ memstat -p <PID>
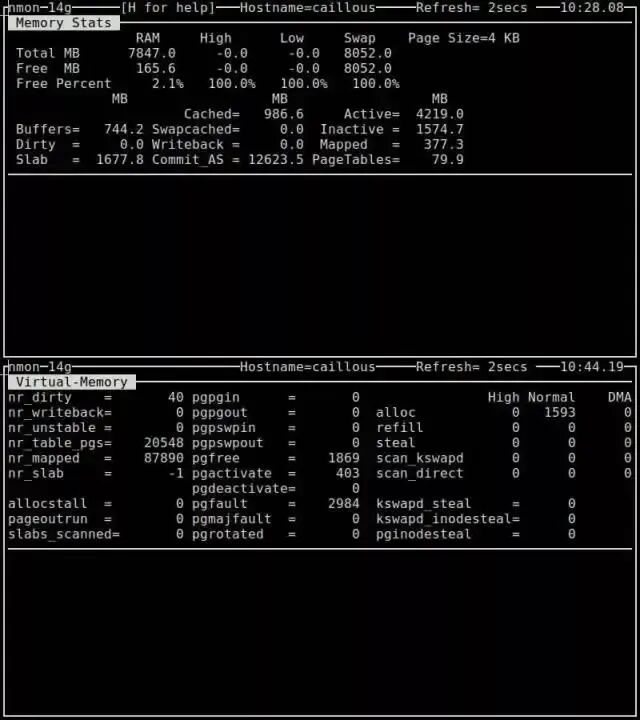
8. nmon
nmon is a system benchmarking tool based on ncurses that can monitor the interactive patterns of CPU, memory, I/O, file system, and network resources. For memory usage, it can display total/remaining memory, swap space, and other information in real-time.
$ nmon
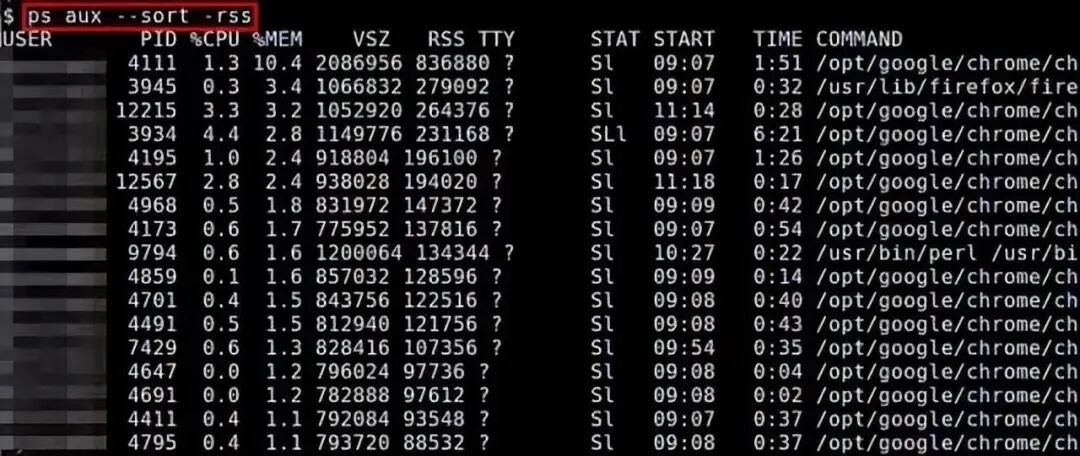
9. ps
The ps command can display the memory usage of each process in real-time. Reported memory usage information includes %MEM (percent of physical memory used), VSZ (total amount of virtual memory used), and RSS (total amount of physical memory used). You can use the “–sort” option to sort processes, for example, by RSS:
$ ps aux –sort -rss
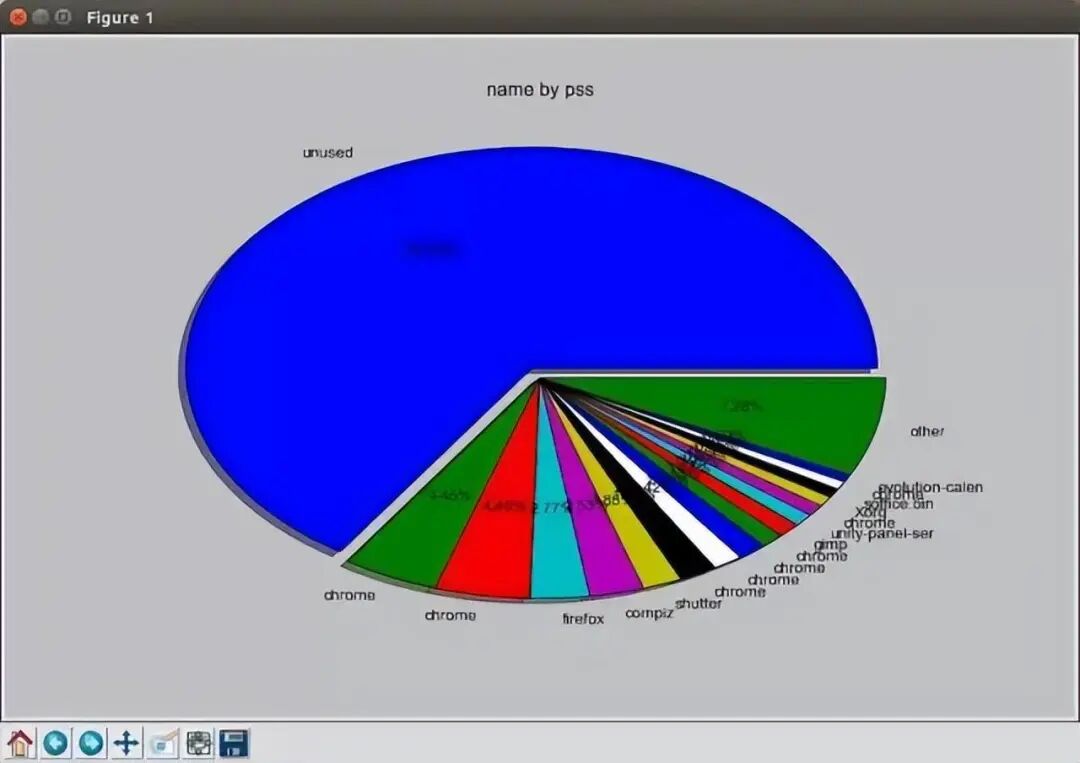
10. smem
The smem command allows you to summarize memory usage for different processes and users based on /proc information. Memory usage analysis can be exported as charts (such as bar graphs and pie charts).
$ sudo smem –piename -c “pss”
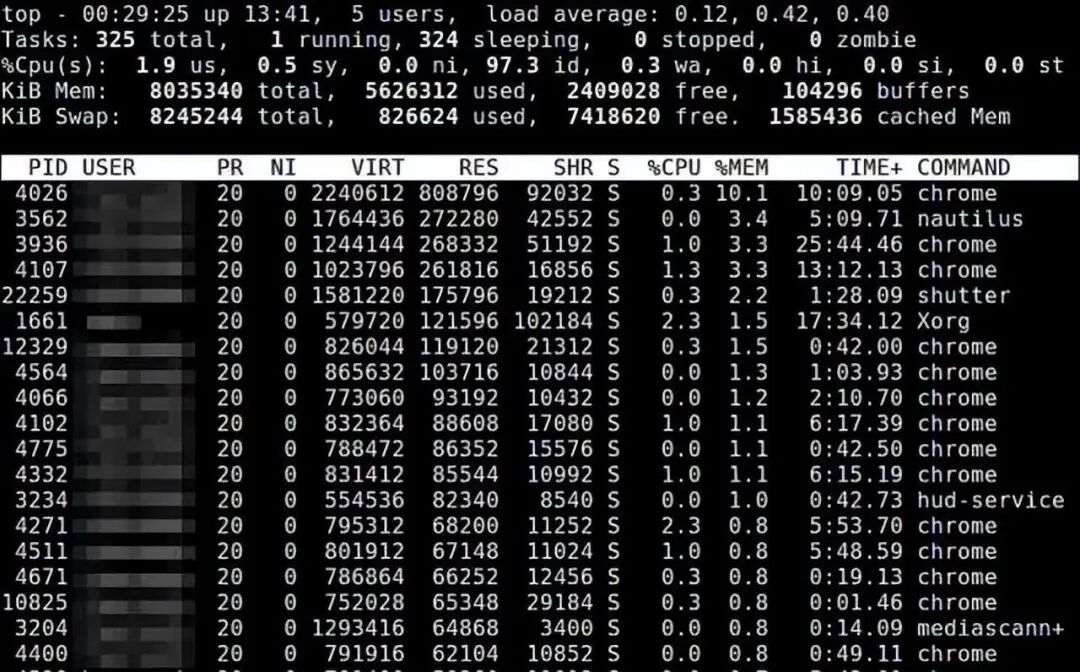
11. top
The top command provides real-time statistics of resource usage for running programs. You can sort by memory usage and size.
$ top
12. vmstat
The vmstat command displays real-time and average statistics covering CPU, memory, I/O, etc. For example, regarding memory, it displays not only physical memory but also virtual memory statistics.
$ vmstat -s
Recommended Reading Click the title to jump
1. C++ Bootcamp is here!
2. HarmonyOS Learning Materials Sharing (Free Sharing Without Tricks)
I've formed some communities for discussion, where there are both experts and beginners. If you're interested, you can join the group for communication.

Feel free to add me on WeChat, and I'll add you to the technical exchange group. Additionally, I often share some computer learning experiences and work insights on WeChat, as well as some internal referral opportunities.

Add me on WeChat to open another window.

Thank you for your sharing, likes, and triple clicks.