1. System Architecture Design
1. Architecture Flowchart
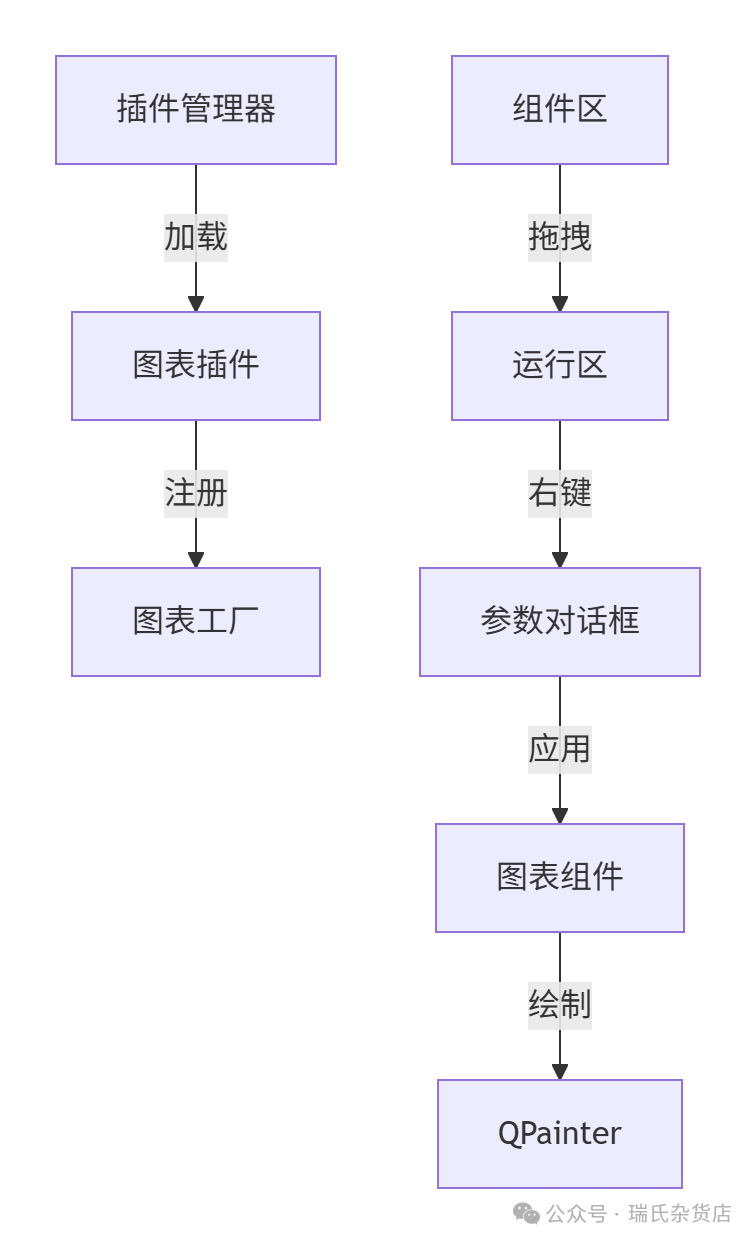
2. Class Diagram Design
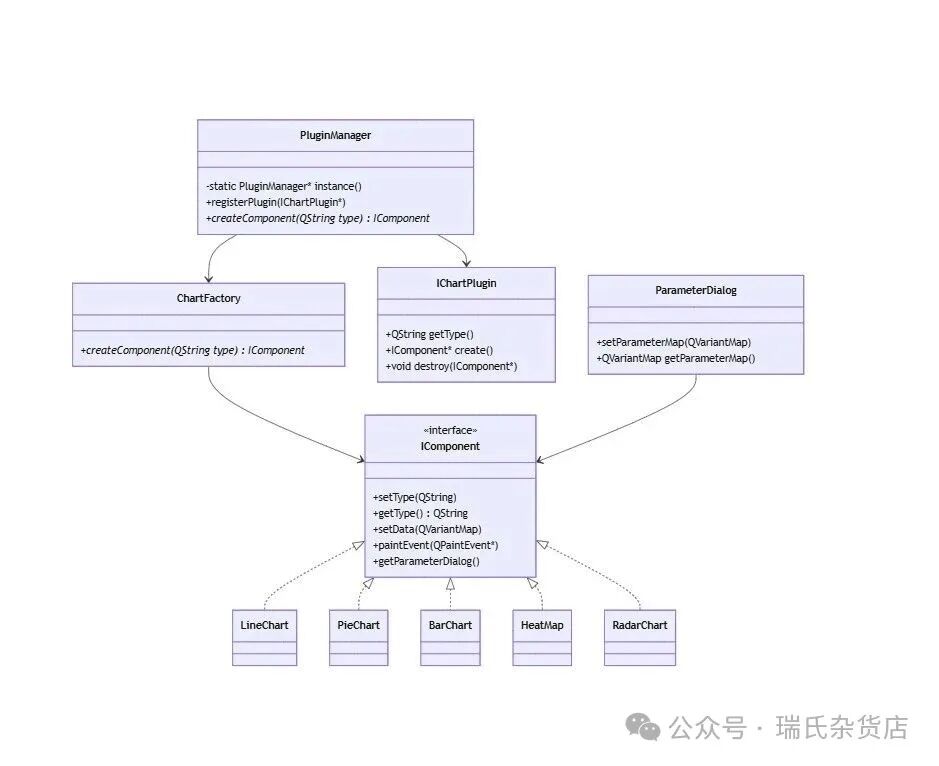
2. Core Code Implementation
1. Chart Component Interface (IComponent)
// ichartcomponent.h
#ifndef ICHARTCOMPONENT_H
#define ICHARTCOMPONENT_H

#include<QWidget>
#include<QVariantMap>
#include<QPaintEvent>

class IComponent : public QWidget {
    Q_OBJECT
public:
explicit IComponent(QWidget* parent = nullptr) : QWidget(parent) {}
virtual ~IComponent() = default;

// Basic property settings
virtual void setType(const QString& type) = 0;
virtual QString getType() const = 0;

// Data interaction
virtual void setData(const QVariantMap& data) = 0;
virtual QVariantMap getData() const = 0;

// Drawing control
virtual void updateChart() = 0;  // Trigger redraw

// Parameter editing
virtual QDialog* createParameterDialog(QWidget* parent = nullptr) = 0;

signals:
void chartUpdated();  // Chart update notification
};

#endif // ICHARTCOMPONENT_H
2. Specific Chart Component Implementation (Example: Line Chart)
Line Chart Component
// linechart.h
#ifndef LINECHART_H
#define LINECHART_H

#include "ichartcomponent.h"
#include<QVector>
#include<QColor>

class LineChart : public IComponent {
    Q_OBJECT
public:
explicit LineChart(QWidget* parent = nullptr);

// IComponent interface implementation
void setType(const QString& type) override { m_type = type; }
QString getType() const override { return m_type; }
void setData(const QVariantMap& data) override;
QVariantMap getData() const override;
void updateChart() override { update(); }
QDialog* createParameterDialog(QWidget* parent = nullptr) override;

protected:
void paintEvent(QPaintEvent* event) override;

private:
    QString m_type = "LineChart";
    QVector<QPointF> m_dataPoints;  // Data points (x,y)
    QColor m_lineColor = Qt::blue;
    QColor m_bgColor = QColor(240, 240, 240);
    QFont m_axisFont = QFont("微软雅黑", 9);
};

// linechart.cpp
#include "linechart.h"
#include<QPainter>
#include<QLinearGradient>
#include<QDialog>
#include<QVBoxLayout>
#include<QFormLayout>
#include<QColorDialog>
#include<QSpinBox>

void LineChart::setData(const QVariantMap& data) {
    m_dataPoints.clear();
// Example data format: {"x":[1,2,3,4], "y":[10,20,15,25]}
if (data.contains("x") && data.contains("y")) {
        QVector<double> x = data["x"].value<QVector<double>>();
        QVector<double> y = data["y"].value<QVector<double>>();
for (int i = 0; i < x.size(); ++i) {
            m_dataPoints.append(QPointF(x[i], y[i]));
        }
    }
update();
}

QVariantMap LineChart::getData() const {
return {
        {"x", QVector<double>() << 1 << 2 << 3 << 4},  // Example return
        {"y", QVector<double>() << 10 << 20 << 15 << 25}
    };
}

void LineChart::paintEvent(QPaintEvent* event) {
Q_UNUSED(event);
QPainter painter(this);
    painter.setRenderHint(QPainter::Antialiasing);

// Draw background
    painter.fillRect(rect(), m_bgColor);

// Calculate drawing area (leave margins)
int margin = 30;
    QRectF plotRect = rect().adjusted(margin, margin, -margin, -margin);

// Draw axes
    painter.setPen(QPen(Qt::black, 1));
    painter.drawLine(plotRect.topLeft(), plotRect.bottomRight());  // Diagonal axis example
    painter.drawLine(plotRect.topLeft(), plotRect.topRight());    // Horizontal axis
    painter.drawLine(plotRect.topLeft(), plotRect.bottomLeft());  // Vertical axis

// Draw line
    painter.setPen(QPen(m_lineColor, 2));
    QPainterPath path;
    QPointF startPoint = plotRect.topLeft() + QPointF(
        (m_dataPoints.first().x() - plotRect.left()) / plotRect.width() * plotRect.width(),
        plotRect.height() - (m_dataPoints.first().y() - plotRect.top()) / plotRect.height() * plotRect.height()
    );
    path.moveTo(startPoint);
for (const auto& p : m_dataPoints) {
        QPointF point = plotRect.topLeft() + QPointF(
            (p.x() - plotRect.left()) / plotRect.width() * plotRect.width(),
            plotRect.height() - (p.y() - plotRect.top()) / plotRect.height() * plotRect.height()
        );
        path.lineTo(point);
    }
    painter.drawPath(path);
}

QDialog* LineChart::createParameterDialog(QWidget* parent) {
    QDialog* dialog = new QDialog(parent);
    dialog->setWindowTitle("Line Chart Parameter Settings");

    QVBoxLayout* layout = new QVBoxLayout(dialog);
    QFormLayout* form = new QFormLayout;

// Color selection
    QPushButton* colorBtn = new QPushButton("Select Line Color");
    QObject::connect(colorBtn, &QPushButton::clicked, [this]() {
        m_lineColor = QColorDialog::getColor(m_lineColor, this);
update();
    });
    form->addRow("Line Color:", colorBtn);

// Background color selection
    QPushButton* bgColorBtn = new QPushButton("Select Background Color");
    QObject::connect(bgColorBtn, &QPushButton::clicked, [this]() {
        m_bgColor = QColorDialog::getColor(m_bgColor, this);
update();
    });
    form->addRow("Background Color:", bgColorBtn);

    layout->addLayout(form);
    layout->addStretch();
    dialog->setLayout(layout);
return dialog;
}
3. Chart Factory and Plugin System
Chart Factory
// chartfactory.h
#ifndef CHARTFACTORY_H
#define CHARTFACTORY_H

#include "ichartcomponent.h"
#include<QMap>
#include<QString>

class ChartFactory {
public:
static ChartFactory& instance() {
static ChartFactory factory;
return factory;
    }

void registerChart(const QString& type, std::function<IComponent*()> creator) {
        m_creators[type] = creator;
    }

IComponent* createChart(const QString& type) {
if (m_creators.contains(type)) {
return m_creators[type]();
        }
return nullptr;
    }

private:
ChartFactory() = default;
    QMap<QString, std::function<IComponent*()>> m_creators;
};

// Registration macro (for automatic plugin registration)
#define REGISTER_CHART(type, cls) \
    namespace { \
        struct cls##Register { \
            cls##Register() { \
                ChartFactory::instance().registerChart(#type, [](){ return new cls(); }); \
            } \
        } cls##Registrar; \
    }
Plugin Interface and Singleton Manager
// ichartplugin.h
#ifndef ICHARTPLUGIN_H
#define ICHARTPLUGIN_H

#include "ichartcomponent.h"
#include<QString>

class IChartPlugin {
public:
virtual ~IChartPlugin() = default;
virtual QString pluginName() const = 0;
virtual IComponent* createComponent() = 0;
virtual void destroyComponent(IComponent* comp) = 0;
};

// Plugin Manager (singleton)
class PluginManager {
public:
static PluginManager& instance() {
static PluginManager manager;
return manager;
    }

void loadPlugins(const QString& path) {
// Dynamically load plugin libraries (example pseudocode)
// QPluginLoader loader(path);
// if (loader.load()) {
//     IChartPlugin* plugin = qobject_cast<IChartPlugin*>(loader.instance());
//     if (plugin) m_plugins.append(plugin);
// }
    }

IComponent* createChart(const QString& pluginName) {
for (auto plugin : m_plugins) {
if (plugin->pluginName() == pluginName) {
return plugin->createComponent();
            }
        }
return nullptr;
    }

private:
PluginManager() = default;
    QList<IChartPlugin*> m_plugins;
};
4. Drag-and-Drop Implementation
Component Area (Draggable List)
// componentpanel.h
#ifndef COMPONENTPANEL_H
#define COMPONENTPANEL_H

#include<QWidget>
#include<QListWidget>
#include<QMimeData>
#include<QDragEnterEvent>
#include<QDropEvent>

class ComponentPanel : public QWidget {
    Q_OBJECT
public:
explicit ComponentPanel(QWidget* parent = nullptr) : QWidget(parent) {
        QVBoxLayout* layout = new QVBoxLayout(this);
        mListWidget = new QListWidget;
        layout->addWidget(mListWidget);

// Register supported chart types
        QStringList types = {"LineChart", "PieChart", "BarChart", "HeatMap", "RadarChart"};
for (const auto& type : types) {
            mListWidget->addItem(type);
        }
    }

protected:
void dragEnterEvent(QDragEnterEvent* event) override {
if (event->mimeData()->hasText()) {
            event->acceptProposedAction();
        }
    }

void dragMoveEvent(QDragMoveEvent* event) override {
if (event->mimeData()->hasText()) {
            event->acceptProposedAction();
        }
    }

void dropEvent(QDropEvent* event) override {
const QString type = event->mimeData()->text();
if (!type.isEmpty()) {
emit chartDragged(type);  // Send chart type to runtime area
            event->acceptProposedAction();
        }
    }

signals:
void chartDragged(const QString& type);

private:
    QListWidget* mListWidget;
};
Runtime Area (Receive Drag-and-Drop and Display Chart)
// runtimepanel.h
#ifndef RUNTIMEPANEL_H
#define RUNTIMEPANEL_H

#include<QWidget>
#include<QVBoxLayout>
#include<QMap>
#include "ichartcomponent.h"
#include "componentpanel.h"

class RuntimePanel : public QWidget {
    Q_OBJECT
public:
explicit RuntimePanel(QWidget* parent = nullptr) : QWidget(parent) {
        QVBoxLayout* layout = new QVBoxLayout(this);
setAcceptDrops(true);

// Connect component area drag signal
        ComponentPanel* compPanel = new ComponentPanel(this);
        layout->addWidget(compPanel);
connect(compPanel, &ComponentPanel::chartDragged, this, &RuntimePanel::onChartDragged);
    }

protected:
void dragEnterEvent(QDragEnterEvent* event) override {
if (event->mimeData()->hasText()) {
            event->acceptProposedAction();
        }
    }

void dropEvent(QDropEvent* event) override {
const QString type = event->mimeData()->text();
if (!type.isEmpty()) {
createChart(type);
            event->acceptProposedAction();
        }
    }

private slots:
void onChartDragged(const QString& type) {
createChart(type);
    }

private:
void createChart(const QString& type) {
        IComponent* chart = ChartFactory::instance().createChart(type);
if (chart) {
            chart->setData(generateSampleData());  // Set sample data
            m_charts.append(chart);
layout()->addWidget(chart);
        }
    }

QVariantMap generateSampleData() {
// Generate sample data (adjust based on chart type)
return {
            {"x", QVector<double>() << 1 << 2 << 3 << 4},
            {"y", QVector<double>() << 10 << 20 << 15 << 25}
        };
    }

QVBoxLayout* layout() { return qobject_cast<QVBoxLayout*>(this->layout()); }
    QList<IComponent*> m_charts;
};
5. Right-Click Edit Function Implementation
// Add right-click menu support in IComponent subclasses
// Example: LineChart
void LineChart::contextMenuEvent(QContextMenuEvent* event) {
    QDialog* dialog = createParameterDialog(this);
if (dialog->exec() == QDialog::Accepted) {
updateChart();  // Refresh chart after applying parameters
    }
    dialog->deleteLater();
}

// Forward right-click events in runtime area components
void RuntimePanel::contextMenuEvent(QContextMenuEvent* event) {
    QWidget* child = childAt(event->pos());
if (IComponent* chart = qobject_cast<IComponent*>(child)) {
        chart->contextMenuEvent(event);  // Forward right-click event to chart component
    }
}
3. Plugin Development Example (Hot Plug Implementation)
1. Plugin Interface Implementation (Example: Pie Chart Plugin)
// piechartplugin.h
#ifndef PIECHARTPLUGIN_H
#define PIECHARTPLUGIN_H

#include "ichartplugin.h"
#include "piechart.h"

class PieChartPlugin : public IChartPlugin {
public:
QString pluginName() const override { return "PieChart"; }
IComponent* createComponent() override { return new PieChart(); }
void destroyComponent(IComponent* comp) override { delete comp; }
};

// Export plugin (Windows use __declspec(dllexport))
#if defined(PieChartPlugin_EXPORTS)
#define PIECHARTPLUGIN_API __declspec(dllexport)
#else
#define PIECHARTPLUGIN_API __declspec(dllimport)
#endif

extern "C" PIECHARTPLUGIN_API IChartPlugin* createPlugin() {
return new PieChartPlugin();
}
4. System Deployment and Usage
-
Compile Plugins: Compile each chart plugin into a dynamic library (.dll/.so) and place it in the specified plugin directory.
-
Load Plugins: The main program loads all plugins at startup using
<span>PluginManager::instance().loadPlugins("plugins/")</span>. -
Drag-and-Drop Operation: Drag chart types from the component area to the runtime area to automatically generate the corresponding chart.
-
Parameter Editing: Right-click on the chart in the runtime area to open the parameter dialog, modify it, and click “OK” to update the chart.