First
Eight
Performing Sliding T-Test Using MATLAB
—— Complete Code at the End
Star
System
Author: Eighth Star System – Stone Man
Email: [email protected]

Performing Sliding T-Test Using MATLAB

clc;clear;close all;

%%   Read Data
load data.mat         % Read data
time = data(:,1);     % Time series data
sw = data(:,2);       % Corresponding data
Sliding T-Test

step = 3; n1 = 3; n2 = 3;     % Set subsequence step size
v = step+step-2;              % Degrees of freedom
t=[];
ttest=2.78; % alpha=0.05, t-value=2.78 when degrees of freedom=4
for i = 1:length(time)-step-step+1
    x1 = sw(i:i+step-1);
    x2 = sw(i+step:i+step+step-1);
    meanx1 = mean(x1);
    meanx2 = mean(x2);
    a = meanx1-meanx2;
    b = (n1+n2)/(n1*n2);
    varx1 = var(x1);
    varx2 = var(x2);
    c= (n1*varx1+n2*varx2)/(n1+n2-2);
    t1=a/sqrt(c*b);
    t=cat(1,t,t1);            % Concatenate by column (same number of columns)
end
Plotting

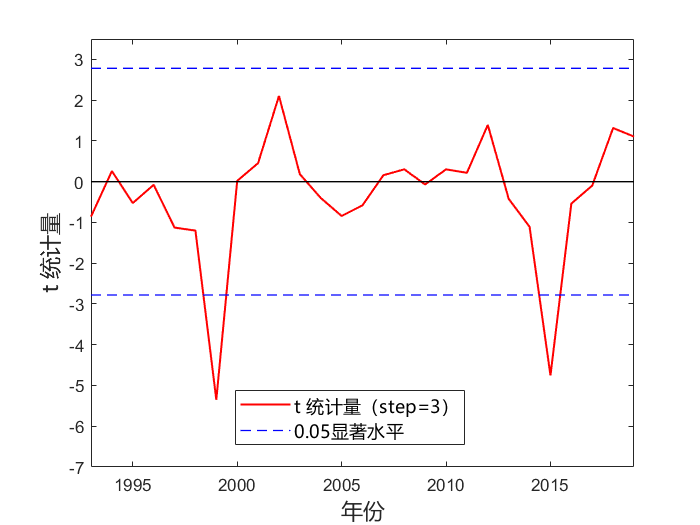
x = time(step:length(time)-step);
figure(2)
plot(x,t,'r-','linewidth',1.2)
axis([min(x),max(x),-7,3.5]);
xlabel('Year','fontname','微软雅黑','FontSize',13);
ylabel('t Statistic','fontname','微软雅黑','FontSize',13);
hold on
plot(xlim,[ttest, ttest],'b--','linewidth',0.8)
hold on
plot(xlim,[-ttest, -ttest],'b--','linewidth',0.8)
hold on
plot(xlim,[0, 0],'k-','linewidth',0.8)
legend('t Statistic (step=3)','0.05 Significance Level','fontname','微软雅黑','FontSize',11,'Position',[0.35 0.18 0.3 0.05]);
Image

Complete Code

%% Performing Sliding T-Test Using MATLAB
clc;clear;close all;

%%   Read Data
load data.mat                                        % Read data
time = data(:,1);                                    % Time series data
sw = data(:,2);                                      % Corresponding data

%%  Sliding T-Test
step = 3; n1 = 3; n2 = 3;                            % Set subsequence step size
v = step+step-2;                                     % Degrees of freedom
t=[];
ttest=2.78;                                          % alpha=0.05, t-value=2.78 when degrees of freedom=4
for i = 1:length(time)-step-step+1
    x1 = sw(i:i+step-1);
    x2 = sw(i+step:i+step+step-1);
    meanx1 = mean(x1);
    meanx2 = mean(x2);
    a = meanx1-meanx2;
    b = (n1+n2)/(n1*n2);
    varx1 = var(x1);
    varx2 = var(x2);
    c= (n1*varx1+n2*varx2)/(n1+n2-2);
    t1=a/sqrt(c*b);
    t=cat(1,t,t1);                                   % Concatenate by column (same number of columns)
end

x = time(step:length(time)-step);
figure(2)
plot(x,t,'r-','linewidth',1.2)
axis([min(x),max(x),-7,3.5]);
xlabel('Year','fontname','微软雅黑','FontSize',13);
ylabel('t Statistic','fontname','微软雅黑','FontSize',13);
hold on
plot(xlim,[ttest, ttest],'b--','linewidth',0.8)
hold on
plot(xlim,[-ttest, -ttest],'b--','linewidth',0.8)
hold on
plot(xlim,[0, 0],'k-','linewidth',0.8)
legend('t Statistic (step=3)','0.05 Significance Level','fontname','微软雅黑','FontSize',11, ...
    'Position',[0.35 0.18 0.3 0.05]);
Data: Time series data
How to Obtain Data for This Article:

Reply to the public account:
“Sliding T-Test Using MATLAB”


Scan to Join the Group and join us,
The data will be sent to Group Files.

Editor of This Article: Zhou You