Hello everyone, today I would like to share an article published in the Journal of the American Society for Mass Spectrometry titled “Mass Spectrometry-Driven Epitope Mapping: Application of Diethylpyrocarbonate Covalent Labeling for the Immunotherapeutic Target Programmed Cell Death Protein 11“. The corresponding author of the article is Professor Patanachai K. Limpikirati from Chulalongkorn University in Thailand.
Monoclonal antibodies (mAbs) have shown great promise in treating various diseases, including cancer. Among them, anti-programmed cell death protein 1 (PD1) monoclonal antibodies have become key players in cancer immunotherapy and are currently among the best-selling cancer drugs. The development of novel and biosimilar anti-PD1 monoclonal antibodies is crucial for improving their efficacy, availability, and affordability, benefiting public health systems and patients. Epitope mapping is a critical step in confirming the binding sites of antibodies to antigens, assessing efficacy and immunogenicity, and is essential for demonstrating epitope novelty, evaluating binding characteristics, and predicting immunogenicity.
Epitope mapping can be accomplished through traditional high-resolution structural techniques such as X-ray crystallography or cryo-electron microscopy (Cryo-EM). However, X-ray crystallography is often costly and time-consuming, while Cryo-EM requires a large amount of sample and expensive equipment. Meanwhile, structural mass spectrometry is also a powerful technique for analyzing protein binding epitopes, with commonly used labeling techniques including hydrogen-deuterium exchange (HDX), cross-linking, and covalent labeling (CL). Diethylpyrocarbonate (DEPC) covalent labeling-mass spectrometry (CL-MS) technology can selectively label nucleophilic residues (His, Lys, Ser, Thr, Tyr) at the N-terminus, offering advantages such as stable labeling, easily interpretable results, low sample requirements, and short cycles. It has been validated on proteins such as TNF-α, and this study extends its application to PD-1 for the first time, aiming to establish and optimize a DEPC CL-MS method for PD-1 epitope identification.
The authors identified and compared the binding sites of two anti-PD-1 antibodies (nivolumab and a novel antibody CU-MAB) with PD-1. They first demonstrated the sequence coverage of PD1 and the structural coverage of DEPC labeling (Figure 1). PD1 is a recombinant protein composed of 154 amino acids, with a molecular weight of approximately 17.4 kDa, containing 17 trypsin and 24 chymotrypsin recognition sites, facilitating efficient proteolytic digestion. Additionally, it contains 30 DEPC-modifiable amino acids (excluding the histidine tag sequence), covering a large portion of the protein structure, making it highly suitable for structural analysis using DEPC CL-MS. In experiments, it was found that using a bottom-up approach, PD1 achieved approximately 86% to 90% sequence coverage (132 to 139 out of 154 amino acids), and DEPC labeling produced about 9% to 16% structural coverage (14 to 25 out of 154 amino acids), indicating the feasibility of this method.
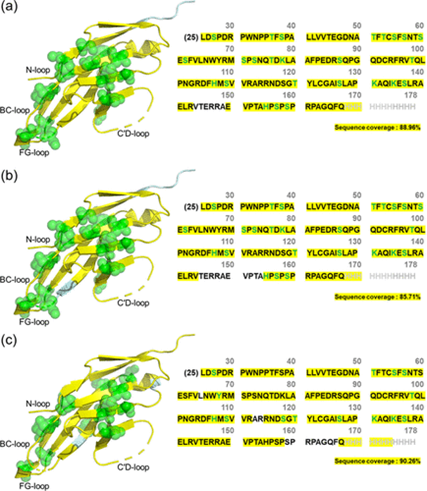
Figure 1 Sequence coverage of PD1 (yellow) and structural coverage of DEPC labeling (green spheres) (PDB ID: 3RRQ), in the presence of (a) W6/32, an anti-human leukocyte antigen mAb (non-binding mAb), (b) nivolumab, and (c) CU-MAB (anti-PD1 mAb). Approximately 86% to 90% sequence coverage represents a range of combined sequence coverages, with each sequence coverage calculated based on all replicates in each group (PD1/nivolumab complex, PD1/CU-MAB complex, or PD1 and W6/32 mAb).
The authors analyzed the DEPC modification levels of PD1 in the presence and absence of nivolumab to identify binding sites and conformational changes upon antibody binding. Significant changes were observed in the modification levels of 16 out of 25 labeled amino acids between the two states (Figure 2a), with increases in labeling at S27, T51, S57, S62, K78, S87, K135, H155/S159, and H168/H169, while decreases were noted at T36, T53, S60, T76, H107, K131, and S157. These changes indicate alterations in surface accessibility or local microenvironment following nivolumab binding. To validate these findings, the authors compared the DEPC CL-MS results with previously reported PD1 epitopes associated with nivolumab binding. S27, S60, S62, and K131 were consistent with reported epitopes. Additionally, S62, located near T59 and S60 in the crystal structure, also showed significant changes in %CL, indicating their involvement in epitope-paratope interactions (Figure 2b).
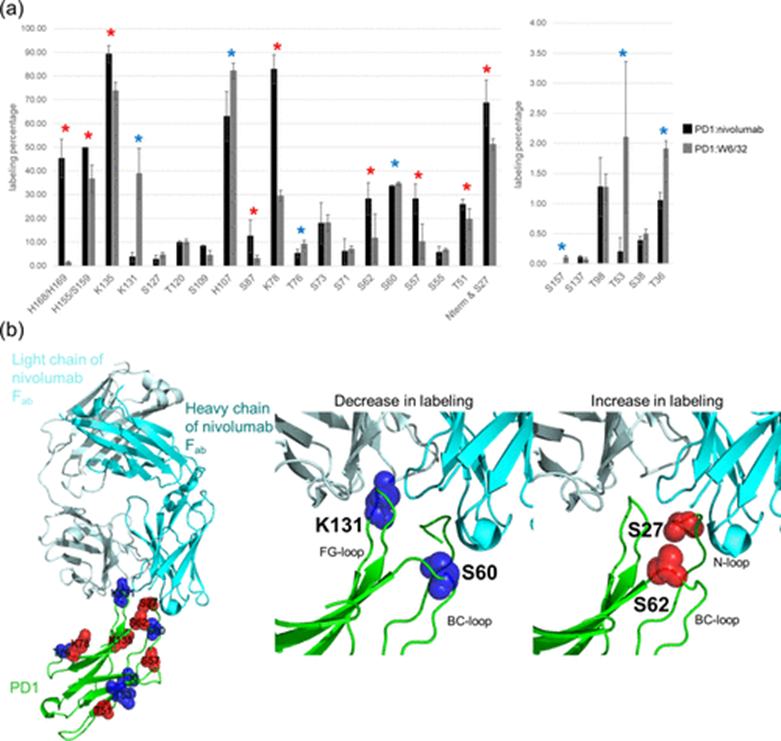
Figure 2 DEPC CL-MS epitope mapping of PD1 in complex with nivolumab (PDB ID: 5WT9). (a) Changes in DEPC modification levels (%CL) of PD1 residues when bound to nivolumab. Red stars indicate residues with increased labeling, while blue stars indicate residues with decreased labeling. Statistical significance was determined using a t-test with p < 0.10. (b) Structural representation of PD1 (green) in complex with nivolumab (cyan and light cyan), highlighting DEPC CL-MS identified epitope and non-epitope residues. Red spheres indicate residues with increased %CL, while blue spheres indicate residues with decreased %CL.
Similarly, the authors analyzed the DEPC modification levels of PD1 in the presence and absence of CU-MAB, noting an increase in labeling at S127, while decreases were observed at S27 and K131 (Figure 3a). To assess these findings, the authors compared the DEPC CL-MS results with AlphaFold predicted epitopes. The N-, BC-, and FG-loops, as well as the C and C’ chains of PD1, are critical for CU-MAB binding. Notably, residues S27, S127, and K131 exhibited significant changes in %CL, consistent with these key regions, indicating their potential involvement in epitope-paratope interactions (Figure 3b). The increase in %CL at residue S127 suggests a more hydrophobic microenvironment at the PD1/CU-MAB binding interface. Conversely, the decrease in %CL at residues S27 and K131 indicates that these residues are protected from labeling, likely due to direct interactions with CU-MAB. These findings highlight the binding regions of CU-MAB with PD-1, providing potential targets for further functional studies and therapeutic development.
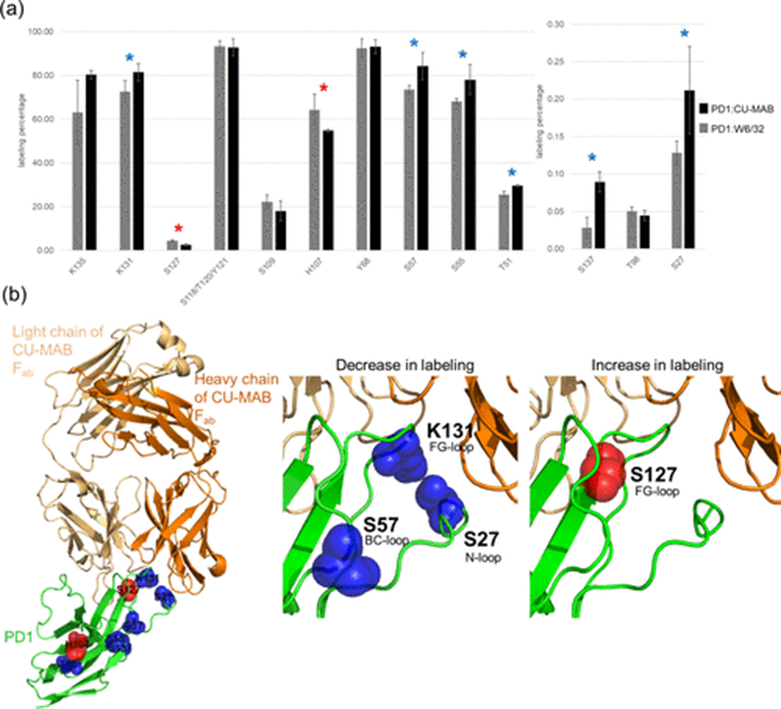
Figure 3 DEPC CL-MS epitope mapping of PD1 in complex with CU-MAB. (a) Changes in DEPC modification levels (%CL) of PD1 residues when bound to CU-MAB. Red stars indicate residues with increased labeling, while blue stars indicate residues with decreased labeling. Statistical significance was determined using a t-test with p < 0.10. (b) AlphaFold structural prediction of PD1 (green) in complex with CU-MAB (orange and light orange), highlighting DEPC CL-MS identified epitope and non-epitope residues. Red spheres indicate residues with increased %CL, while blue spheres indicate residues with decreased %CL.
Overall, this study demonstrates the feasibility of using DEPC CL-MS for epitope mapping, particularly in studying the interactions of PD1 with various antibodies in solution, validating DEPC CL-MS as a reliable and efficient tool in therapeutic antibody development, which is crucial for advancing immuno-oncology research. DEPC CL-MS can provide detailed information on solvent accessibility and microenvironment changes, complementing X-ray crystallography, AlphaFold predictions, and HDX-MS results. However, DEPC CL-MS still has certain limitations, particularly for antibody/antigen complexes without other experimental structural information, including structural coverage limitations, potential labeling loss, and poor %CL reproducibility.
Written by: Liang Zixin
Edited by: Li Huilin
Article citation:Mass Spectrometry-Driven Epitope Mapping: Application of Diethylpyrocarbonate Covalent Labeling for the Immunotherapeutic Target Programmed Cell Death Protein
Li Huilin’s research group websitewww.x-mol.com/groups/li_huilinReferences
[1] Ramanandana P, Pianpaktr P, Makjaroen J, Wongtangprasert T, Kirsch ZJ, Graban EM, Vachet RW, Somparn P, Pisitkun T, Limpikirati PK. Mass Spectrometry-Driven Epitope Mapping: Application of Diethylpyrocarbonate Covalent Labeling for the Immunotherapeutic Target Programmed Cell Death Protein 1. J Am Soc Mass Spectrom. 2025 Jul 2;36(7):1480-1492.