A server running on a Linux operating system exhibits various parameter information, which can often help quickly locate and track issues.
Here are just a few simple tools to view system-related parameters. Many tools work by analyzing data from /proc and /sys, while more detailed and professional performance monitoring and tuning may require more specialized tools (such as perf, systemtap, etc.) and techniques. After all, system performance monitoring is a vast field.
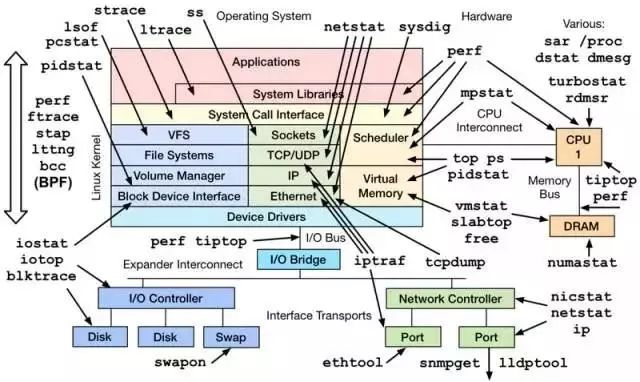
1. CPU and Memory Metrics
1.1 top
➜ ~ top
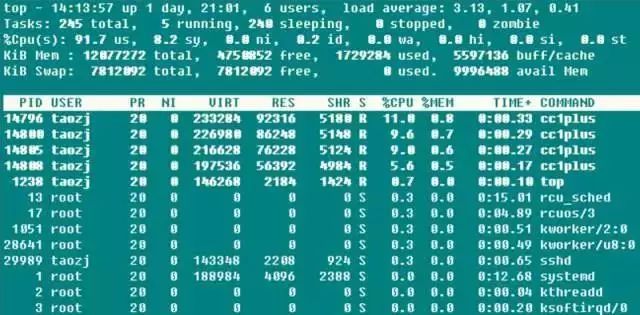
The three values after the first line represent the system’s average load over the previous 1, 5, and 15 minutes. This can indicate whether the system load is increasing, stable, or decreasing. When this value exceeds the number of CPU executable units, it indicates that the CPU’s performance has become saturated and is a bottleneck.
The second line summarizes the system’s task status information. “running” is self-explanatory, including tasks currently running on the CPU and those scheduled to run; “sleeping” typically refers to tasks waiting for events (such as I/O operations) to complete, which can be further divided into interruptible and uninterruptible types; “stopped” refers to tasks that have been paused, usually by sending SIGSTOP or by operating a foreground task with Ctrl-Z; “zombie” tasks are terminated processes whose resources will be automatically reclaimed, but the task descriptor containing the exit status must be accessed by the parent process to be released. This type of process appears as “defunct” and should be carefully monitored for potential design flaws in the program, especially if the parent process exits prematurely or fails to call wait.
The third line shows CPU usage rates categorized as follows:
√ (us) user: Time spent by the CPU in user mode with a low nice value (high priority) (nice <= 0). Normally, as long as the server is not idle, most of the CPU time should be spent executing such programs.
√ (sy) system: Time spent by the CPU in kernel mode, where the operating system transitions from user mode to kernel mode via system calls to perform specific services. Typically, this value is small, but it can increase significantly during I/O-intensive operations.
√ (ni) nice: Time spent by the CPU in user mode with a high nice value (low priority) (nice > 0). By default, newly started processes have a nice value of 0 and will not be counted here unless manually modified using renice or setpriority().
√ (id) idle: Time spent by the CPU in an idle state (executing kernel idle handler).
√ (wa) iowait: Time spent waiting for I/O to complete.
√ (hi) irq: Time consumed by the system handling hardware interrupts.
√ (si) softirq: Time consumed by the system handling soft interrupts. Remember that soft interrupts are divided into softirqs, tasklets (which are a special case of the former), and work queues. It is unclear which of these times are being counted, as the execution of work queues is no longer in the interrupt context.
√ (st) steal: This is only meaningful in a virtual machine context, as the CPU is sharing the physical CPU. This time indicates how long the virtual machine is waiting for the hypervisor to schedule the CPU, meaning that during this time, the hypervisor has allocated CPU resources to other CPUs, and this CPU resource is considered “stolen.” This value is not 0 on my KVM VPS machine, but it is only around 0.1, which might indicate overselling of the VPS.
A high CPU usage rate often indicates various issues, providing a corresponding troubleshooting approach for high server CPU usage:
√ When the user rate is too high, it usually means that certain individual processes are consuming a lot of CPU. This can be easily identified using top; if the program is suspected to be abnormal, tools like perf can be used to find hotspot functions for further investigation.
√ When the system rate is too high, if there are many I/O operations (including terminal I/O), this may cause high CPU usage in this area, such as on file servers or database servers. Otherwise (e.g., >20%), it is likely that some parts of the kernel or driver modules have issues.
√ When the nice rate is too high, it is usually intentional behavior. The initiator of the process knows that certain processes are consuming high CPU and sets their nice value to ensure they do not overwhelm other processes’ requests for CPU usage.
√ When the iowait rate is too high, it usually indicates that certain programs have low I/O operation efficiency, or that the performance of the I/O devices is so low that read/write operations take a long time to complete.
√ When the irq/softirq rate is too high, it is likely that some peripherals are malfunctioning, leading to a large number of IRQ requests. In this case, checking the /proc/interrupts file can help investigate the issue.
√ When the steal rate is too high, it may indicate that the vendor has oversold the virtual machine!
The fourth and fifth lines provide information about physical and virtual memory (swap space):
total = free + used + buff/cache. Now, the information for buffers and cached memory is combined, but the relationship between buffers and cached memory is not clearly defined in many places. In fact, by comparing the data, these two values correspond to the Buffers and Cached fields in /proc/meminfo: Buffers refer to raw disk block caching, primarily caching file system metadata (such as superblock information), and this value is generally small (around 20M); Cached refers to read caching for specific files to increase file access efficiency.
The avail Mem is a new parameter indicating how much memory space can be allocated to newly started programs without swapping, roughly equivalent to free + buff/cached, which supports the previous statement that free + buffers + cached Mem is the truly available physical memory. Additionally, using swap space is not necessarily a bad thing, so the swap usage rate is not a serious parameter. However, frequent swap in/out is not good, indicating a shortage of physical memory.
Finally, there is a list of resource usage for each program, where the CPU usage is the total usage across all CPU cores. Typically, when executing top, the program itself will read /proc extensively, so the top program itself will usually rank high in resource usage.
While top is very powerful, it is typically used for real-time monitoring of system information in the console and is not suitable for long-term (days or months) monitoring of system load information. Additionally, it may miss short-lived processes and fail to provide statistical information.
1.2 vmstat
vmstat is another commonly used system monitoring tool aside from top. The screenshot below shows the system load while compiling boost with the -j4 option.
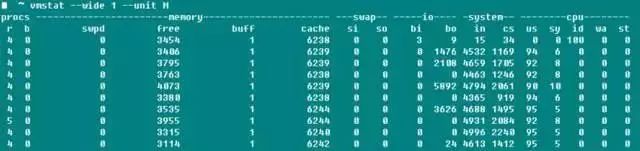
r indicates the number of runnable processes, and the data is roughly consistent; b indicates the number of uninterruptible sleeping processes; swpd indicates the amount of virtual memory used, which corresponds to the Swap-used value in top. As the manual states, typically the number of buffers is much smaller than cached memory, with buffers generally around 20M; the I/O domain’s bi and bo indicate the number of blocks received from and sent to the disk per second (blocks/s); the system domain’s in indicates the number of system interrupts per second (including clock interrupts), and cs indicates the number of context switches caused by process switching.
Speaking of this, I recall that many people used to be confused about whether the -j parameter when compiling the Linux kernel refers to CPU cores or CPU cores + 1. By monitoring with vmstat while modifying the -j parameter value to compile boost and the Linux kernel, I found that the context switch remained basically unchanged in both cases, and only significantly increased when the -j value was increased significantly. Therefore, there is no need to be overly concerned about this parameter, although I have not yet tested the specific compilation time. It is said that if the context switch exceeds 100,000 when not in system startup or benchmark state, the program definitely has issues.
1.3 pidstat
If you want to comprehensively track a specific process, nothing is more suitable than pidstat—stack space, page faults, voluntary and involuntary context switches, and other information are all at your fingertips. The most useful parameter for this command is -t, which lists detailed information about each thread in the process.
-r: Displays page fault and memory usage status. A page fault occurs when a program needs to access a page mapped in virtual memory that has not yet been loaded into physical memory. There are two main types of page faults:
√ minflt/s refers to minor faults, which occur when the physical page needed is already in physical memory for some reason (such as shared pages, caching mechanisms, etc.) but is not referenced in the current process’s page table. The MMU only needs to set the corresponding entry, which is a relatively small cost.
√ majflt/s refers to major faults, where the MMU needs to allocate a free physical page from the currently available physical memory (if no free pages are available, it must swap out other physical pages to free up a physical page) and then load data from external sources into that physical page and set the corresponding entry. This cost is significantly higher, with several orders of magnitude difference from the former.
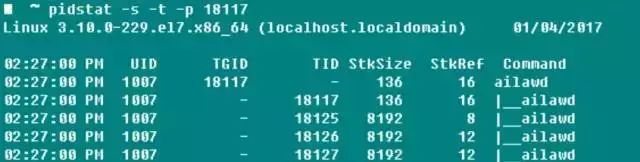
-s: Stack usage status, including StkSize for the stack space reserved for threads and StkRef for the actual stack space used. Using ulimit -s, I found that the default stack space on CentOS 6.x is 10240K, while on CentOS 7.x and Ubuntu series, the default stack space size is 8196K.
-u: CPU usage status, with parameters similar to those mentioned earlier.
-w: Number of thread context switches, further divided into cswch/s for voluntary switches due to waiting for resources and nvcswch/s for involuntary switches caused by CPU time.
If you always have to first get the program’s PID using ps before operating pidstat, it can be cumbersome. Therefore, the powerful -C option allows you to specify a string, and if the Command contains that string, the program’s information will be printed and summarized. The -l option can display the full program name and parameters.
➜ ~ pidstat -w -t -C “ailaw” -l
Thus, when checking a single task, especially a multi-threaded one, pidstat is more effective than the commonly used ps!
1.4 Others
When needing to monitor a single CPU, in addition to htop, you can also use mpstat to check whether the workload is balanced across the various cores in an SMP processor and whether there are any hotspot threads occupying a core.
➜ ~ mpstat -P ALL 1
If you want to directly monitor the resources used by a specific process, you can either use top -u taozj to filter out unrelated processes from other users or use the following method to select, where the ps command can customize the information to be printed:
while :; do ps -eo user,pid,ni,pri,pcpu,psr,comm | grep ‘ailawd’; sleep 1; done
If you want to clarify the inheritance relationship, a commonly used parameter can be used to display the process tree structure, which is much more detailed and visually appealing than pstree.
➜ ~ ps axjf
2. Disk I/O Metrics
iotop can visually display the real-time disk read rates of various processes and threads; lsof can not only show the open information of ordinary files (users) but also the open information of device files like /dev/sda1. For example, when a partition cannot be unmounted, lsof can be used to find out the usage status of that disk partition, and adding the +fg parameter can also display the file open flag.
2.1 iostat
➜ ~ iostat -xz 1
Whether using iostat -xz 1 or sar -d 1, the important parameters for the disk are:
√ avgqu-s: The average length of the wait queue for I/O requests sent to the device. For a single disk, if the value > 1, it indicates that the device is saturated, except for logical disks in multiple disk arrays.
√ await (r_await, w_await): The average wait time (ms) for each device I/O request operation, including the time spent in the queue and the service time.
√ svctm: The average service time (ms) for I/O requests sent to the device. If svctm is close to await, it indicates that there is almost no I/O wait, and the disk performance is good. Otherwise, if the disk queue wait time is long, the disk response is poor.
√ %util: The utilization of the device, indicating the percentage of time used for I/O work per second. For a single disk, when %util > 60%, performance will decline (reflected in an increase in await). When it approaches 100%, the device is saturated, except for logical disks in multiple disk arrays.
Additionally, although the monitored disk performance may be poor, it does not necessarily impact the application’s response. The kernel typically uses asynchronous I/O techniques and read/write caching to improve performance, but this is constrained by the limitations of physical memory mentioned above.
These parameters are also applicable to network file systems.
3. Network Metrics
The importance of network performance for servers is self-evident. The tool iptraf can visually display the send/receive speed information of the network card, and a similar throughput information can be obtained conveniently through sar -n DEV 1. Network cards are typically equipped with maximum rate information, such as 100Mbps or 1Gbps, making it easy to check the utilization of the device.
Typically, the transmission rate of the network card is not the primary concern in network development; rather, it is the packet loss rate, retransmission rate, and network latency for specific UDP and TCP connections that are of interest.
3.1 netstat
➜ ~ netstat -s
This displays the overall data information for each protocol since the system was started. Although the parameter information is rich and useful, it is cumulative, and unless the difference between two runs is calculated, the current network status information cannot be obtained. Alternatively, using watch can visually observe the trend of value changes. Therefore, netstat is typically used to check port and connection information:
netstat –all(a) –numeric(n) –tcp(t) –udp(u) –timers(o) –listening(l) –program(p)
–timers can cancel reverse domain name queries to speed up display; commonly used commands include:
➜ ~ netstat -antp # List all TCP connections ➜ ~ netstat -nltp # List all local TCP listening sockets, do not add the -a parameter
3.2 sar
The sar tool is incredibly powerful, managing everything from CPU, disk, to page swapping. Here, using -n is mainly to analyze network activity, although it also provides detailed data information for various layers and protocols, including NFS, IP, ICMP, SOCK, etc. We only care about TCP and UDP. The following command displays the usual segment and datagram send/receive situation, as well as:
TCP
➜ ~ sudo sar -n TCP,ETCP 1
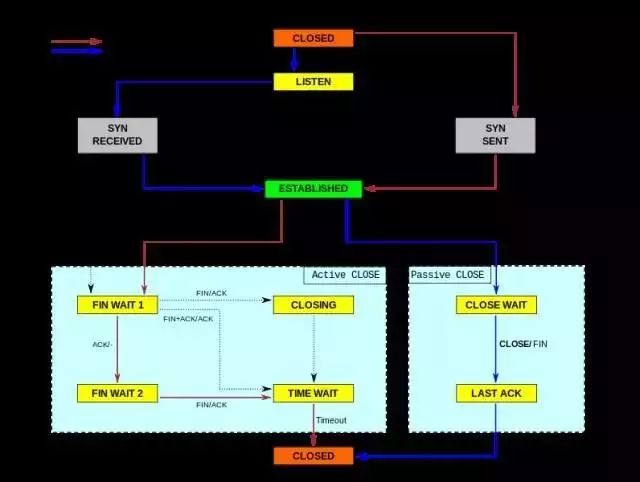
√ active/s: TCP connections initiated locally, such as through connect(), where the TCP state transitions from CLOSED -> SYN-SENT.
√ passive/s: TCP connections initiated remotely, such as through accept(), where the TCP state transitions from LISTEN -> SYN-RCVD.
√ retrans/s (tcpRetransSegs): The number of TCP retransmissions per second, which typically occurs in cases of poor network quality or server overload, where packet loss triggers retransmission based on TCP’s acknowledgment mechanism.
√ isegerr/s (tcpInErrs): The number of erroneous packets received per second (e.g., checksum failures).
UDP
➜ ~ sudo sar -n UDP 1
√ noport/s (udpNoPorts): The number of datagrams received per second that have no application listening on the specified destination port.
√ idgmerr/s (udpInErrors): The number of datagrams received by the local machine that cannot be dispatched for reasons other than the above.
Of course, these data can indicate network reliability to some extent, but they only become meaningful when combined with specific business requirements.
3.3 tcpdump
tcpdump is undoubtedly a great tool. Everyone knows that when debugging locally, Wireshark is preferred, but what about when issues arise on the online server?
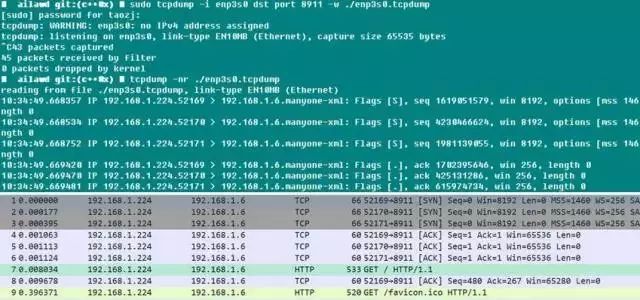
The reference materials in the appendix provide a solution: recreate the environment, use tcpdump to capture packets, and when the issue reoccurs (for example, when logs show or a certain state appears), you can stop the capture. Tcpdump itself has -C/-W parameters to limit the size of the stored packet capture files, and when this limit is reached, the saved packet data will automatically rotate, keeping the total number of captured packets manageable. Afterward, the packet data can be analyzed offline using Wireshark as desired, which is quite convenient! Although tcpdump does not have a GUI, its packet capture functionality is not lacking; it can specify network cards, hosts, ports, protocols, and various filtering parameters, capturing packets that are complete and timestamped, making online program data packet analysis straightforward.
Below is a small test showing that when Chrome starts, it automatically initiates three connections to the web server. Since the destination port parameter is limited here, the server’s response packets are filtered out. However, the process of establishing connections with SYN and ACK is still quite clear! When using tcpdump, it is essential to configure the capture filtering conditions as much as possible, both to facilitate subsequent analysis and because tcpdump can impact the performance of the network card and system, which in turn affects online business performance.
Author: taozj Source: https://t.1yb.co/K4OY