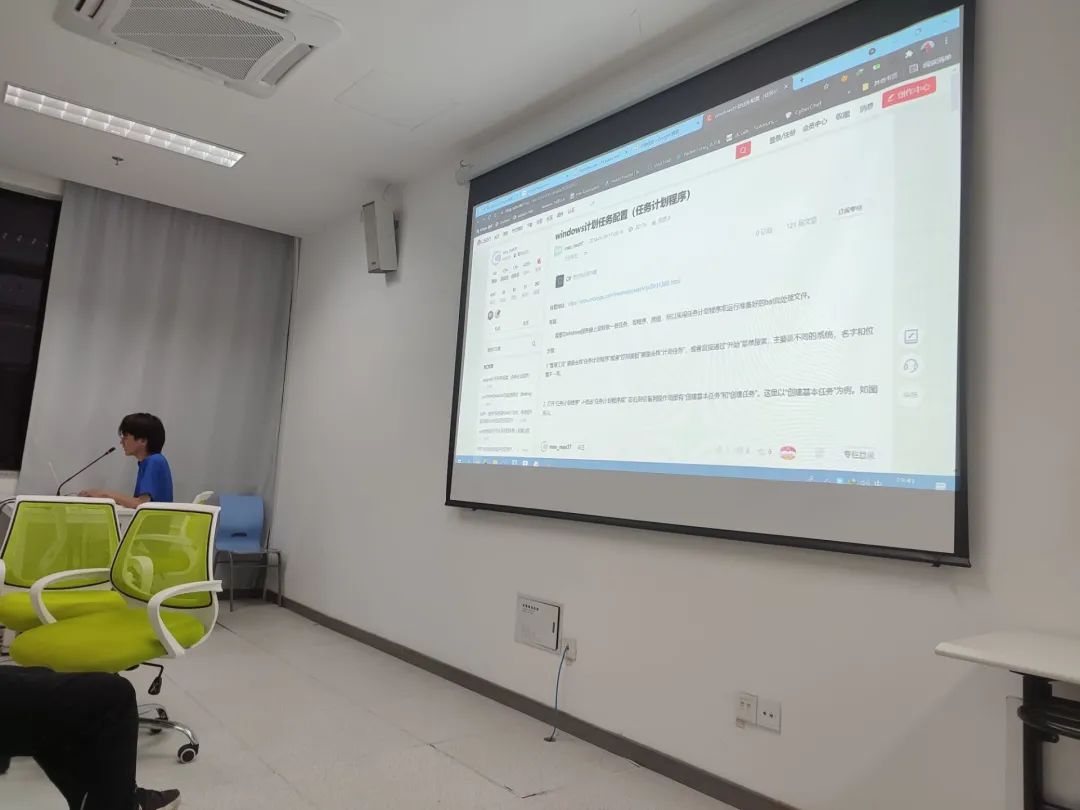
Introduction to LUNIX GDB Debugging

Today, we will mainly learn about GDB debugging under LUNIX. Generally, in Windows, we are accustomed to various debugging buttons in IDEs, which are indeed very convenient. However, in Linux, there aren’t as many IDEs to support our debugging, but Linux does have a powerful command-line debugging tool for C/C++—GDB, an open-source debugging tool provided by GNU. Although it may feel unfamiliar at first, the more we use it, the more we will come to like it. GDB offers single-step execution, stepping into functions, stepping out of functions, setting breakpoints, setting watchpoints, and viewing variables. In addition, GDB can also generate core dump files after a program crashes, which has a snapshot function that saves the program’s stack and other information when it crashes. We can conveniently find the cause of the crash by executing the core file.

Ransomware Analysis
To learn the debugging steps of GDB, we first need to review the debugging steps in an IDE. When debugging a program in a Windows IDE, such as using VS, there are generally the following operations: compile and start the program in Debug mode, run the program and encounter errors, set breakpoints to analyze the error location, single-step through the program (including: step over, step into functions, step return), run at full speed, print or monitor variables, freeze or unfreeze threads, and other debugging techniques. In IDEs, these steps typically have fixed buttons available for us, making it very simple and convenient. We just need to practice more, and debugging programs in a graphical interface will not be difficult. However, debugging programs using commands in Linux is much more complex than using a graphical interface.
As a side note, do you know what a true debugging expert looks like? They have a deep understanding of computer principles and the logic of the program itself. In their minds, they can simulate the program’s execution process and know where errors might occur, so they don’t even need to set breakpoints, and their bug hit rate is quite high.

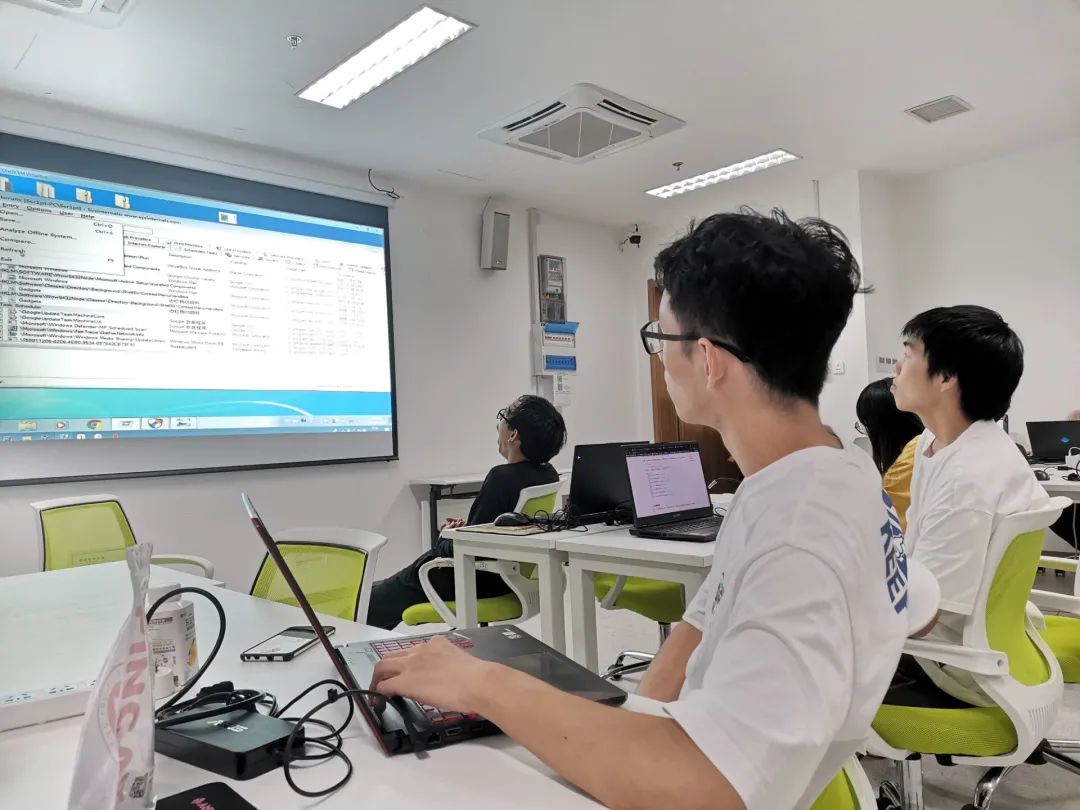
Students Listening Attentively
Let’s get back to the main topic and introduce the command-line debugging process in Linux. Since GDB debugging steps in Linux involve using the command line, it means typing commands to debug the program. Generally, it can be divided into the following steps, which will be detailed later: compile a debuggable program, run the program, set breakpoints, single-step debugging, monitor variables, visualize debugging, and other debugging techniques. It can be seen that the process is quite similar to IDE debugging, but the actual operations are vastly different. It’s not just about pressing buttons; rather, it involves typing commands to debug the program, which is equivalent to learning the principles behind those debugging buttons. Mastering this method will allow you to use an IDE for debugging without needing to learn it separately, which will be more helpful and intuitive for actual operations in future job roles.
-END-

Text | Zhu Weihai
Images | Social Practice Team
Layout | Mian
