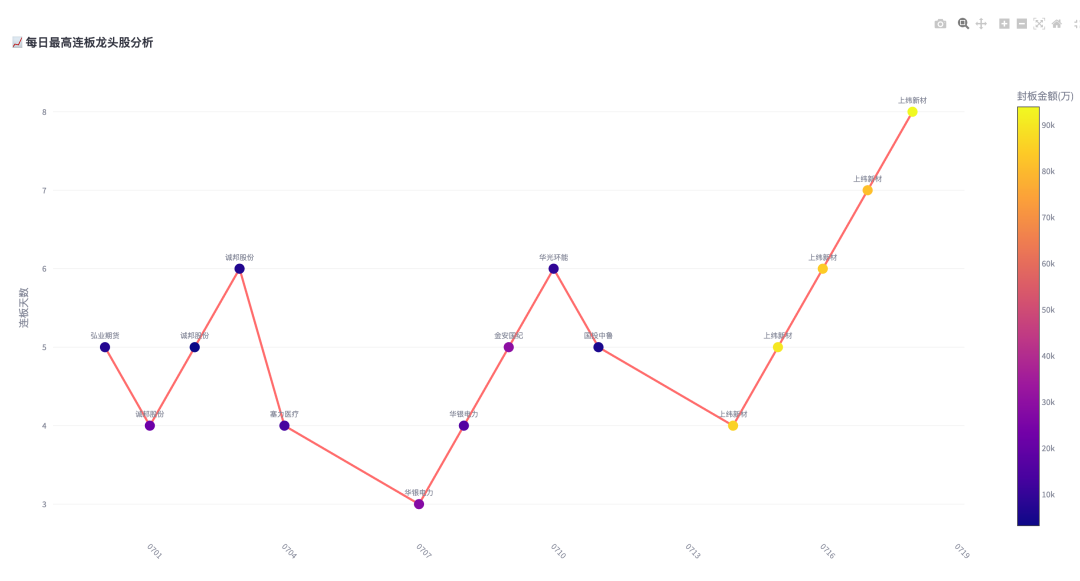
 Today is Saturday, and I spent the whole day cleaning. In the evening, I checked WeChat and found that a classmate asked me how to implement the A-share limit up highest board sorted by date.I thought about it personally, and this requirement is not too complicated. I spent half an hour to implement it simply, but the implementation below is not the best way. I will explain the reasons later.First, here is the complete code:
import streamlit as st
from datetime import datetime, timedelta
import pywencai
import pandas as pd
import plotly.graph_objects as go
import akshare as ak
from contextlib import contextmanager

# Set global display options
pd.set_option('display.unicode.ambiguous_as_wide', True)
pd.set_option('display.unicode.east_asian_width', True)
pd.set_option('display.max_rows', None)
pd.set_option('display.max_columns', None)
pd.set_option('display.expand_frame_repr', False)
pd.set_option('display.max_colwidth', 100)

@contextmanager
def st_spinner(text="Processing..."):
    try:
        with st.spinner(text):
            yield
    finally:
        pass

def get_trading_days():
    end_date = datetime.now()
    dates = [(end_date - timedelta(days=x)).strftime('%Y%m%d') for x in range(20)]
    min_date_dt = datetime.strptime(min(dates), '%Y%m%d')
    max_date_dt = datetime.strptime(max(dates), '%Y%m%d')
    trade_date_df = ak.tool_trade_date_hist_sina()
    trade_date_df['date'] = pd.to_datetime(trade_date_df['trade_date'])
    mask = (trade_date_df['date'] >= min_date_dt) & (trade_date_df['date'] <= max_date_dt)
    return [date.strftime('%Y%m%d') for date in trade_date_df[mask]['date']]

@st.cache_data(ttl=60 * 60 )
def fetch_stock_data(date):
    query = f"Non-ST, {date} consecutive limit up days sorted, limit up reason, limit up order amount"
    try:
        data = pywencai.get(query=query)
        if data.empty or f'Limit Up Order Amount[{date}]' not in data.columns:
            return None
        max_days = data[f'Consecutive Limit Up Days[{date}]'].max()
        highest_stocks = data[data[f'Consecutive Limit Up Days[{date}]'] == max_days]
        return highest_stocks.sort_values(f'Limit Up Order Amount[{date}]', ascending=False)
    except Exception as e:
        st.error(f"Error querying data for {date}: {e}")
        return None

def create_chart(df):
    fig = go.Figure()
    fig.add_trace(go.Scatter(
        x=df['Date'],
        y=df['Consecutive Limit Up Days'],
        mode='lines+markers+text',
        line=dict(color='#FF6B6B', width=3),
        marker=dict(
            size=14,
            color=df['Limit Up Order Amount (10,000)'],
            colorscale='Plasma',
            showscale=True,
            colorbar=dict(title='Limit Up Order Amount (10,000)', x=1.05)
        ),
        text=df['Stock Abbreviation'],
        textposition='top center',
        textfont=dict(size=10),
        hovertext=[
            f"<b>{row['Stock Abbreviation']}</b><br>"
            f"Date: {row['Date'].strftime('%m%d')}<br>"
            f"Code: {row['Stock Code']}<br>"
            f"Consecutive: {row['Consecutive Limit Up Days']} days<br>"
            f"Order: {row['Limit Up Order Amount (10,000)']} ten thousand<br>"
            f"Reason: {row['Limit Up Reason']}"
            for _, row in df.iterrows()
        ],
        hoverinfo='text'
    ))
    fig.update_layout(
        title='📈 Daily Analysis of Top Limit Up Stocks',
        xaxis_title='',
        yaxis_title='Consecutive Limit Up Days',
        xaxis=dict(
            tickangle=45,
            type='date',  # Change to time axis type
            tickformat="%m%d",  # Set four-digit month-day format
            gridcolor='#f0f0f0'
        ),
        yaxis=dict(
            tickmode='linear',
            dtick=1,
            gridcolor='#f0f0f0'
        ),
        height=650,
        margin=dict(l=50, r=30, t=100, b=80),
        hoverlabel=dict(
            bgcolor='white',
            font_size=12,
            font_family="Microsoft YaHei"
        ),
        plot_bgcolor='rgba(255,255,255,0.9)',
        paper_bgcolor='rgba(255,255,255,0.8)'
    )
    return fig

def app():
    st.title('🚀 Limit Up Stock Analysis System')
    with st_spinner("Fetching latest market data..."):
        trading_days = get_trading_days()
        chart_data = []
        table_data = []
        for date in trading_days:
            stocks = fetch_stock_data(date)
            if stocks is not None and not stocks.empty:
                # Chart data takes the maximum limit up order amount
                top_stock = stocks.iloc[0]
                chart_data.append({
                    'Date': pd.to_datetime(date),
                    'Stock Abbreviation': top_stock['Stock Abbreviation'],
                    'Stock Code': top_stock['Stock Code'],
                    'Consecutive Limit Up Days': top_stock[f'Consecutive Limit Up Days[{date}]'],
                    'Limit Up Reason': top_stock[f'Limit Up Reason Category[{date}]'],
                    'Limit Up Order Amount (10,000)':  round(float(top_stock[f'Limit Up Order Amount[{date}]']) / 10000, 2)
                })
                # Table data saves all
                for _, row in stocks.iterrows():
                    table_data.append({
                        'Date': pd.to_datetime(date),
                        'Stock Abbreviation': row['Stock Abbreviation'],
                        'Stock Code': row['Stock Code'],
                        'Consecutive Limit Up Days': row[f'Consecutive Limit Up Days[{date}]'],
                        'Limit Up Reason': row[f'Limit Up Reason Category[{date}]'],
                        'Limit Up Order Amount (10,000)':  round(float(row[f'Limit Up Order Amount[{date}]']) / 10000, 2)
                    })
        if chart_data:
            df_chart = pd.DataFrame(chart_data).sort_values('Date')
            df_table = pd.DataFrame(table_data)
            df_table = df_table.sort_values('Date', ascending=False)
            # Draw chart
            st.subheader("Trend Analysis of Top Stocks")
            st.plotly_chart(create_chart(df_chart), use_container_width=True)
            # Display data table
            st.subheader("📊 Detailed Data")
            for date, group in df_table.groupby('Date', sort=False):
                with st.expander(f"{date.strftime('%Y-%m-%d')} Top Limit Up Stocks (Total {len(group)} stocks)"):
                    col1, col2 = st.columns([1, 3])
                    with col1:
                        st.metric("Highest Limit Up Days", f"{group.iloc[0]['Consecutive Limit Up Days']} days")
                    with col2:
                        st.metric("Maximum Limit Up Order Amount",
                                  f"{group['Limit Up Order Amount (10,000)'].max():.2f} ten thousand",
                                  help="Maximum limit up order amount among stocks with the same limit up height")
                    styled_df = group[['Stock Abbreviation', 'Stock Code', 'Consecutive Limit Up Days', 'Limit Up Order Amount (10,000)', 'Limit Up Reason']] \
                        .sort_values('Limit Up Order Amount (10,000)', ascending=False) \
                        .style.format({
                        'Limit Up Order Amount (10,000)': '{:.2f} ten thousand',
                        'Consecutive Limit Up Days': '{:.0f} days'
                    }) \
                        .background_gradient(subset=['Limit Up Order Amount (10,000)'], cmap='YlGn')
                    st.dataframe(
                        styled_df,
                        hide_index=True,
                        use_container_width=True,
                        column_config={
                            "Stock Code": st.column_config.TextColumn(
                                width="medium",
                                help="Click to view stock details"
                            )
                        }
                    )
        else:
            st.warning("No valid data retrieved, please try again later")

if __name__ == "__main__":
    app()
The above code implements an interactive limit up stock analysis application using tools such as Streamlit, PyWencai, Pandas, and Plotly. Investors can intuitively view the highest limit up stocks and their consecutive limit up days over the past few days, helping them make more informed decisions. The code is attached above, and you can simply open it in a regular browser and copy it.Main Dependencies
Streamlit: Used for buildingWebapplications, providing a simple interface and interactive features.
PyWencai: Used for obtaining stock market data.
Pandas: Used for data processing and analysis.
Plotly: Used for creating interactive charts.
akshare: Used for obtaining the trading calendar of the Chinese stock market.
Why is the above solution not the best? Because the frequency of pywencai.get calls is too high, which may cause issues. The best way is to store the daily highest limit up stocks in a database and then retrieve them for line chart arrangement.
To be honest, I didn’t want to write this article. After all, I am not a top player, and I generally do not choose the highest boards. Software like Tonghuashun and Dongfang Caifu have various analyses of the highest boards, which are very sophisticated. My implementation is somewhat rough.
If you are interested in the technical details of stocks, you can check my previous articles.
Related Articles Recommended:【Python Technology】Stock Calculation KDJ Golden Cross and Dead Cross Warning Signals【Python Technology】MACD Divergence Analysis of Stocks [Python Technology] Using RSI Indicator to Analyze Stock Overbought and Oversold
[Python Technology] Bollinger Bands (BOLL) Technical Indicator Stock Analysis
[Python Technology] Stock Technical Analysis of Trading Volume and Volume Ratio Indicators
【Python Technology】Stock Calculation of Maximum Drawdown Rate and Total Return Rate
【Python Technology】Adding Consecutive Limit Up Analysis Based on Tonghuashun Wencai Limit Up Analysis
If my sharing helps you in your investment, please don't hesitate to give a like and follow.