Currently, 9289 people have joined us


The latest and most comprehensive graphics card ladder chart will be updated on our site every month. By visually checking the ladder chart, one can understand how to evaluate the performance of graphics cards. Due to the high number of graphics card models released by the two major hardware manufacturers, NVIDIA and AMD, we cannot introduce the specific performance of each graphics card. Instead, we present the information in the form of a ladder chart, allowing users to intuitively understand the general performance positioning of graphics cards, which undoubtedly serves as a reference for some gamers during the purchasing process. Next, we bring you the latest graphics card ladder chart for October 2017, which has been revised and improved based on the September version.
 How to Evaluate Graphics Card Performance? Graphics Card Ladder Chart October 2017
For gamers, a discrete graphics card is essential, and the performance of the graphics card directly determines the gaming experience. By using the latest desktop graphics card ladder chart, one can quickly understand the performance ranking of various models from NVIDIA and AMD. Without further ado, here is the simplified version of the graphics card ladder chart for October 2017.
| Graphics Card Ladder Chart October 2017 (Desktop Simplified Version) | ||||||
|---|---|---|---|---|---|---|
| GeForce700 | GeForce900 | GeForce1000 | Graphics Card Level | Radeon RX500 | Radeon R400 | Radeon R300 |
| TITAN Xp | High-End | |||||
| GTX1080 Ti | Redeno Pro Duo | |||||
| GTX Titan Z | Titan X | |||||
| GTX 1080 | RX VEGA 64 Water-Cooled Version | |||||
| GTX Titan X | GTX 1070 | RX VEGA 64 | R9 Fury X | |||
| GTX 980 Ti | RX VEGA 56 | R9 Nano | ||||
| GTX 980 | RX 580 8G Version | R9 Fury | ||||
| GTX 780 Ti | GTX1060 6G Version | R9 390X | ||||
| GTX Titan | Mid-Range | RX 580 4G Version | RX 480 | R9 390 | ||
| GTX 780 | GTX 970 | GTX1060 3G Version | RX 570 8G Version | RX 470 | ||
| RX 570 4G Version | ||||||
| RX 470D | ||||||
| GTX770 | ||||||
| GTX1050 Ti | R9 380X | |||||
| GTX1050 | R9 380 | |||||
| GTX 760 | GTX 960 | RX 560 4G Version | ||||
| RX 560 2G Version | R9 370X | |||||
| GTX 950 | RX 550 | |||||
| RX 460 4GB Version | R7 370 | |||||
| GTX 750Ti | Low-End | RX 460 2GB Version | ||||
| RX 540 | R7 360 | |||||
| GTX 750 | GT1030 | |||||
| GT750Ti | ||||||
| GT730 | R7 350 | |||||
| R7 340 | ||||||
| R5 340 |
The table above shows the simplified version of the desktop discrete graphics card ladder chart for October. First, let me explain what the “simplified version” means. Due to the numerous N/A graphics card models, if we were to list all models from all generations, it would appear overly complex. Additionally, many older generations of graphics cards have basically been phased out, making them less relevant for current reference. Therefore, the simplified version primarily lists the latest and recent generations of graphics card rankings, omitting outdated models.
It is worth mentioning that reports indicate that NVIDIA will release the GTX1070Ti graphics card at the end of October this year, which is expected to perform similarly to the GTX1080. Details about this new graphics card’s configuration have been leaked as follows.
The GTX1070Ti is equipped with 2432 stream processors, only 128 fewer than the GTX1080. It features 8GB of GDDR5 memory, without GDDR5X, and belongs to the new GP104-300 core.
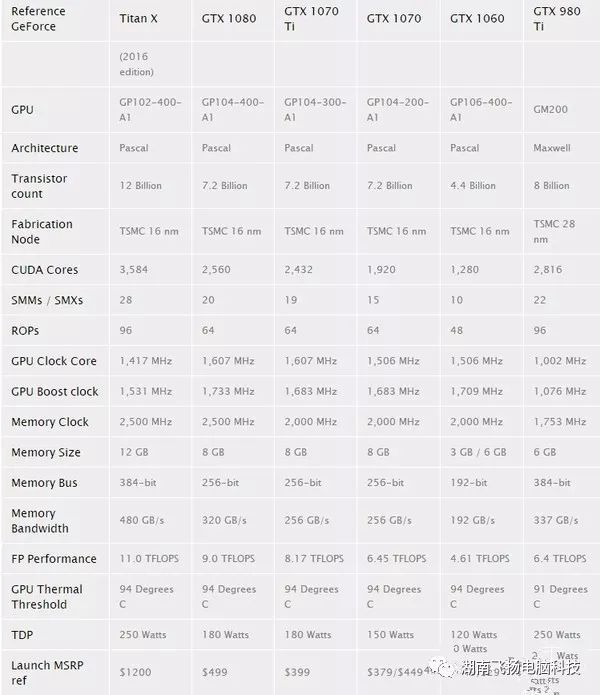 Parameters and prices as shown above appear to be quite reliable.
The official TDP of the GTX1070Ti is 180W, consistent with that of the GTX1080, considering the close number of stream processors. However, based on core frequency and memory frequency, the actual TDP of the GTX1070Ti should be slightly lower.
Given that desktop graphics cards have been quite stable recently, with very few new releases, the main new models launched in August were the RX VEGA 64/56, which are positioned as high-end discrete graphics cards. The RX VEGA 64 is available in both standard and water-cooled versions, with performance that essentially matches NVIDIA’s GTX1080, showcasing outstanding performance.
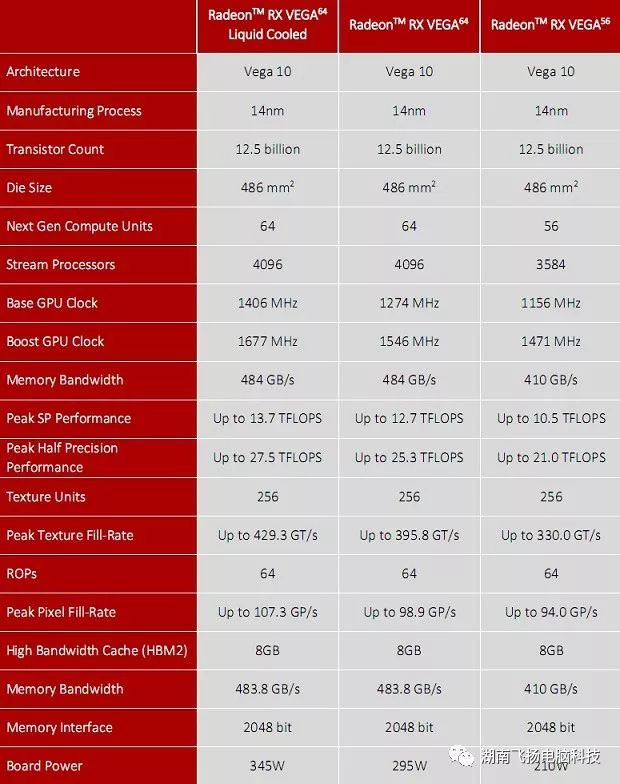 Comparative parameters of RX VEGA 64 water-cooled, RX VEGA 64 (air-cooled), and RX VEGA 56
From the graphics card parameters, the three RX VEGA 64/56 models exhibit very strong performance. In terms of pricing, the RX VEGA 64 water-cooled version is priced at 5699 yuan, the air-cooled version at 4899 yuan, and the RX VEGA 56 at 4199 yuan. The first two models have already been released, while the RX VEGA 56 officially launched on August 28.
 RX VEGA 64 Graphics Card
Friends who are following desktop graphics cards should know that NVIDIA graphics cards have an advantage over AMD graphics cards, primarily due to a larger number of models, stronger high-end performance, and better power efficiency, as NVIDIA holds a larger market share. How competitive are AMD’s newly released RX VEGA 64/56 graphics cards? According to the ladder chart, all three models are based on advanced 14nm technology (Computer Baishi Network PC841.Com), with memory capacity reaching 8GB, comparable to NVIDIA’s high-end GTX1080 graphics card. However, in terms of power consumption, AMD still falls short.
The RX VEGA 64 air-cooled version has a power consumption of 295W, while the water-cooled version reaches 345W. Even the RX VEGA 56, which has relatively lower specifications, has a power consumption of 210W. In contrast, the GTX1080, which performs similarly to the RX VEGA 64 water-cooled version, has a power consumption of only 180W, nearly half the power consumption. Even the more powerful GTX1080Ti has a power consumption of only 250W. Although AMD’s new high-end graphics cards have caught up with NVIDIA in performance, power consumption control remains a significant drawback.