
Click “Read Original” to view Liangxu’s original video.
Author: Sanhua
Source: Official Account “Alibaba Cloud Native”
Introduction: The value of technical communication is not only reflected in shortening our application development path through commercial products and open-source projects, accelerating business launch rates, but also in sharing experiences from excellent engineers in improving work efficiency, optimizing product performance, and enhancing user experience to elevate our professional capabilities. This article’s author, Alibaba technical expert Sanhua, shares his and his team’s philosophy and experiences in creating good architecture diagrams, first published on Alibaba’s internal technical sharing platform, with contributions from Zijing, Pengsheng, and Yule.
When we want to describe our system with one or several diagrams, do we often encounter the following situations:
-
Staring at the canvas with no idea where to start, deleting and starting over?
-
Using one diagram to describe my system so that product, operations, and development can all understand it?
-
Unclear who the audience is halfway through drawing?
-
Is the drawn diagram a product feature diagram, a technical diagram, or a mixed bag?
-
Are there too few boxes in the diagram, should I add more?
-
Not satisfied with the layout no matter how I draw it…
If you have similar confusions, this article will introduce a methodology for drawing diagrams to make architecture diagrams clearer.

First Clarify Some Basic Concepts
Architecture is an abstract description of the entities in the system and the relationships between them, a series of decisions.
Architecture is structure and vision.
System architecture embodies concepts, distributing the correspondence between the functional and formal elements of objects/information, defining the relationships between elements and the relationships between elements and their surrounding environment.
Doing architecture well is a complex task and a large topic, which will not be explored deeply in this article. Once the architecture is established, stakeholders need to understand and follow the related decisions.
2. What is an Architecture Diagram
A system architecture diagram is an abstract representation of the overall outline of a software system and the interrelationships and constraints between various components, as well as an overall view of the physical deployment of the software system and its evolution direction.
3. The Role of Architecture Diagrams
A picture is worth a thousand words. To help stakeholders understand and follow architectural decisions, architectural information needs to be communicated. Architecture diagrams serve as a good medium. Therefore, the purpose of drawing architecture diagrams is to:
-
Resolve communication barriers
-
-
4. Types of Architecture Diagrams
Many materials have been collected, and there are many classifications. A popular one is the 4+1 view, which includes scenario view, logical view, physical view, process flow view, and development view.
The scenario view is used to describe the relationship between system participants and functional use cases, reflecting the system’s final requirements and interaction design, usually represented by use case diagrams.
The logical view is used to describe the relationships between components after decomposing the system’s software functions, component constraints, and boundaries, reflecting the overall composition of the system and the process of how the system is constructed, usually represented by UML component diagrams and class diagrams.
The physical view is used to describe the mapping relationship between system software and physical hardware, reflecting how the system’s components are deployed on a set of computable machine nodes, guiding the software system’s deployment process.
The process flow view is used to describe the communication timing between system software components, the input and output of data, reflecting the functional and data flow of the system, usually represented by sequence diagrams and flowcharts.
The development view is used to describe the module division and composition of the system, as well as the internal package composition design, serving developers and reflecting the system development process.
The above five types of architecture views represent different characteristics of a software system from different angles, combining to describe the system architecture as an architectural blueprint.

What Makes a Good Architecture Diagram
The classifications above are summaries of previous experiences, and the diagrams were also taken from online sources. So, are these diagrams well drawn? Should we blindly follow these examples?
Without worrying about the quality of these diagrams, we reflected on their classifications and purposes, and summarized that before drawing a good architecture diagram, we should first clarify its audience and then think about what information we want to convey to them. Therefore, do not draw a physical view just for the sake of it, or a logical view just to have one; rather, based on the different audiences and the different information being conveyed, use the diagrams to express accurately. The direct standard for whether the drawn diagram is good or not is: did the audience accurately receive the information that was intended to be conveyed?
After clarifying these two points, from the audience’s perspective, a good architecture diagram should be self-descriptive, requiring no explanation, and should possess consistency and sufficient accuracy, able to resonate with the code.

Common Problems Encountered When Drawing Architecture Diagrams
1. What Does a Box Represent?
Why use boxes instead of circles? Does it have any special meaning? Using boxes or other shapes arbitrarily may cause confusion.
2. What Do Dotted Lines, Solid Lines Mean? What About Arrows and Colors?
Using lines or arrows haphazardly can lead to misunderstandings.
3. Runtime vs Compile-Time Conflicts? Hierarchy Conflicts?
Architecture is a complex task, and using a single diagram to represent it can easily lead to confusing semantics.

Recommended Drawing Methods in This Article
The C4 model uses containers (applications, data stores, microservices, etc.), components, and code to describe the static structure of a software system. These types of diagrams are relatively easy to draw and provide key points for drawing, but most importantly, they clarify the potential audience and significance of each diagram.
The following cases come from the C4 official website, supplemented with some of our understandings, to see how to better express software architecture.
This is an imagined internet banking system to be built, which uses an external mainframe banking system to access customer accounts and transaction information, and sends emails to customers through an external email system. It can be seen that it is very simple and clear, and does not require explanation; it is easy to understand, containing the system to be built, its customers, and the surrounding systems that interact with it.
This simple diagram can tell us what the system to be built is; who its users are; how it will integrate into the existing IT environment. The audience for this diagram can be both internal members of the development team and external technical or non-technical personnel. That is:
-
What the system being built is
-
-
How it will integrate into the existing IT environment
The system is in the center, surrounded by users and other systems interacting with it. The key to this diagram is to clarify the users of the system being constructed and high-level dependencies, and once clarified, it only takes a few minutes to draw.
The container diagram expands on the system to be built from the context diagram.
In the above diagram, in addition to users and peripheral systems, the system to be built includes a Java/Spring MVC-based web application providing the system’s functional entry point, a Xamarin-based mobile app providing mobile functionality, and a Java API application providing services, with a MySQL database for storage, and the interactions between various applications are clearly marked on the arrows.
When looking at this diagram, one does not focus on whether the boxes are right-angled or rounded, or whether the arrows are solid or dotted; even the direction of the arrows does not draw much attention.
We have many drawing methods that define the meanings of boxes and lines, and both the person drawing and the person reading the diagram need to clearly understand these definitions to fully comprehend the information in the diagram. In reality, this is often a very high requirement, so many diagrams can only convey a rough meaning.
The audience for this diagram can be internal or external developers, as well as operations personnel. Its purposes can be listed as:
-
Demonstrates the overall shape of the software system
-
Reflects high-level technical decisions
-
Shows how responsibilities are distributed within the system, and how containers interact
-
Informs developers where to write code
Use a block diagram to represent, possibly including names, technology choices, responsibilities, and the interactions between these block diagrams, and if external systems are involved, it is best to clarify the boundaries.
The component diagram expands on a specific container, describing its internal modules.
This diagram is primarily for internal developers, showing how to organize and construct the code. Its purposes include:
-
Describes what components/services the system consists of
-
Clarifies the relationships and dependencies between components
-
Provides a framework for how software development can be decomposed for delivery
This diagram is evidently for technical personnel and is quite common, so it will not be detailed here.

Case Sharing
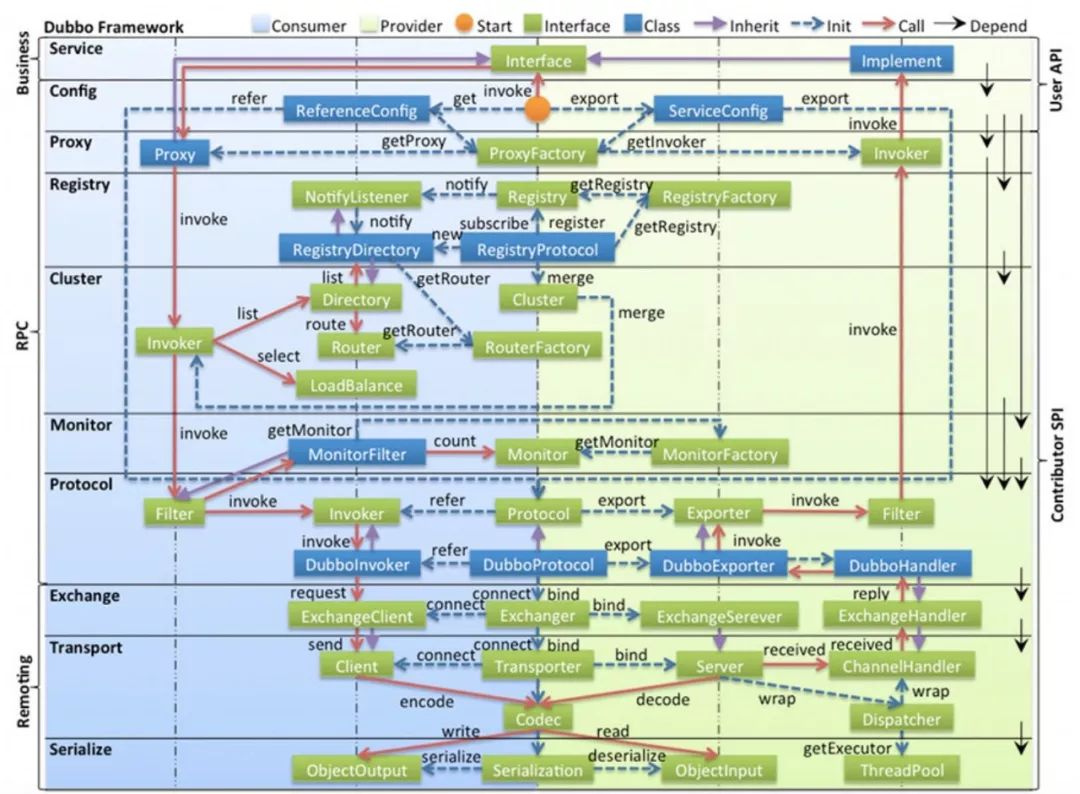
Below is the architecture diagram of an internal real-time data tool. As a self-descriptive architecture diagram, no further explanation is needed. If there is something unclear, it must be that it is not drawn well enough.
There are many methodologies for drawing good architecture diagrams. This article mainly introduces the C4 method, which is constantly evolving. However, regardless of which drawing methodology is used, we return to the original intention of drawing: better communication. We should not be limited by rigid frameworks in the drawing process. In short, before drawing, think about: who is the audience, what to convey, and how to make it understandable without explanation.
Liangxu’s Personal WeChat
Add Liangxu’s WeChat to receive 3 sets of essential materials for programmers
→ Selected technical materials shared
→ High-level exchange community
All articles on this public account have been organized into a directory; please reply “m” in the public account to get it!
Recommended Reading:
Linux System Hardware Information Viewing Tool, 100 Times Better than Device Manager!
How to Choose a Git Branching Model?
Finally Turned an Old Computer into a Server! Almost Got Taken by My Girlfriend for a Wash Basin, So Nice!
5T Technical Resources Giveaway! Including but not limited to: C/C++, Linux, Python, Java, PHP, Artificial Intelligence, Microcontrollers, Raspberry Pi, etc. Reply “1024” in the public account to get it for free!!