Introduction
This article discusses how front-end engineers can use HTTP proxies for debugging, going beyond the limitations of DevTools. Today’s article is shared by Front-end Morning Reading @huli.
As a front-end engineer who deals with web pages daily, it is quite reasonable to be familiar with the use of DevTools. Whenever there is an issue with an API, I press the shortcut to open DevTools, switch to the Network tab, find the red line, right-click to copy it as cURL, and paste it into the group chat for the backend team to investigate the issue.
But I wonder if anyone has encountered situations where DevTools is not sufficient; what should we do then?
Is DevTools Really Insufficient? Or Is It Just That You Don’t Know How to Use It?
Let me share a few real cases I’ve encountered. If DevTools can solve the problem, that would be the most convenient, but sometimes I can’t resolve it (it might also be that I don’t know how to use it). Additionally, the DevTools mentioned here refer to Chrome DevTools; perhaps other browsers do not have these issues.
Request Details Before Redirection Are Not Visible
Many websites implementing OAuth-related services will redirect to a redirect URL after logging in, carrying a code. Some websites will then use this code to exchange for an access_token and subsequently redirect to the next page with the access_token. If there is an issue with the code exchanging for the access_token, how do we debug it?
Chrome DevTools, by default, clears the console and network data when navigating to another page. There is an option called “Preserve log” that seems to solve the problem, but it actually does not.
You can randomly find a webpage, open DevTools, check the Preserve log option, and then execute the following code:
fetch('https://httpbin.org/user-agent')
.then(()=> window.location ='https://example.com')
After the redirection is complete, although you can see the request in the Network tab, clicking on it will only show “Failed to load response data”:
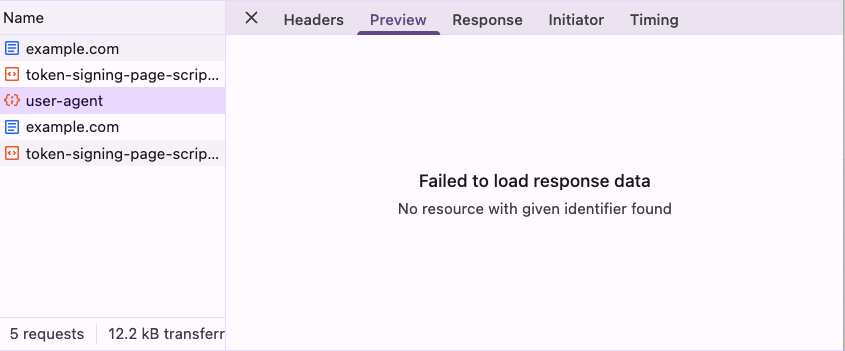 Cannot see the request
This issue has been reported since 2012, and after waiting for over a decade, it was mentioned at the end of 2023 that it would be on the roadmap for 2024, but there has been no further updates: DevTools: XHR (and other resources) content not available after navigation.
The essence of this problem is that once the page redirects, the browser discards the network request data from the old page. Therefore, even if the request has been sent, DevTools cannot retain or view the response.
In summary, in this situation, not being able to see the response makes debugging nearly impossible, which is quite inconvenient.
WebSocket Connection Handshake Failure Without Clear Reason
Although we usually establish a WebSocket connection with just one line of code, it actually involves two steps behind the scenes.
The first step sends an HTTP Upgrade request, and only after that does it switch to the WebSocket connection. While the first step usually succeeds, what happens if it fails?
We can ask AI to write a simple demo:
- Write a Node.js WebSocket server and place an Nginx in front of it.
- The role of Nginx is to return a 500 error when the URL contains ?debug.
- When the WebSocket connection is established, it will automatically send a hello message to the client.
- Finally, package it to run with Docker Compose.
After AI generates it, run it with Docker, and when you open a webpage to establish a connection, you will find that the connection request with debug fails, but you have no idea why:
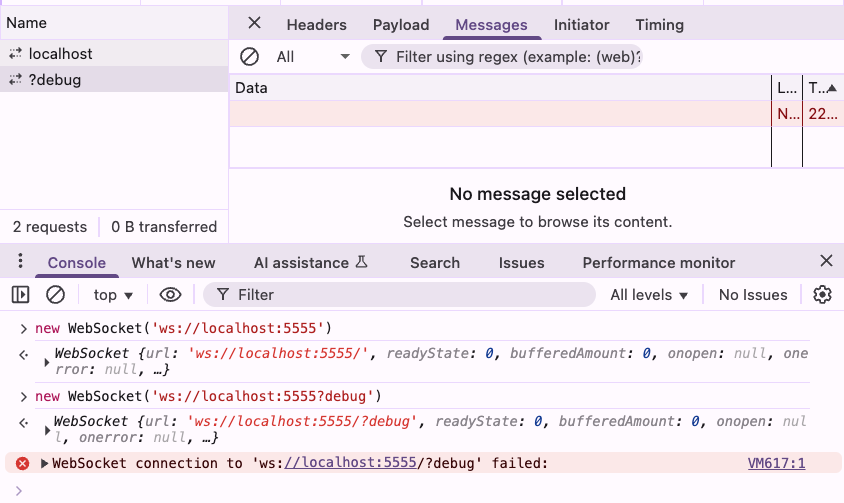 Cannot see the reason
This error message is similar to connecting to a random closed port, leaving you completely unaware of why it failed, making it difficult to communicate the issue to the backend.
In fact, when encountering a WebSocket handshake failure, you can also try using other methods to assist in debugging, such as using <span>curl -i --include</span> to manually simulate the HTTP Upgrade request and check if it is being blocked by the backend or proxy server. This is a good alternative when you cannot obtain detailed error information from the browser.
These are two examples I remember, but in actual development, there are likely many more cases where relying solely on DevTools to view the network is insufficient, either because you cannot see anything or what you see is incorrect.
Simple and Useful HTTP Proxy
Since we cannot rely on DevTools, we must turn to lower-level tools, such as HTTP proxies! Some tools will run a proxy on your local machine, allowing all traffic to pass through it, enabling you to see all requests without being limited by DevTools.
An HTTP proxy acts as a relay station between you and the website: all traffic first goes to the proxy and then to the target server. This allows you to intercept, view, and even modify request and response content completely. This is why proxies can break through the limitations of browser DevTools and directly obtain the raw data you want.
Another benefit is that you have a point of comparison; if the proxy shows something different from what DevTools displays, it is possible that there is an issue with what DevTools is showing.
Therefore, I sincerely recommend everyone to find an HTTP proxy to use. The three I have used are:
- Charles
- Burp Suite
- mitmproxy
When I first encountered proxies, I used Charles, but after getting into security testing, I switched to Burp Suite. It is actually a tool that can be used for various security-related tests, but I think it is perfectly fine to use it just as a proxy; it is very convenient.
The third one, mitmproxy, is open-source and free, and it is quite well-known. I occasionally use it, but in a different way, which I will explain later.
Using Burp Suite as a Proxy App
First, download and install the free community version from the official website: https://portswigger.net/burp/communitydownload
After opening it, click Next and then Start Burp to see the main interface. You will notice it has many features, but we will first switch to the “Proxy” tab and the “HTTP history” page:
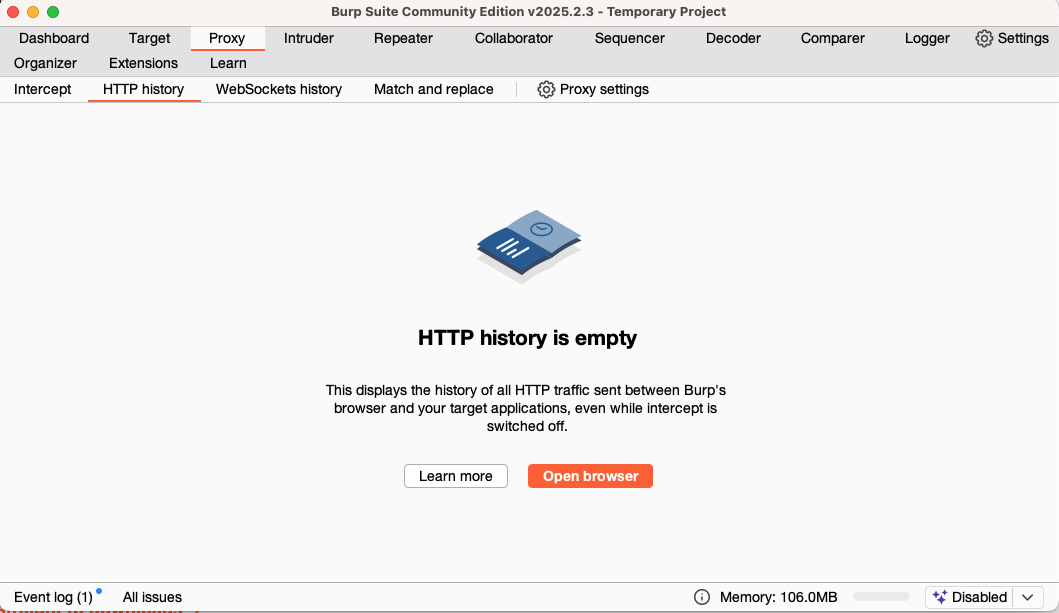 Burp Interface
Then click the prominent orange “Open Browser” button, which will launch its built-in Chrome browser. You can use this browser to access any webpage, such as example.com.
Next, switch back to the tool, and you will find that the HTTP history records all the original content and responses of the requests:
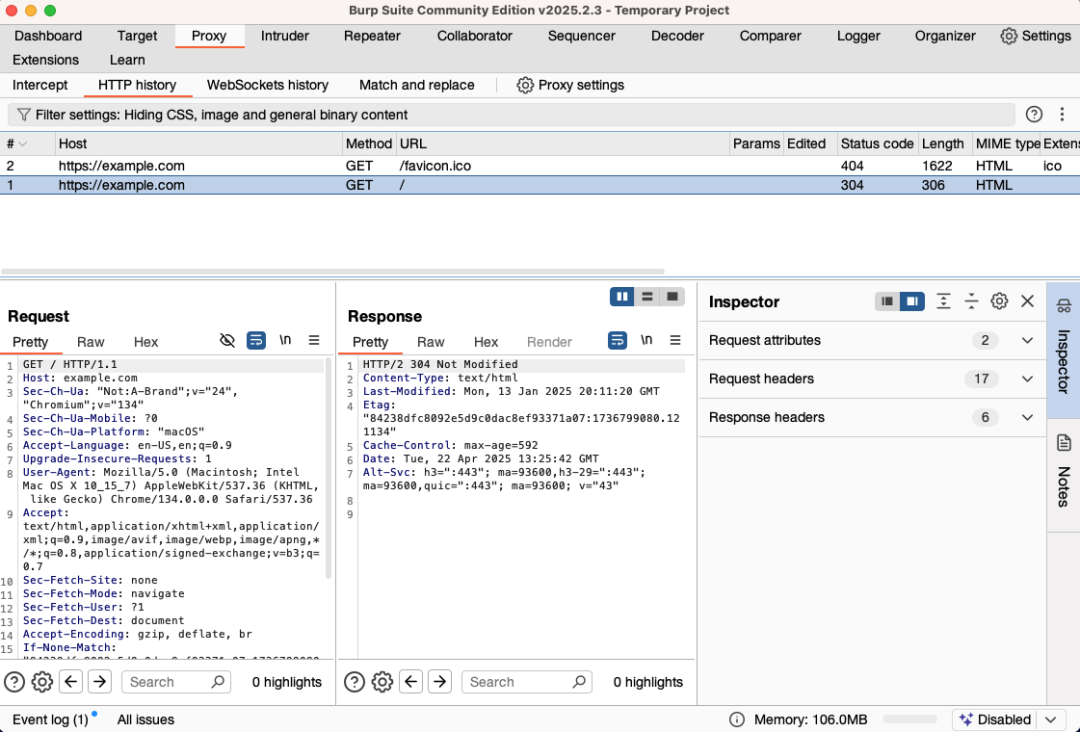 Request Records
In this way, the previously mentioned redirection case and WebSocket handshake failure can both be seen here with the original request content, making errors clear at a glance:
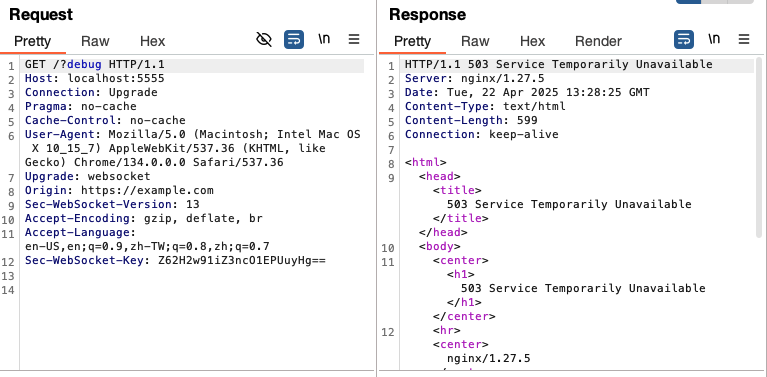 Original Content
If in the future you encounter requests that are not visible, it may be because they have been filtered out by the default filter. Click on Filter settings, select show all, and then apply; you should be able to see them.
If you encounter issues with insecure connections, you need to install the certificate first. Please refer to: Installing Burp’s CA certificate.
This is a basic introduction to using Burp Suite as an HTTP proxy. If you do not want to use the Chrome it provides, you can also set your computer or browser’s proxy; it defaults to port 8080.
For example, on my Mac, I have another Chrome Canary installed specifically for debugging. I can use this command to start it and set the proxy location:
open -a "Google Chrome Canary" --args --proxy-server="http://localhost:8080"In this way, you can debug using your familiar browser.
By the way, Burp Suite has many other features, such as request replay or brute force cracking, etc., but I think it is already very helpful for general engineers to use it as a proxy. For those interested in the complete functionality, you can refer to the series “Web Penetration Testing – Complete Burp Suite Tutorial” written by HackerCat.
Using mitmproxy with Scripts to Dynamically Change Content
I won’t go into detail about the installation process for mitmproxy; you can refer to the official documentation or collaborate with AI to install it yourself. After installation, remember to visit http://mitm.it to download and install the certificate to intercept HTTPS traffic.
Once everything is installed, executing <span>mitmproxy</span> will start the proxy, and you will see a CLI interface.
Since Burp Suite is already very useful, when would you use mitmproxy? It has a useful feature that allows you to customize the behavior of the proxy through simple Python scripts, which is very convenient.
For example, suppose for some reason, the testing environment cannot fully simulate the production environment, but you cannot directly deploy the code to the production environment for testing. In this case, you can use the proxy to dynamically replace the production response and simulate some behaviors locally.
Although Chrome also has a response overriding feature, it has many limitations, such as fixed content, etc. Using a proxy with scripts is definitely a more flexible and higher degree of freedom option.
Here is a simple mitmproxy script that aims to replace my blog’s script.js with a local version:
 from mitmproxy import http
import requests

URL_MAPPINGS={
"https://blog.huli.tw/js/script.js":"http://localhost:5555/script.js",
}

def request(flow: http.HTTPFlow)-> None:
    for url in URL_MAPPINGS:
        if flow.request.pretty_url.startswith(url):
            replacement_url = URL_MAPPINGS[url]
            replacement_response = requests.get(replacement_url)
            flow.response = http.Response.make(
                200,
                replacement_response.content,
                {"Content-Type":"application/javascript"}
            )
    return
You can run it with this command:
mitmproxy -s proxy.pyThen use the previously mentioned command to open a browser with the proxy server set up:
open -a "Google Chrome Canary" --args --proxy-server="http://localhost:8080"Now, when you visit https://blog.huli.tw, you will see that the content of the script has been replaced.
Conclusion
This concludes my introduction to some proxy servers and their usage that I commonly use.
Relying too much on the browser is not a good thing; if the browser does not display anything, you won’t know what to do. However, as front-end engineers on the front lines, we definitely have ways to obtain the entire request and response to clarify issues further. In the future, if you encounter problems where requests are not visible in the browser, consider using a proxy server to obtain the complete requests and responses.
In addition to web pages on computers, mobile devices can also use this; you can set up a proxy server on Android to connect to the same Wi-Fi as your computer, and then install the certificate on your phone to intercept mobile traffic.
Lastly, a small tip: when executing commands in the Mac terminal, add:
https_proxy=http://localhost:8080This will configure the proxy server. For example:
https_proxy=http://localhost:8080 cursorThis will route the traffic of the Cursor IDE to the proxy server.
About this articleAuthor: @huliOriginal: https://blog.huli.tw/2025/04/23/everyone-need-a-http-proxy-to-debug/