Last issue’s answer:
4.3.2 Plotting Surface Graphs Based on Function Expressions
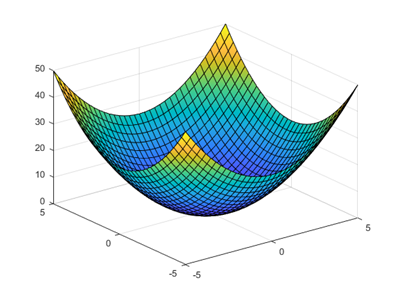
Matlab Practice 4.3.2: Plotting Surface Graphs Based on Function Expressions
[Reference Video31.16, available on Bilibili]
Program:
z=@(x,y)x.^2+y.^2;
fsurf(z)
Execution Result:
 ——————— Simple Divider —————————
4.4 3D Curve Graph
4.4.1 Parametric Function Curve Plotting
Parametric functions:x(t)=t, y(t)=sin(t), z(t)=exp(t), t∈[-10,10], plot the graph of this 3D function.
(Note: Only a 3D curve graph can be plotted here, a 3D surface graph cannot be plotted. Think about why this is the case, feel free to leave comments in the comment section.)
(The answer will be announced in the next issue)
Recommended Popular Content from Previous Issues
-
Matlab Quick Practice Exercise 4.3.1: Plotting Surface Graphs Based on Data
-
Matlab Quick Practice Exercise 4.2.3: Parametric Function Plotting
-
Matlab Easy Practice Exercise 4.2.2: Piecewise Function Plotting
-
Matlab Daily Practice Exercise 4.2.1: Implicit Function Plotting
-
Matlab Daily Practice 4.1.6: Plotting Gradient Color Graphics
-
Matlab Practice Exercise 4.1.5: Polar Coordinate Plotting
-
Matlab Standard Practice Exercise 4.1.4: Plotting Logarithmic Scale Graphs
-
Matlab Practice Exercise 4.1.3: Plotting Pie Charts
-
Matlab Practice Exercise 4.1.2: Plotting Bar Charts
-
Matlab Practice Exercise 4.1: Data Plotting: Plotting Dual Y-Axis Graphs
-
Matlab Practice Exercise 3.4: Writing Formatted Data to Text Documents
-
Matlab Practice Exercise 3.3.2: Writing Student Information to Excel Files
-
Matlab Practice Exercise 3.3.1: Writing Data to Specific Areas in Excel Files
-
Matlab Beginner Short Article 55: Symbolic Computation: Arithmetic, Relational, and Logical Operations
-
Matlab Literacy Simplified Article 56: Detailed Explanation of the Use of Assumptions in Symbolic Computation (Very Important), e.g., assuming a>0, solving equations.
End