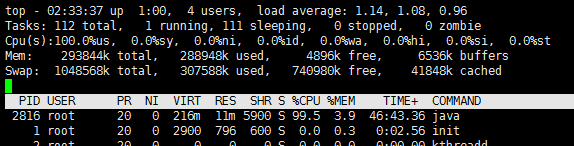
Background: After the service has been running smoothly for a while, the CPU suddenly spikes. By using the top command, we can confirm which process is causing the CPU spike (could it be a false alarm?).
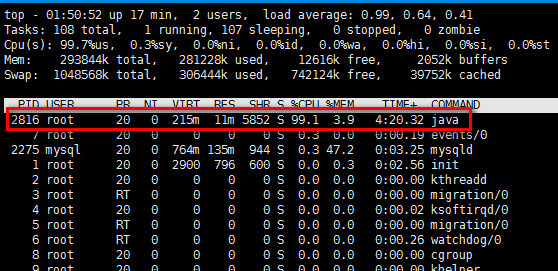
top
From the image above, we can see that the process with PID 2816 has a very high CPU usage. Using top -Hp 2816 allows us to observe the threads under that process. In the image, we can find that thread 2825 has a very high CPU usage.
Check Thread Information Under the Process
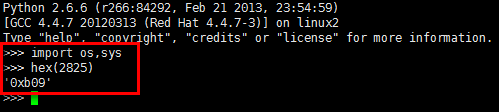
Here, we conveniently used Python to convert the decimal thread ID into hexadecimal.
Base Conversion
Why do we do this? Because the thread DUMP file used in the next steps requires the hexadecimal NID.
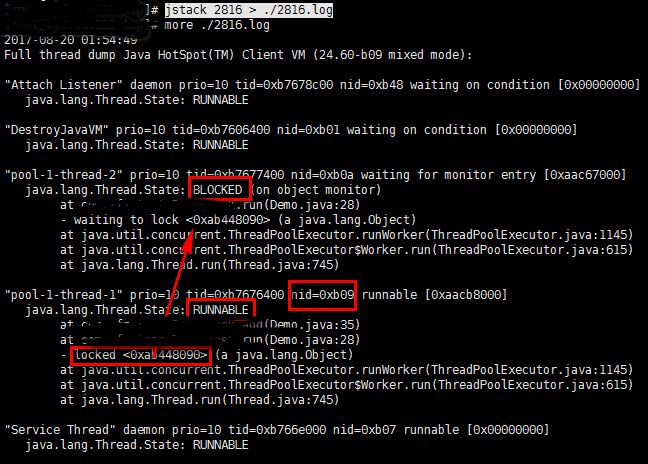
Thread DUMP File
In practice, we should use jstack pid to perform multiple DUMPs, as threads can change states, and multiple DUMPs help capture more information about the threads. In the image, you can observe that one thread has acquired a lock and is running, but has not released it for a long time, while another thread is waiting for this lock. At this point, we can go check the code to analyze why the lock has not been released.

Thread State Transition
The above case used top, and in practice, top provides a lot of information, which we will analyze in detail here.
top
The first line: involves two times, one is the system time, and the other is the machine running time. [We should focus on the machine running time, Why? Sometimes, rebooting the machine can solve many problems, you know!]
How many users are logged into the system? [More information can be found through who/w/history]
What do the three load values mean? They represent the load situation of the machine over 1MIN, 5MIN, and 15MIN. How to determine the size of the load? It needs to be combined with the number of CPU cores, for example, if the machine has a 4-core CPU, then if the load value exceeds 4, it means the load is very high! [Pressing 1 in top allows you to observe the number of CPUs]. For more information on system load, you can read the previous article Linux Load Average Meaning (please click me).
The second line: mainly shows the total number of tasks, with a focus on the number of zombie state tasks.
The third line: mainly shows some information about the CPU.
US/SY: refers to the proportion of CPU usage by user processes and system processes.
NI: refers to NICE, indicating the proportion of processes with adjusted thread priorities, which should not be very large.
ID: indicates idle; WA indicates the waiting time for resources, for example, if there is a sudden high traffic and the service logs a lot, this value will spike as it consumes a lot of resources.
HI: hardware interrupts, usually caused by external devices; if HI spikes, it means there is a problem at the hardware level with the external device. SI indicates software interrupts.
ST: refers to steel; if the host is virtual, this ST information will appear, indicating the percentage of CPU time slices that the virtual machine obtains from the host.

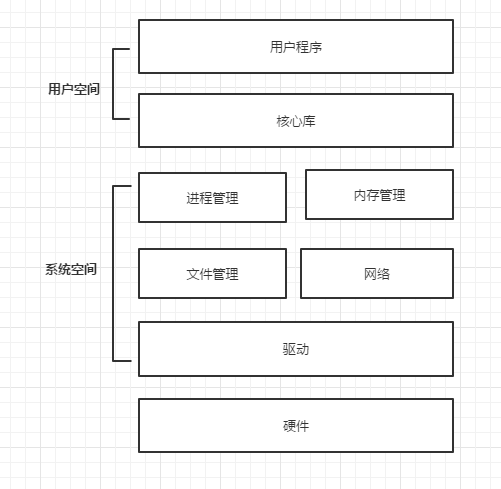
User Space and System Space
The fourth and fifth lines: mainly discuss two conceptual items: buffer and cache.
Buffer mainly refers to data waiting to be processed and addresses the speed mismatch between two systems. Cache, on the other hand, generally refers to cached result data, such as loading some information from the DB for query purposes.
The SWAP partition is intended to use part of the hard disk as a cache; if SWAP is very frequently swapped, it indicates that memory is insufficient!
List Explanation: PID Process ID, USER User, PR Priority, VIRT Virtual Memory, RES Resident Memory, SHR Shared Memory
It should be noted that RES indicates the actual memory occupied by the process, not the requested memory size. That is, the physical memory occupied by the current process is RES-SHR.
Recommended Reading:
Complete Organization | Directory of 365 High-Quality Technical Articles
A diagram clarifying classic issues and solutions in cache architecture design
A diagram summarizing 33 golden rules in system design
The 10 Algorithms That Dominate This World
Thoroughly Understanding Cookie, Session, Token
Focused Summary of Server Backend Technology Stack Knowledge
Welcome to Follow and Exchange for Mutual Progress
Coding with Dao discusses technology, workplace topics, and internet matters with you!