Through CMake performance analysis, you can identify the most time-consuming operations when reloading projects and optimize your CMake scripts when necessary.
Performance analysis is applicable to CMake version 3.18 and above. CMake stores results in Google’s tracing event format. CLion’s integrated features can help you run traces and visualize the results.
Performance analysis is not supported for preset CMake configuration files.

Enabling Tracing
Enabling tracing requires two flags: --profiling-format=google-trace and --profiling-output=path. After setting these flags, CMake will generate a JSON file containing the tracing results and place it at the specified path.

In CLion, you can enable tracing using one of the following options:
-
Manually Add
Go to Settings | Build, Execution, Deployment | CMake and select the configuration file you want to trace. Add these flags in the CMake options.
👇Click to Claim👇 👉C Language Knowledge Resource Collection -
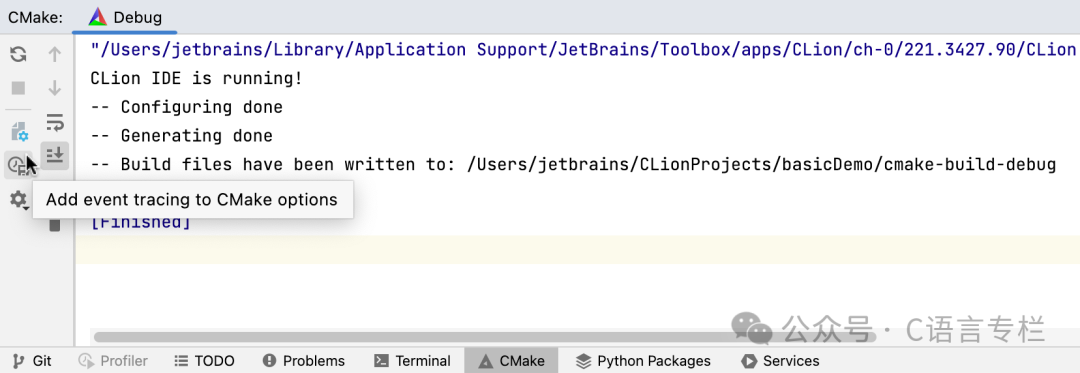
Automatically Add
After loading the configuration file to be traced, click “Add Event Tracing to CMake” in the CMake tool window:
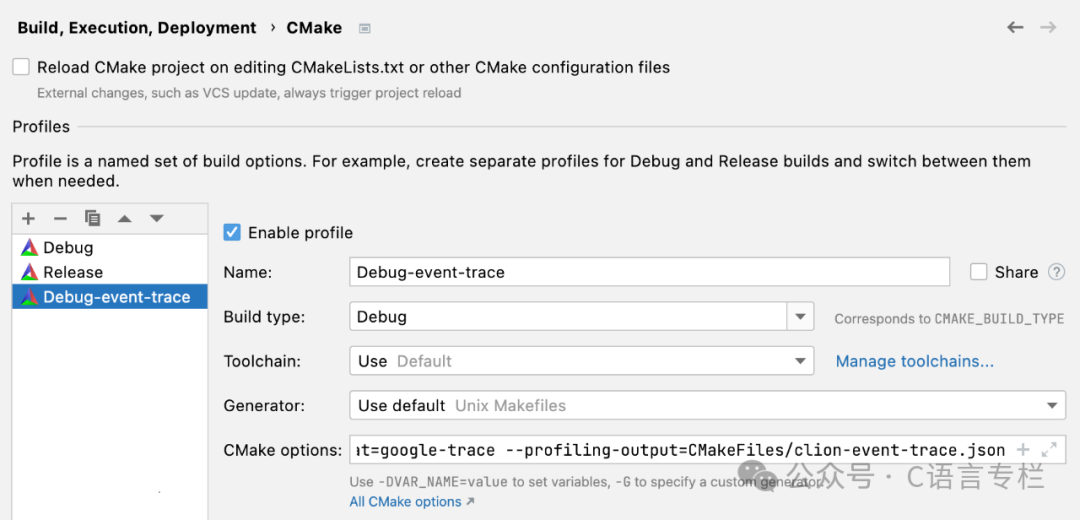
CLion will create a copy of the configuration file and add the necessary options. The new configuration file will have the same name with the -event-trace suffix:
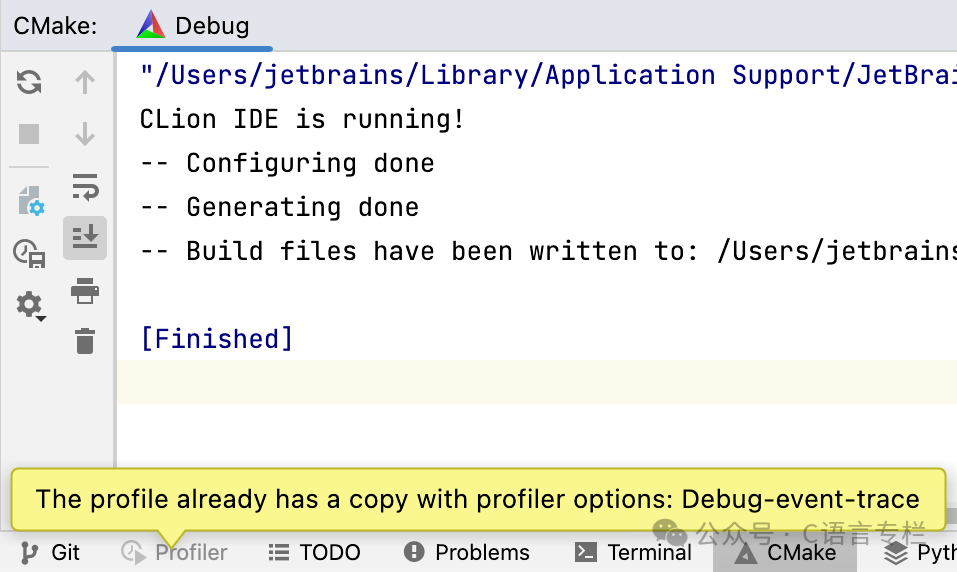
If there is already a tracing configuration file, the IDE will detect it and show a notification:
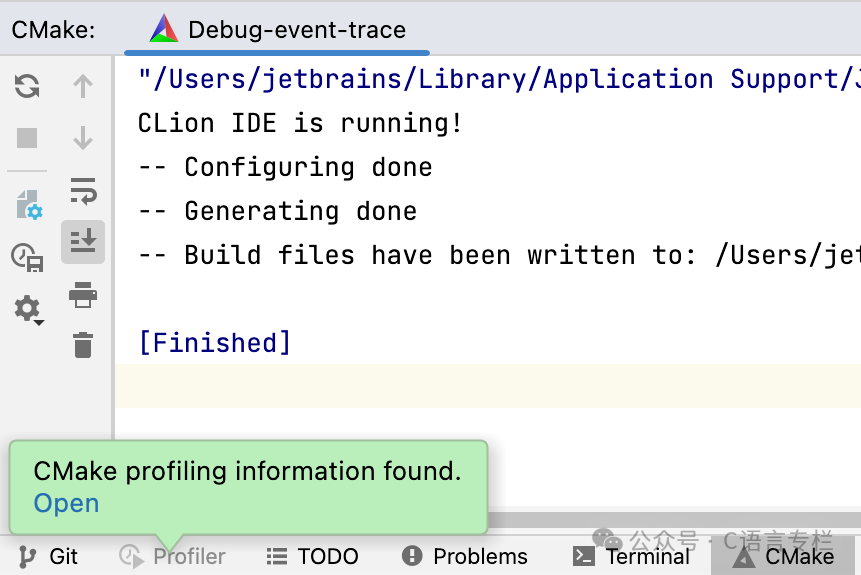
After adding the tracing flags, CLion will collect tracing information each time the project is reloaded. Click the link in the notification to open the results:
If you already have a .json file containing tracing results, you can open it in CLion by running | Open Analyzer Snapshot.
Viewing Results
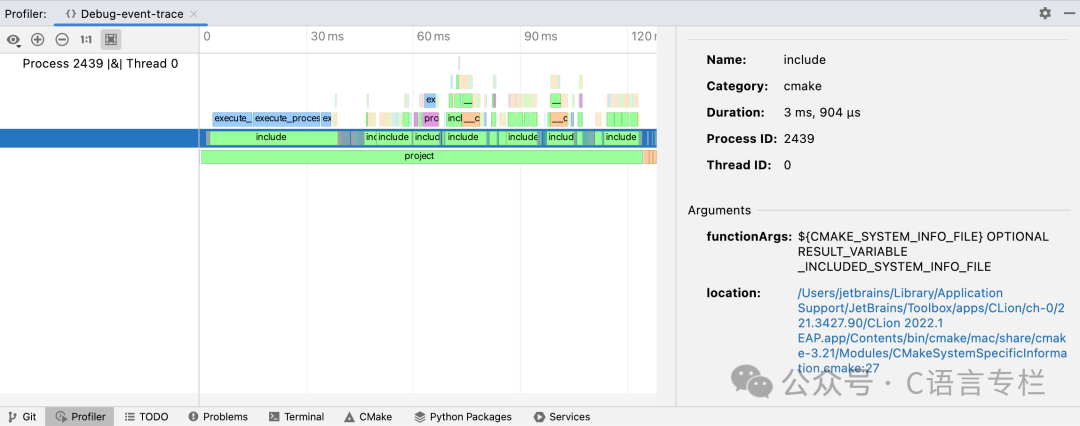
CLion presents the results in the Analyzer tool window:
-
In the left pane, you can find the process and thread IDs of the CMake reload process.
-
In the central pane, you can view the flame graph of the process. The flame graph displays a collection of stack traces: rectangles represent frames of the call stack, arranged by width.
To zoom in on the flame graph, hold down Ctrl and scroll the mouse wheel, or use
 and
and  buttons.
 -
In the right pane, you can view the details of the events selected in the flame graph. This includes function names, durations, function parameters, and the location of that function in the CMake script.
You can also hover over a block to show a tooltip containing event details:
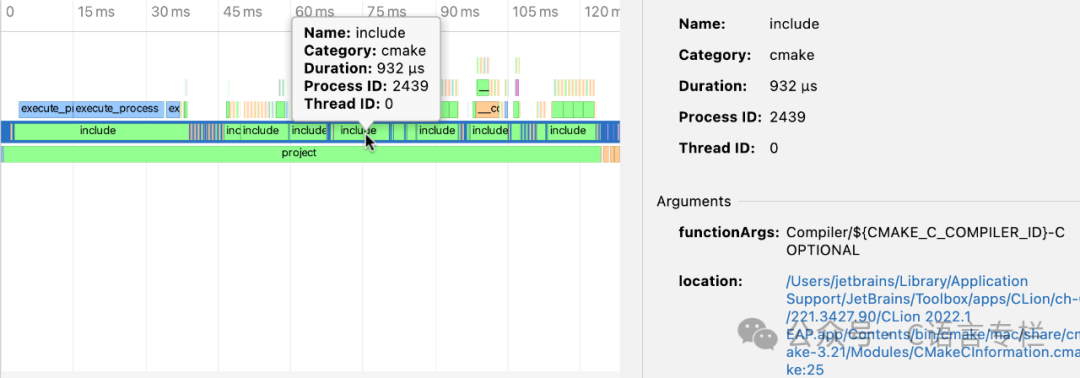
Clicking the location link will jump to the corresponding line.
Popular Recommendations
-
Why do some people have average work abilities but perform well in interviews…
-
Can someone who was detained for solicitation pass a background check at a big company?
-
I’ve submitted my resignation, but the company won’t let me go and insists I stay for 30 days. What should I do if I can’t wait that long for the offer I’ve received?