What is GDB
GDB stands for the GNU Project debugger, primarily used for debugging user-mode applications.
According to the official documentation, GDB supports debugging applications written in the following languages:
-
Ada -
Assembly -
C -
C++ -
D -
Fortran -
Go -
Objective-C -
OpenCL -
Modula-2 -
Pascal -
Rust
Of course, the most common use is for debugging applications written in C/C++.
This article is not a tutorial on using GDB, so it will not provide a detailed introduction to GDB’s usage. The purpose of this article is to teach you how to build a simple GDB from scratch. Therefore, it is best to have some understanding of GDB’s usage before reading this article.
There is a saying in the programming community: Don't reinvent the wheel. However, I believe that reinventing the wheel is the only way to truly understand the principles behind its implementation.
ptrace System Call
The core technology implemented by GDB is the ptrace() system call.
If you are interested in the implementation principles of ptrace, you can read this article: ptrace Implementation Principles
ptrace() is a complex system call mainly used for writing debugging programs. You can view the introduction to ptrace() using the following command:
$ man ptrace
The ptrace() system call is very powerful, but we will not use all of its features. Therefore, the convention of this article is that only the features used during the program’s development will be introduced in detail.
Simple GDB
We aim to implement a GDB with the following functionalities:
-
Can debug an executable program. -
Can set breakpoints while debugging the program. -
Can print information about the program while debugging.
Below, we will mainly elaborate on these three functionalities.
1. Debugging Executable Files
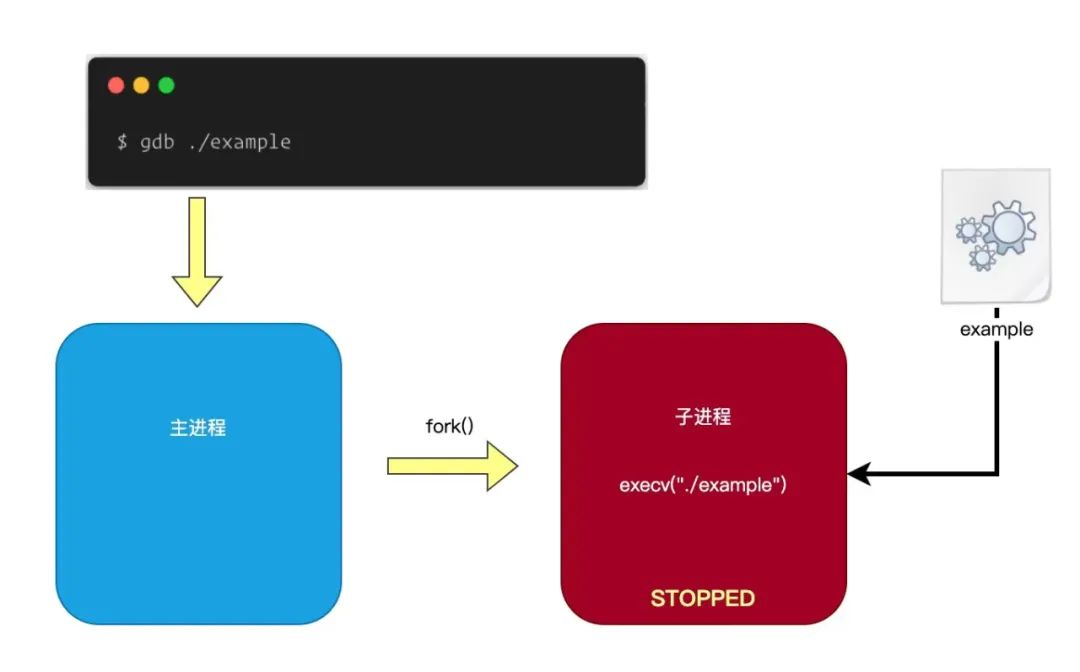
When we use GDB to debug a program, we generally load the executable file of the program directly into GDB, as shown in the command below:
$ gdb ./example
The execution process of the above command is as follows:
-
First, GDB calls the fork()system call to create a new child process. -
Then, the child process will call the exec()system call to load the executable file of the program into memory. -
Next, the child process enters a stopped state (stops running) and waits for the GDB main process to send debugging commands.
The process is illustrated in the figure below:
We can write code according to the above process:
Step 1: Create the Debugged Child Process
The debugging program is generally divided into debugged process and debugging process.
-
debugged process: the process that needs to be debugged. -
debugging process: mainly used to send debugging commands to the debugged process.
The implementation code is as follows:
int main(int argc, char** argv)
{
    pid_t child_pid;

    if (argc < 2) {
        fprintf(stderr, "Expected a program name as argument\n");
        return -1;
    }

    child_pid = fork();

    if (child_pid == 0) {               // 1) Child process: debugged process
        load_executable_file(argv[1]);  // Load the executable file
    } else if (child_pid > 0) {         // 2) Parent process: debugging process
        send_debug_command(child_pid);  // Send debugging command
    } else {
        perror("fork");
        return -1;
    }

    return 0;
}
The execution process of the above code is as follows:
-
The main process first calls the fork()system call to create a child process. -
Then the child process will call the load_executable_file()function to load the program to be debugged and wait for the main process to send debugging commands. -
Finally, the main process will call send_debug_command()to send debugging commands to the debugged process (child process).
So, next we will mainly introduce the implementation process of load_executable_file() and send_debug_command() functions.
Step 2: Load the Debugged Program
As mentioned earlier, the child process is mainly used to load the debugged program and wait for the debugging process (main process) to send debugging commands. Now let’s analyze the implementation of the load_executable_file() function:
void load_executable_file(const char *target_file)
{
    /* 1) Run trace (debug) current process */
    ptrace(PTRACE_TRACEME, 0, 0, 0);

    /* 2) Load and execute the debugged program's executable file */
    execl(target_file, target_file, 0);
}
The implementation of the load_executable_file() function is quite simple, with the main execution process as follows:
-
Call ptrace(PTRACE_TRACEME...)system call to inform the kernel that the current process can be traced, meaning it can be debugged. -
Call execl()system call to load and execute the debugged program’s executable file.
First, let’s look at the prototype definition of the ptrace() system call:
long ptrace(long request, pid_t pid, void *addr, void *data);
Now let’s explain each of its parameters:
-
request: The debugging command sent to the process; there are many commands that can be sent.For example, the commandPTRACE_TRACEMEdefined as 0 indicates that it can be debugged. -
pid: Specifies the process ID to which the debugging command is sent. -
addr: If you want to read or modify the content of a certain memory address of the process, you can specify it using this parameter. -
data: If you want to modify the content at a certain address of the process, the value to be modified can be specified using this parameter, used in conjunction with theaddrparameter.
So, the code:
ptrace(PTRACE_TRACEME, 0, 0, 0);
indicates to the kernel that the current process can be traced (debugged).
Next, when the execl() system call is invoked to load and execute the debugged program, the kernel will suspend the current debugged process (set its running state to stopped) and wait for the main process to send debugging commands.
When the running state of a process is set to stopped, the kernel will stop scheduling this process, unless another process changes its running state back to runnable.
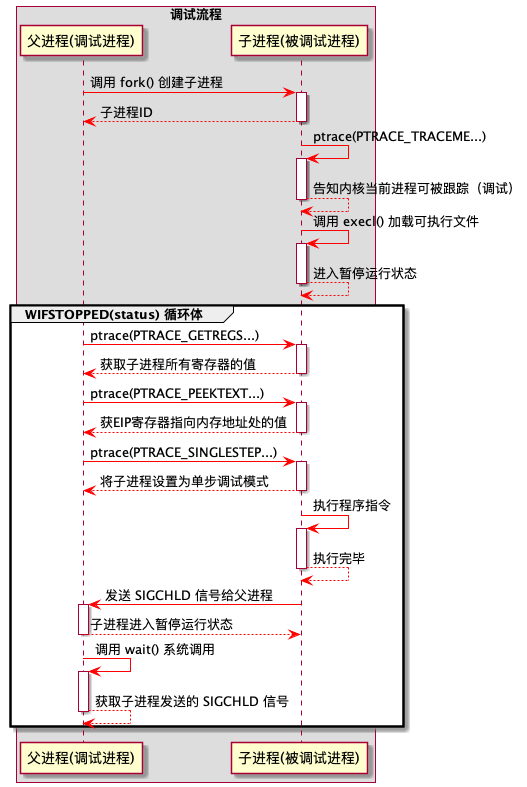
Step 3: Send Debugging Commands to the Debugged Process
We have arrived at the most important step, which is to send debugging commands to the debugged process.
Students who have used GDB to debug programs are very familiar with this. We can send commands such as step debugging, print current stack information, view a variable's value, and set breakpoints to the debugged process.
These commands can all be sent via the ptrace() system call. Below we introduce how to use the ptrace() system call to perform debugging operations on the debugged process.
void send_debug_command(pid_t debug_pid)
{
int status;
int counter = 0;
struct user_regs_struct regs;
unsigned long long instr;
printf("Tiny debugger started...\n");
/* 1) Wait for the debugged process (child process) to send a signal */
wait(&status);
while (WIFSTOPPED(status)) {
counter++;
/* 2) Get the current register information */
ptrace(PTRACE_GETREGS, debug_pid, 0, ®s);
/* 3) Get the value at the memory address pointed to by the EIP register */
instr = ptrace(PTRACE_PEEKTEXT, debug_pid, regs.rip, 0);
/* Print the current executing instruction information */
printf("[%u. EIP = 0x%08llx. instr = 0x%08llx\n",
counter, regs.rip, instr);
/* 4) Set the debugged process to single-step debugging and wake it up */
ptrace(PTRACE_SINGLESTEP, debug_pid, 0, 0);
/* 5) Wait for the debugged process (child process) to send a signal */
wait(&status);
}
printf("Tiny debugger exited...\n");
}
The implementation of the send_debug_command() function is somewhat complex. Let’s analyze the main execution process of this function:
-
1. When the debugged process is suspended by the kernel, the kernel sends a
SIGCHLDsignal to its parent process, which can capture this information by calling thewait()system call. -
2. Then we track the execution of instructions in a loop.
-
3. By calling
ptrace(PTRACE_GETREGS...), we obtain the values of all registers of the current process. -
4. By calling
ptrace(PTRACE_PEEKTEXT...), we obtain the value at a certain memory address. -
5. By calling
ptrace(PTRACE_SINGLESTEP...), we set the debugged process to single-step debugging mode, so that every time the debugged process executes an instruction, it will enter a stopped state.
The entire debugging process can be summarized in the following image:
Testing the Program
Finally, let’s test the effect of this simple debugging tool. We use the following command to compile the program:
$ gcc tdb.c -o tdb
After compilation, we will obtain an executable file named tdb. Then, we can use the following command to debug the program:
$ ./tdb <target_executable_file>
</target_executable_file>
For example, if we want to debug the ls command, we can enter the following command:
$ ./tdb /bin/ls
Tiny debugger started...
[1.  EIP = 0x7f47efd6a0d0.  instr = 0xda8e8e78948
[2.  EIP = 0x7f47efd6a0d3.  instr = 0xc4894900000da8e8
[3.  EIP = 0x7f47efd6ae80.  instr = 0xe5894855fa1e0ff3
[4.  EIP = 0x7f47efd6ae84.  instr = 0x89495741e5894855
[5.  EIP = 0x7f47efd6ae85.  instr = 0xff89495741e58948
[6.  EIP = 0x7f47efd6ae88.  instr = 0x415641ff89495741
[7.  EIP = 0x7f47efd6ae8a.  instr = 0x4155415641ff8949
[8.  EIP = 0x7f47efd6ae8d.  instr = 0x4853544155415641
[9.  EIP = 0x7f47efd6ae8f.  instr = 0xec83485354415541
[10.  EIP = 0x7f47efd6ae91.  instr = 0xf38ec8348535441
[11.  EIP = 0x7f47efd6ae93.  instr = 0x48310f38ec834853
[12.  EIP = 0x7f47efd6ae94.  instr = 0xc148310f38ec8348
[13.  EIP = 0x7f47efd6ae98.  instr = 0x94820e2c148310f
[14.  EIP = 0x7f47efd6ae9a.  instr = 0x48d0094820e2c148
[15.  EIP = 0x7f47efd6ae9e.  instr = 0xcfe0158d48d00948
[16.  EIP = 0x7f47efd6aea1.  instr = 0x480002cfe0158d48
[17.  EIP = 0x7f47efd6aea8.  instr = 0x480002c5d1058948
[18.  EIP = 0x7f47efd6aeaf.  instr = 0x490002cfd2058b48
[19.  EIP = 0x7f47efd6aeb6.  instr = 0xd140252b4cd48949
...
[427299.  EIP = 0x7fec65592b30.  instr = 0x6616eb0000003cba
[427300.  EIP = 0x7fec65592b35.  instr = 0x841f0f6616eb
[427301.  EIP = 0x7fec65592b4d.  instr = 0xf0003d48050ff089
[427302.  EIP = 0x7fec65592b4f.  instr = 0xfffff0003d48050f
Tiny debugger exited...
As we can see, running the ls command requires executing over 400,000 instructions.
Summary
This article briefly introduced the execution process of a debugger. Of course, this debugger currently does not serve much purpose.
The next article will introduce how to set breakpoints and view the current stack information of the process, which will be more interesting. Stay tuned!
Source code for this article can be found at: GitHub